

Abstract
The unfolding and refolding kinetics of >600 single GFPmut2 molecules, entrapped in wet nanoporous silica gels, were followed by monitoring simultaneously the fluorescence emission of the anionic and neutral state of the chromophore, primed by two-photon excitation. The rate of unfolding, induced by guanidinium chloride, was determined by counting the number of single molecules that disappear in fluorescence images, under conditions that do not cause bleaching or photoinduced conversion between chromophore protonation states. The unfolding rate is of the order of 0.01 min−1, and its dependence on denaturant concentration is very similar to that previously reported for high protein load gels. Upon rinsing the gels with denaturant-free buffer, the GFPmut2 molecules refold with rates >10 min−1, with an apparently random distribution between neutral and anionic states, that can be very different from the preunfolding equilibrium. A subsequent very slow (lifetime of ∼70 min) relaxation leads to the equilibrium distribution of the protonation states. This mechanism, involving one or more native-like refolding intermediates, is likely rate limited by conformational rearrangements that are undetectable in circular dichroism experiments. Several unfolding/refolding cycles can be followed on the same molecules, indicating full reversibility of the process and, noticeably, a bias of denaturated molecules toward refolding in the original protonation state.
INTRODUCTION
Investigations aimed at understanding the basic principles of protein folding span more than four decades (1,2), and cover theoretical, experimental, and computational approaches (3–10). In recent years, it has become clear that protein molecules fold via an ensemble of pathways that map a rough conformational energy landscape (3,4,11). Spectroscopic measurements that detect single molecule folding events were carried out with the aim to map the complete folding pathway and to probe the variability of different folding-unfolding trajectories. Most of these studies made use of peptides (12) or small proteins labeled with fluorescent probes able to report distance-dependent processes via FRET (13–15). Molecules were either free to diffuse in the observation field (16–18), immobilized on functionalized glasses (19), or within surface-tethered lipid vesicles (20,21). Several studies have discussed the difficulties and potential artifacts arising from these approaches (17,18,20).
Here, we present the investigation of the unfolding-refolding of single molecules of GFPmut2, a mutant of GFP containing a triple substitution, S65A, V68L, S72A, conferring enhanced fluorescence emission and high yield of protein expression due to a more efficient folding at 37°C (22). Fluorescence signals, generated by the intrinsic chromophore (23), were reported to be a marker for the structural integrity of the protein, fluorescence being completely lost upon disruption of the native topology (24–26). This has been recently confirmed by fluorescence and circular dichroism (CD) measurements of GFPmut2 unfolding and refolding carried out in solution (27). To monitor the unfolding-refolding events on the same single molecules, GFPmut2 was entrapped in wet nanoporous silica gels, a procedure that was proved not to perturb its overall (rotational) dynamic properties (28). Encapsulation of proteins in silica gels (29–37) is a powerful method to enhance their stability (38–44), to isolate and characterize individual tertiary and quaternary conformations (45–59), and to prepare a variety of biotechnological devices (32,33,36,37). The fluorescence emission of single molecules of GFPmut2 was monitored by two-photon microscopy. In this report, repeated unfolding/refolding cycles are followed on the same single molecules of GFPmut2 entrapped in wet silica gels to test any possible “memory effect” in the refolding process.
MATERIALS AND METHODS
Chemicals and buffers
All chemicals, purchased from Sigma-Aldrich (St. Louis, MO), except guanidinium chloride (GdnHCl) (Fluka, Buchs, Switzerland), were used without further purification. Experiments were carried out in a solution containing 50 mM TrisHCl, 600 mM NaCl, pH 6.6, at 37°C. Because silica gels bear a net negative charge at pH around neutrality (60), sodium chloride was added to the buffer to shield the gel matrix charges and avoid partitioning of the denaturant molecules between the pores of the gel and the surrounding medium (61).
GFPmut2 expression and purification
The GFPmut2 gene, cloned in a pKEN1 vector (62), was kindly provided by Dr. Brendan P. Cormack (Department of Microbiology and Immunology, Stanford University School of Medicine, Stanford, CA). Protein expression and purification was carried out as previously described (28). GFPmut2 stock solutions were dialyzed against 50 mM Tris buffer, pH 8.0, and kept at −80°C.
Protein encapsulation in silica gels
Encapsulation of GFPmut2 in silica gels was carried out according to Bettati and Mozzarelli (49). Two volumes of a solution containing GFPmut2 and 100 mM phosphate buffer, pH 7.5, were mixed with three volumes of a sol prepared by acid hydrolysis of tetramethyl orthosilicate (29). The final GFPmut2 concentration was ∼100 nM. Approximately 2 μl of the mixture were deposited in a circular microchamber, ≅5 mm in diameter and ≅500-μm thick, built on a glass slide. Upon gelation, protein-doped silica gels were covered with 100 mM phosphate buffer, 1 mM DTT, 1 mM EDTA, pH 7, and stored at 4°C for at least 12 h before use.
Unfolding-refolding experiments
For denaturation experiments a stock solution containing 6 M GdnHCl, 600 mM NaCl, 50 mM Tris, pH 6.6, was prepared. The stock solution was diluted with buffer to obtain the desired denaturant concentration. Unfolding and refolding experiments were carried out by rapidly rinsing silica gels doped with GFPmut2 with either a denaturant-containing or a denaturant-free solution.
Optical setup
The two-photon excitation (TPE) setup was based on two mode-locked Ti:sapphire lasers (Tsunami 3960, Spectra Physics, Irvine, CA and Chamaleon, Coherent, Santa Clara, CA) coupled to a Nikon (Tokyo, Japan) TE300 microscope. The lasers provide 280-fs pulses on the sample plane (63) at a repetition frequency of 80 MHz, in the range 720–950 nm. Optical collection is based on a PCM2000 scanning head (Nikon), adapted for TPE (64). The fluorescence signal, collected by a Plan Apochromat 100× oil objective (Nikon) with a N.A. = 1.4 and selected by one of three emission filters (HQ535-50, emission at 535nm, full width of 50 nm; HQ515-30, emission at 515 nm, full width of 30 nm; HQ460-40, emission at 460 nm, full width of 40 nm; Chroma, Brattleboro, VT) or a short-pass filter (650 DCSPRX C72-38, Chroma), is fed to a multimode fiber connected to a photomultiplier (R928, Hamamatsu Photonics, Hamamatsu, Japan) with the output plugged into a PCM2000 electronic controller module. The radial and axial profiles are 240 ± 40 nm and 780 ± 50 nm, respectively. The excitation intensity on the sample is computed as the average power divided by the area of the point spread function in the focal plane.
The two infrared lasers were tuned at the excitation wavelengths of the major components of GFPmut2 fluorescence spectrum. The corresponding peak emission wavelengths were selected by proper filters on two acquisition channels of the PCM2000 scanning head. A mechanical chopper, synchronized with the acquisition software, allowed to collect images with excitation on the two excitation bands at ≅255-ms time intervals.
Fluorescence imaging
The images (512 × 512 pixels) of encapsulated protein molecules were acquired with a pixel dwell time of 3 μs per pixel, field of view ≅10 × 10 μm and excitation power on the sample of ≅1–15 MW/cm2. With these parameters, one single molecule spot corresponds to ∼11 × 11 pixels. The effective collection time of fluorescence per single protein molecule is therefore ≅360 μs. Molecules were not irradiated during the remaining image acquisition. Axial scanning ensured that the field under observation was unaltered during the long-lasting denaturation experiments. Fields with only 5–30 fluorescence spots that correspond to single GFPmut2 molecules (28,63) were selected. For good statistics ∼600 single molecules were examined.
Fluorescence spectra
Spectra were obtained from images sampled at different excitation wavelengths and through different emission filters at excitation intensity ≅4 MW/cm2. Both excitation and emission spectra were collected on spots containing ≅20 GFPmut2 molecules. The emission spectra were obtained by recording fluorescence intensity via a monochromator (Horiba, Jobin-Ivon (Longjumeau, France), 1.5-nm band pass), with an excitation wavelength of 800 nm. The excitation spectra were collected by varying the excitation wavelength (720–920 nm) through various emission filters (670-nm short pass; 460-, 515-, and 535-nm band-pass filters), while keeping constant the excitation power on the sample. The collection time per spot was ≅360 μs (11 × 11 pixels), much less than the bleaching time at this excitation power, ≅250 ms (65).
Fluorescence lifetime measurements
A PCI board for time-correlated single-photon counting (Time Harp 200, PicoQuant, Berlin, Germany) was employed to measure single-photon intensities detected by an Avalanche photodiode (EG&G, Quebec, Canada; model SPCM-AQR15). The duration of lifetime measurements was ≅7.5 s, less than the bleaching time ≅30 s at the excitation intensity ≅0.7 MW/cm2. The count for each single molecule lifetime measurement was typically 30,000 photons. The full half-height width of the intensity response function is ≅430 ps.
RESULTS
Two-photon excitation spectra of GFPmut2
The TPE spectrum of GFPmut2 encapsulated in silica gels, detected through a short-pass filter with cutoff at 670 nm, exhibits two main components at 820 ± 2 and 885 ± 3 nm (Fig. 1 a) and a shoulder at ≅760 nm. The relative amplitude of the 820- and 885-nm bands changes with pH as shown in Fig. 1 c, inset. The excitation at 885 nm is largely favored at high pH with respect to the band at 820 nm, suggesting that the 885-nm excitation band is due to the two-photon absorption of the anionic state of the GFPmut2 chromophore, whereas the excitation at 820 nm corresponds to the absorption of the neutral chromophore. The TPE emission, upon excitation at 820 nm, shows three bands at 456, 510, and 538 nm (Fig. 1 b, inset), in good agreement with the one-photon emission (OPE) spectra (28). The major component at 510 nm corresponds to the one-photon absorption at 485 nm (Fig. 1 a, inset) (28) and is ascribed to the anionic state of the chromophore. The emission at ≅460 nm is due to the neutral state of the chromophore (28). As in most of the GFP mutants the neutral state emission corresponds to higher energy gaps than those of the anionic one (66).
FIGURE 1.

GFPmut2 TPE fluorescence spectra in silica gel at pH ≅ 6.6 acquired at laser average intensity = 2 MW/cm2. (a) TPE spectrum acquired through a short-pass filter at 670 nm. (Inset) OPE absorption spectrum. (b and c) TPE spectra acquired through the band-pass filters HQ460/50 (b) and HQ515/50 (c). The inset of panel b shows the TPE emission spectrum upon excitation at 800 nm. The inset of panel c shows the TPE spectrum observed through the short pass 670-nm filter at pH = 5 (solid squares) and pH = 6.6 (open squares). In panels a, b, and c and the respective insets, the solid lines indicate the three Gaussian components obtained by nonlinear least-square fitting of the spectra and the complete best-fit spectrum. (d) Lifetime decays recorded (A) at 460 nm upon excitation at 820 nm, 50 nm full-band-pass width and (B) at 515 nm upon excitation at 885 nm, 50-nm full-band-pass width. For clarity, experimental points are plotted one every four. The solid lines are single exponential fits for delay times >0.6 ns. (inset, panel d) Fluorescence decay collected through the short-pass filter at 670 nm, upon excitation at 820 nm. The solid line is a double exponential decay fit to the data with lifetimes of 1 ± 0.2 ns and 2.8 ± 0.2 ns.
To support the assignment of the TPE components, we measured the fluorescence lifetime of single GFPmut2 molecules by exciting at 820 nm and recording the emission at 460 nm. We found a single component with a lifetime of 0.93 ± 0.05 ns (Fig. 1 d). This value is in agreement with the lifetime measured for the neutral state of other GFP mutants (67–69). Moreover, single-molecule fluorescence decays obtained by exciting at 885 nm and collecting the emission through the 515-nm band-pass filter show a monophasic exponential decay with a lifetime of 2.8 ± 0.1 ns (Fig. 1 d). This value is close to the excited state lifetime of the anionic form of GFP chromophore (≅3 ns) (67,68), strongly supporting the assignment of the TPE component excited at 885 nm and emitting at 510 nm to the anionic state of the chromophore. The presence of both bands at 820 and 885 nm in the TPE spectrum collected at λem ≅ 515 nm and λem ≅ 460 nm, indicates an efficient excited state transition between the anionic and the neutral state. This finding is confirmed by the observation that the fluorescence decay collected through the short-pass filter shows, for any excitation wavelength in the range 820–885 nm, a double exponential decay with lifetimes of ≅1 and 2.8 ns (Fig. 1 d, inset).
In unfolding and refolding experiments (see below) two main excitation channels, called A and B, were used. The channel A corresponds to excitation at 820 nm and observation at 460 nm through the HQ460-40 band-pass filter. The channel B is obtained by exciting at 885 nm and collecting light at 515 nm through the HQ515-30 band-pass filter. Following the analysis of the TPE spectra presented above, the channels A and B are assigned to the emission of the neutral and anionic forms of the GFPmut2 chromophore, respectively. The third weak component at λexc = 760 nm (Fig. 1 a) could be ascribed to the intermediate state I, closely related to the B state, as recently demonstrated (70). The quantum yields, the two-photon cross sections, and the conversion efficiencies between the neutral and anionic states can be determined from a detailed comparison of the absorption and emission OPE spectra and the excitation and emission TPE spectra and will be reported elsewhere.
GFPmut2 TPE photostability
TPE fluorescence images of silica gels doped with GFPmut2 at pH ≅ 6.6 show bright spots on a dark background (Fig. 2 a). The single molecule irradiation time ≅360 μs adopted here is not sufficient to induce conversion between the neutral and anionic states of the chromophore, at Iexc ≅ 2 MW/cm2. The fluorescence emission of some spots suddenly drops to the background level (Fig. 2 b) under strong illumination (Iexc > 10 MW/cm2) or for short image sampling times (i.e., the time interval between subsequent images in a time series) Δt ≅ 200 ms (Fig. 2 b). Under these conditions, blinking only occurs from the anionic channel (71). These spots are identified as single protein molecules in agreement with the analysis carried out previously (28,65). The loss of fluorescence occurs after an observation time TB. The corresponding bleaching rate, γB = 1/TB, increases with the excitation power for both protonation states, according to a 2.5 ± 0.15 power law (Fig. 2 c) and decreases rapidly (Fig. 2 d, inset) with the image sampling time. The decrease of γB versus the image sampling time Δt is well described by a power law  (Fig. 2 d). The best fit exponent is g = 0.26 ± 0.02. Upon addition of GdnHCl to the silica gels, we found the same behavior for γB, with no systematic change of the exponent g as a function of denaturant concentration in a range 0.45 M < [GdnHCl] < 5.5 M. At the excitation intensity of ≅2 MW/cm2 and sampling time Δt ≅ 900 s, the bleaching effect is largely diminished (TB ≅ 16 h). Therefore, the unfolding-refolding experiments that are described below, were carried out with Δt = 900 s and Iexc = 2 MW/cm2.
FIGURE 2.
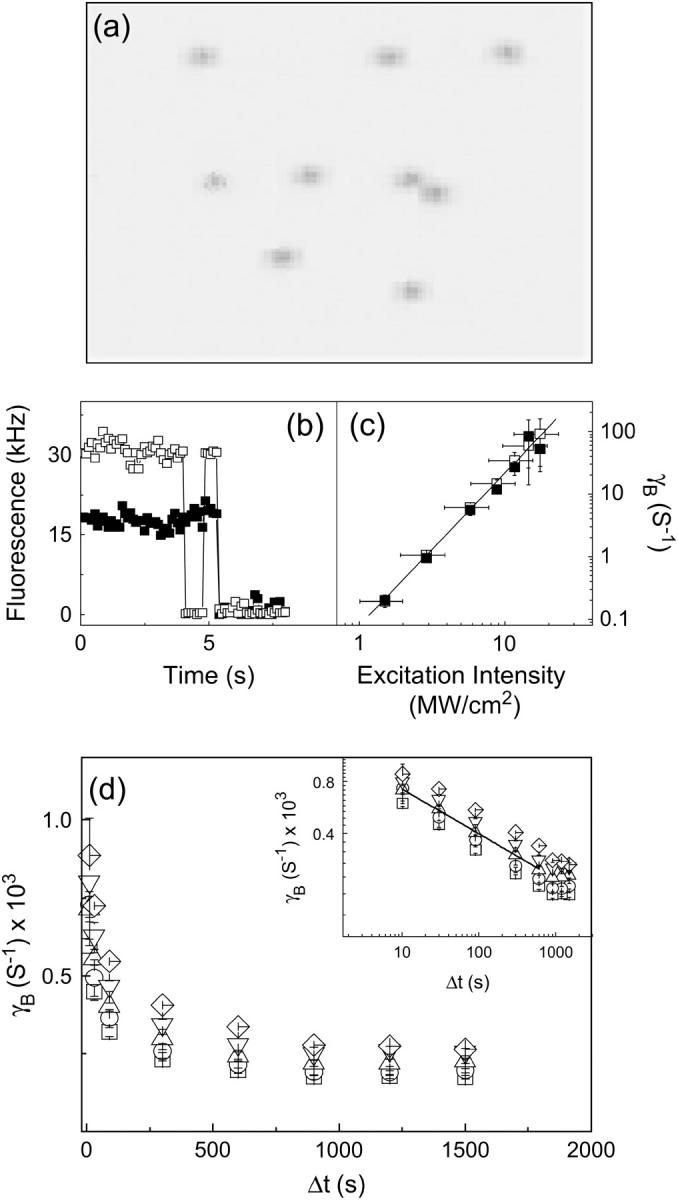
(a) A typical fluorescence image of silica gels doped with GFP-mut2. The field of view is 5 × 5 μm, excitation on the anionic channel, excitation intensity 2 MW/cm2, and pixel dwell time = 3 μs. Ten spots are visible: six of them are ascribed to single molecule emission according to the distribution of spot average fluorescence emission (28). (b) Typical single GFPmut2 molecule fluorescence changes at pH = 6.6. The fluorescence drops to zero with a stepwise behavior; solid and open squares refer to the neutral and the anionic state emission. Image sampling time = 108 ms, Iexc ≅ 2 MW/cm2. (c) Bleaching rate γB = 1/TB for [GdnHCl] = 0 M and image sampling time = 500 ms, plotted versus the excitation intensity estimated from the excitation power divided by the area of the point spread function on the focal plane. The solid line is a power law fit to the data,  , with g = 2.5 ± 0.05 and a = 0.07 ± 0.01 Hz (MW/cm2)−2.5. Symbols as in panel b. The error bars on the excitation intensity represent the uncertainty on the point spread function size. (d) Bleaching rate versus the image sampling time Δt for Iexc ≅ 1.5 MW/cm2 and increasing concentration of GdnHCl: 0.45 (□), 1.45 (○), 2.45 (▵), 3.45 (▿), and 4.45 M (⋄). Error bars are smaller than the symbols. The inset of panel d shows the same data in log-log scale together with the power law best-fit function for the data at [GdnHCl] = 2.45 M (see text).
Solvent exchange in GFPmut2-doped silica gels
Solvent exchange was achieved by adding a drop of the desired solution to the surface of the gel. Few seconds after the addition of the solution containing GdnHCl and 600 mM NaCl, we observed a ≅20% sudden decrease of single molecule fluorescence emission (Fig. 3 a). The same fluorescence decrease was also found when washing the GFPmut2-loaded gels with a solution containing 600 mM NaCl only (data not shown). This effect is due to the increase in ionic concentration that affects the chromophore fluorescence emission (72–74). A similar behavior was observed in experiments carried out in solution and in high protein load GFPmut2 gels (27). The time delay τd between the resuspension of the gels in GdnHCl/NaCl-containing solutions and the ≅20% fluorescence drop decreases with GdnHCl concentration when measured at a specific height z in the gel (Fig. 3 b), and increases with the height z, at a constant GdnHCl concentration (Fig. 3 c). τd is very close to that measured by observing the appearance of fluorescence after the resuspension of a protein-free gel in a fluorescein-containing solution (data not shown). These findings indicate that τd is likely time limited by the diffusion of solutes in the silica gel. Thus, the time delay τd ≤ 2 s cannot affect the time course of GFPmut2 unfolding that takes place in minutes or longer times (see below).
FIGURE 3.

(a) Fluorescence emission of randomly selected GFPmut2 molecules after the addition of a solution containing GdnHCl/NaCl. (a, top panel) [GdnHCl] = 0.45 M, [NaCl] = 600 mM. (a, middle panel) [GdnHCl] = 2.45 M, [NaCl] = 600 mM. (a, bottom panel) [GdnHCl] = 4.45 M, [NaCl] = 600 mM. All traces were collected on a plane at z ≅ 225 μm from the free gel surface (z = 0 μm is the free gel surface and z ≅ 400 μm is the gel surface in contact with the glass slide). (b) Dependence on GdnHCl concentration of the time delay τd measured on traces similar to those shown in panel a at z ≅ 50 μm. (c) Time delay τd versus the observation height z of the gel, at [GdnHCl] = 4.45 M, [NaCl] = 600 mM. The solid lines in panels b and c are polynomial fits drawn to guide the eye.
Unfolding of GFPmut2
The disappearance of the fluorescence of single GFPmut2 molecules upon addition of GdnHCl, was monitored by collecting TPE images at Iexc ≅ 2 MW/cm2 and Δt = 900 s as a function of time (Fig. 4 a). Fig. 4 b shows representative examples of unfolding time courses at 4.45 M GdnHCl taken on six different fields of view. The number of fluorescent molecules N(t) decreases from N0 = 23 in the absence of denaturant, to N∞ ≅ 0 at equilibrium. For GdnHCl concentration higher than 5 M, the disappearance of fluorescent molecules was too fast to be followed by an image sampling time of 900 s, needed to avoid photobleaching. Therefore, the denaturation experiments were carried out by adding the denaturant at a variable time 0 < tI < 900 s between the first image (where [GdnHCl] = 0) and the second image. In this way, the ratio of the number of molecules N(t = Δt − tI)/N0 and, consequently, the decay of N(t) for 0 < t < 900 s was determined. The time course of N(t), for all the concentrations of denaturant explored here, is well described by a single exponential decay:
 |
(1) |
FIGURE 4.
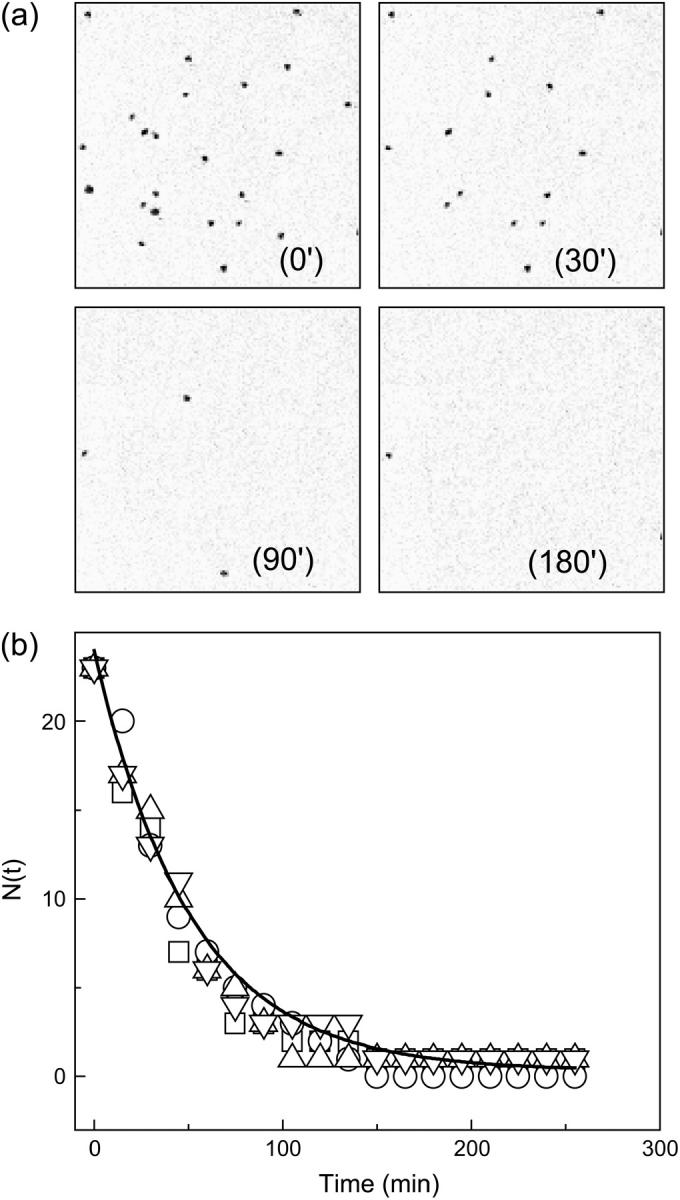
Time series of images taken during the unfolding of single GFPmut2 molecules. (Top) The images correspond to an area of 18 × 18 μm and 512 × 512 pixels and are taken with image sampling time of 900 s and Iexc ≅ 2 MW/cm2, at times = 0, 30, 90, and 180 min (panels labeled 0′, 30′, 90′, and 180′) after the addition of 4.5 M GdnHCl. Twenty-three GFPmut2 molecules were initially observed and only one molecule is still emitting fluorescence after 180 min. The bottom panel shows the decrease of the number of fluorescent protein molecules versus time counted on four different fields of view, at 4.45 M GdnHCl. The solid line is the best-fit single exponential function to all the decays.
The unfolding rate constant  increases as a function of denaturant concentration (Fig. 5), and closely matches that determined in bulk gel by CD and fluorescence emission (27). Unfolding experiments were also carried out monitoring simultaneously the A, B, and I states, obtaining very similar rate constants (data not shown).
FIGURE 5.

Denaturant dependence of the unfolding rate constant, γU, of single GFPmut2 molecules measured from the time decay of the number of fluorescent molecules (see Eq. 1) in silica gels (▪). For comparison the two unfolding rates measured by CD in bulk gels (▵; ○) (27) are reported. The open diamonds represent the relaxation rate obtained by simulating the bulk gel CD decay with an image sampling time of 15 min and by fitting it to a single exponential function, as described in the text. (Inset) Simulated decays for [GdnHCl] =3 (triangles), 4 (squares), and 5.5 M (circles). Solid lines are the single exponential fits of the data.
The fraction of denatured molecules at equilibrium, calculated as  , is reported as a function of GdnHCl concentration in Fig. 6. The dependence of FU, computed for each spectroscopic state, was fitted to a single sigmoidal function. The midpoint of the native-unfolded transition for the B and I states is very similar, 2.0 ± 0.1 M, whereas the midpoint for the state A is 2.3 ± 0.1 M (Fig. 6). The values at low [GdnHCl] for the I state are affected by a higher uncertainty due to the very low number of I state molecules, thus explaining an ordinate intercept of the curve different from zero.
FIGURE 6.

Fraction of unfolded molecules,  , at equilibrium after the addition of GdnHCl for the three different fluorescent states of GFPmut2. A state (▪), B state (□), and I state (▴). The solid lines are sigmoidal fits to the data with midpoint concentrations [GdnHCl]0.5 = 2.3 ± 0.1, 2.0 ± 0.1, and 2.0 ± 0.1 M for the A, B, and I state, respectively.
Finally, by monitoring the same field for long periods of time upon reaching equilibrium, single refolding/unfolding events are observed, leading to a fluctuation of N∞ (data not shown).
Refolding of single GFPmut2 molecules
Refolding of denatured GFPmut2 molecules was achieved by resuspending gels three times in a denaturant-free solution, without removing the sample from the microscope sample holder. This procedure takes ∼60 s. The images taken through the anionic channel 900 s after resuspension, showed a marked increase in the number of fluorescent molecules (compare Fig. 7, B and C). Moreover, those spots that are visible in image in Fig. 7 C and not in the image Fig.7 A, correspond to single molecules that were emitting on the neutral channel before unfolding (Fig.7 A). A set of representative examples of repeated unfolding and refolding cycles, carried out on the same set of single molecules at [GdnHCl] = 3.45, 4.0, and 5.5 M, is shown in Fig. 7. The results indicate a relatively fast refolding phase (rates higher that 10 min−1). However, full recovery of the number of fluorescent molecules was observed only by monitoring simultaneously both the neutral and the anionic fluorescent states. In fact, the ratio between molecules that recover fluorescence in the A and B channels can be very different from the preunfolding equilibrium distribution (Fig. 7). A quantitative analysis of such behavior is reported in the discussion session. At longer times, a slow redistribution between the anionic and neutral states of refolded GFPmut2 molecules, with a lifetime of ∼70 min, invariantly leads to the recovery of the initial, preunfolding NA/NB ratio (Fig. 7). The recovery for the I state is more difficult to assess due to its low brightness. None of the unfolded molecules refolded in the I state whereas molecules that were unfolded from the I state always recovered in the B state.
FIGURE 7.

Unfolding/refolding experiments. Images A, B, and C are taken through the anionic channel, Iexc ≅ 2 MW/cm2, image sampling time ≅15 min, field of view ≅18 × 18 μm, pixel dwell time = 3 μs. The images were taken before adding GdnHCl at [GdnHCl] = 4.0 M (image A), 225 min after the addition of the denaturant (image B), and 15 min after washing the gel with denaturant-free buffer (time = 235 min of the unfolding-refolding kinetics, image C). Those spots that are visible in image C and not in image A, correspond to single molecules that were emitting on the neutral channel before unfolding. The plots in the nine panels underneath show subsequent unfolding and refolding steps that were performed at [GdnHCl] = 5.5 (top row), 4.0 (middle row), and 3.45 M (bottom row). The number of fluorescent protein molecules counted on the A (▪) and B channel (□) is shown versus time.
DISCUSSION
Bulk versus single-molecule experiments
Changes in the secondary structure of GFPmut2 upon chemical denaturation, detected by CD spectroscopy in bulk solutions and gels, correlate to the change of the fluorescence signal (27). The close matching of the kinetic and thermodynamic unfolding parameters indicates that fluorescence allows one to monitor the overall unfolding of GFPmut2. The loss of fluorescence upon unfolding can be due to a reduction of the cross section, because of chromophore protonation upon exposure to the solvent, or to a reduction of the quantum yield because of a diminished rigidity of the chromophore (66). We monitored the unfolding and refolding of single GFPmut2 molecules by TPE fluorescence microscopy, exploiting two separate excitation and emission channels to selectively probe protein molecules with a protonated (neutral state, A channel) or deprotonated chromophore (anionic state, B channel). Control experiments were carried out to support the assignment of the two-photon excitation and emission bands to the two chromophore protonation states, including measuring the pH dependence of the relative population of the two states (Fig. 1 c, inset) (74) and the excited state lifetimes (Fig. 1 d) (71).
The unfolding rate of GFPmut2 was determined by measuring the rate γU at which the number of fluorescent molecules decreases after the addition of GdnHCl to the gel (Eq. 1), under conditions that minimize photobleaching (Fig. 2 c). The measured dependence of the unfolding rate on the denaturant concentration (Fig. 5) is in reasonable agreement with that previously reported for high protein load silica gels and determined by CD spectroscopy (27). In these gels two kinetic components are detected (open triangles and open circles in Fig. 5). However, to quantitatively compare single molecule to high protein load gels measurements, we took into account that the faster relaxation time found in bulk is <15 min for denaturant concentrations >4 M (27). Therefore, we have simulated the unfolding CD decay with the image sampling time = 15 min used for the single molecule measurements. The unfolding rate obtained by fitting the simulated decay to a single exponential function is in very good agreement with the single-molecule fluorescence unfolding data (Fig. 5, open diamonds and inset).
Separate unfolding equilibrium curves were determined for GFPmut2 molecules in the A, B, and I state (Fig. 6). Both the denaturation midpoints for the B and I state are close to the value of 2.1 ± 0.1 M determined by CD in bulk gels for the anionic state of GFPmut2 (27). The denaturation midpoint measured for the neutral A state upon addition of GdnHCl is 2.3 ± 0.1 M, a value higher than those measured for the B and I states, that are related to deprotonated states of the chromophore. The observation of a different thermodynamic stability hints to conformational differences between molecules carrying the chromophore in different protonation states. Recent studies, aimed to characterize the dynamics of the acid-induced structural changes of GFPmut2 (75), indicated that upon a nanosecond laser-induced acidic pH jump, proton binding to GFP chromophore is associated to a very fast process followed by a slower structural rearrangement.
Trapping GFPmut2 molecules in silica gels allows one to monitor the denaturation of single proteins, and to better visualize the presence of different protein conformations. In fact, as discussed in detail elsewhere (27), the unfolding induced by GdnHCl in solution is well described by a thermodynamic and kinetic two-state process. In the gel, biphasic unfolding kinetics reveal that at least two alternative conformations of the native protein are significantly populated.
Repeated unfolding-refolding cycles on single-protein molecules
The kinetic parameters reported above could clearly be obtained also on bulk solutions or on high protein concentration silica gels. The close matching of the results reported here with those reported on large protein ensembles (27) has the only purpose to validate the single molecule experiments. Results that cannot be matched by bulk experiments can be obtained by performing repetitive unfolding-refolding cycles on the same sets of single protein molecules. By mapping the heterogeneity of unfolding and refolding pathways we can obtain new valuable insights in the unfolding process of GFPmut2. Upon denaturation and rinsing the gel with the denaturant-free buffer, the number of fluorescent molecules increases in the first 900 s (see Fig. 7 C and bottom panels). The complete recovery of the preunfolding number of fluorescent molecules and chromophore protonation equilibrium occurs on two time regimes. Within 900 s from rinsing the gel with denaturant-free buffer most of the denatured molecules recover fluorescence emission although with a different distribution between anionic and protonated states with respect to the preunfolding equilibrium. On this timescale, the refolding process is not complete when observed monitoring a single spectroscopic component. As a matter of fact, single molecules detected on the anionic channel in Fig. 7 C are not all found in the preunfolding image (Fig. 7 A). The fluorescent spots observed in Fig. 7 C and not present in Fig. 7 A, are single protein molecules that were emitting in the neutral channel before the unfolding process took place. The incomplete recovery on each spectroscopic channel is in apparent disagreement with the good description of the equilibrium unfolding curve by a single sigmoidal function (Fig. 6) that supports a two-step unfolding. However, by counting the number of fluorescent molecules on both states (neutral + anionic) we always find a complete recovery (Fig. 7, bottom panels). A slower process was observed within 60–80 min from rinsing the gel with buffer (Fig. 7). In this time interval the number of molecules on each channel changes, eventually reaching the equilibrium values measured in the absence of GdnHCl. This process seems to be independent of the denaturant concentration that was employed to induce unfolding, within the statistics of the data presented here, i.e., 40 unfolding-refolding cycles at 3.5 M < [GdnHCl] < 5.5 M. Fig. 7 shows that the unfolding/refolding cycle can be repeated several times on the same molecule, with no single protein molecule permanently moving to a dark state. We could continuously cycle molecules between the folded and unfolded states for ≅10 h.
Refolding statistics
In native conditions, at pH = 6.6, the number of molecules found in the neutral state is less than those found in the anionic state, NB/NA = 2 ± 0.05. This value is consistent with the measured pKa = 6.23 ± 0.06 for the GFPmut2 chromophore (28), from which we predict  Upon refolding we find a variety of behaviors that span from a complete recovery on the neutral (A) state, to a complete recovery on the anionic (B) state. Apparently no simple relation could be found between the ratios of molecules in the two states, NB/NA, measured before the addition of the denaturant and 900 s after each of the refolding cycles. The erratic behavior of the ratio of the number of anionic to the neutral molecules, observed upon refolding, could be ascribed to a different acidic equilibrium in the unfolded protein that leads to a variation in the chromophore pKa. Beyond obvious changes in the chromophore microenvironment upon unfolding, changes in the pKa value might be influenced by interactions between single protein molecules and the guanidinium ion, for which both direct binding and indirect solvation effects have been invoked (76).
To quantitatively test the above hypothesis, we have computed the ratio of the number of molecules found in the anionic and in the neutral state after each refolding step (i.e., 900 s after rinsing GdnHCl from the silica gel),  and compared it to the equilibrium ratio
  The ratio
  is computed over ∼40 refolding events. The distribution of
  is centered at ≅1 ± 0.1, which is almost half (see Fig. 8) the equilibrium value of this ratio,
  The difference between the centers of distributions of
  and
and  would imply a shifted pKa value ≅6.6, sensibly higher than that determined on native GFPmut2. The much larger distribution of the
  with respect to the
  ratio suggests some heterogeneity in the apparent pKa for molecules populating the denatured state ensemble, which is likely to be conformationally heterogeneous.
FIGURE 8.

Distribution of the ratio of the number of molecules in the anionic state to those in the neutral form at equilibrium,  (solid bars), and 900 s after removing GdnHCl from the silica gel,
  (cross-hatched bars).
“Memory” effects upon refolding
Any single protein molecule could be followed through its unfolding-refolding history for several unfolding-refolding cycles such as those reported in Fig. 7. The question is whether the probability of a denatured molecule to refold in the neutral or the anionic state is independent of the protonation state of the native protein, or “memory” effects are present. To answer this question we have followed for three consecutive unfolding-refolding cycles (such as the first three steps reported in each panel of Fig. 7) a total of ≅200 single protein molecules at [GdnHCl] = 3, 3.45, 4, 5, and 5.5 M. To analyze the refolding-unfolding history of each GFPmut2 molecule, we have assigned at each refolding event the value S = 1 when the protein was found in the same protonation state as in native conditions and S = 0 otherwise. In Fig. 9 the trend of S is shown as an example for a set of 16 single molecules originally in the anionic state, each followed for three unfolding-refolding cycles at [GdnHCl] = 3, 4, and 5 M. Each block of three points (separated by a vertical dashed line) in Fig. 9, a–d, corresponds to a different single protein molecule followed for three unfolding-refolding cycles. Data are shown as a unique experiment to enhance any random behavior of the variable S. The average of the state variable S over the entire unfolding-refolding history gives the average occupancy of the original protonation state (Fig. 9 e, open and solid squares). We find an approximately equal population of the two protonation states with a slight tendency of the protein to stay in the original protonation state since 〈S〉 ≅ 0.7 for both states. The only exception is found for [GdnHCl] = 5.5 M where we found a marked tendency, S ≅ 0.8–0.9, of the molecules to stay in the original protonation state. The trend of S versus the number of refolding cycles (i.e., time in Fig. 9, a–d) contains also kinetic information that can be obtained by computing the on- and off-times of the process; ton and toff are defined as the intervals (in units of unfolding cycles) for which the value of S is 1 and 0, respectively. Because the on- and off-times are referred to the number of unfolding cycles, they are unitless. Due to the fact that we followed three unfolding/refolding cycles for each protein, ton ≤ 3 and toff ≤ 2. As seen in Table 1, we found that ton ≅ 1.7 is systematically larger than toff ≅ 1.3, as expected because the proteins tend to stay in the original protonation state. The probability of a single protein molecule to stay in the original protonation state can in fact be estimated from the values of ton and toff as the ratio ton/(ton + toff). This value, reported in Fig. 9 e (open and solid triangles), is in good agreement with the direct computation of 〈S〉 on the S traces reported in Fig. 9, a–c. This fact and the observation that there is a systematic increase of ton and decrease of toff versus [GdnHCl], are consistent with the increase of 〈S〉 observed at high [GdnHCl] in Fig. 9 e, confirming that molecules tend to stay in the original protonation state.
FIGURE 9.

Results of the statistical analysis of the unfolding-refolding cycles. For each refolding experiment a value S = 1 is assigned when the protein is found in the same protonation state as in native conditions and S = 0 otherwise. Panels a, b, and c report the order parameter S for a set of 16 single protein molecules, at [GdnHCl] = 3, 4, and 5 M (from top to bottom) when only 1 min is left between each refolding step and the subsequent unfolding experiment. Panel d reports S for an experiment at [GdnHCl] = 5.5 M when a time delay τRU ≅ 20 min has been left between each refolding step and the subsequent unfolding experiment. Each block of three points (delimited by a vertical dotted line) on each of these panels corresponds to a set of three unfolding-refolding cycles observed on a single protein molecule in the anionic observation channel. Panel e reports the average values of S for the anionic (□) and the neutral (▪) state versus the denaturant concentration. Open and solid triangles refer to the estimate of 〈S〉 ≅ ton/(ton + toff) (solid triangles are almost coincident with the open triangles). The dashed line indicates the value 0.5. Panels f and g report 〈S〉 measured at [GdnHCl] = 5.5 M for the neutral (▪) and the anionic (□) state versus the delay times τRU (time between the beginning of the refolding process and the subsequent unfolding) and τUR (time between the completion of the unfolding process and the subsequent refolding). The dashed lines indicate the value 〈S〉 = 0.5.
TABLE 1.
Statistical properties of the unfolding-refolding cycles measured on single protein molecules
|
ton
|
toff
|
ton
|
toff
|
〈S〉
|
||
|---|---|---|---|---|---|---|
| [GdnHCl] (M) | Anionic | Neutral | Anionic | Neutral | ||
| 3.0 | 1.7 | 1.6 | 1.7 | 1.5 | 0.7 (0.1) | 0.62 (0.05) |
| 3.5 | 1.7 | 1.5 | 1.7 | 1.5 | 0.8 (0.2) | 0.7 (0.2) |
| 4.0 | 1.7 | 1.4 | 1.7 | 1.4 | 0.6 (0.15) | 0.75 (0.05) |
| 5.0 | 1.9 | 1.3 | 1.8 | 1.3 | 0.66 (0.09) | 0.56 (0.07) |
| 5.5 | 1.9 | 1.4 | 1.9 | 1.4 | 0.92 (0.05) | 0.86 (0.08) |
〈S〉 is the average value of the state parameter S defined in the text (the number in parentheses is the value of the variance of S). The times ton and toff are computed on plots similar to that reported in Fig. 9 on blocks of three unfolding-refolding cycles. The ton and toff are unitless because they refer to the unfolding cycles. Their variance is ≅0.2.
The reduced value of  compared to the equilibrium ratio
  is compatible with the finding that
  Actually a slightly larger value of 〈S〉 for the anionic state than for the neutral state could be expected according to the following reasoning. Let us assume two different values SA and SB for the two states. The number of molecules in the two states,
  and
and  after each unfolding-refolding cycle is given by:
 |
(2) |
If we assume the experimental values NB/NA ≅ 2 and NB/NA ≅ 2 we obtain the relation:
 |
(3) |
If, for example, we assume SB = 0.7, we obtain a very similar value, SA = 0.6 from Eq. 3. This prediction is in agreement with the experimental observations and the relative uncertainties reported in Fig. 9 for 〈S〉 on the two states. Actually, 〈S〉 is larger for [GdnHCl] = 5.5 M indicating that molecules tend to stay in the same protonation state assumed before unfolding. This is in agreement with the observation that the refolding events observed at high [GdnHCl] correspond to NB/NA ratios close to the equilibrium value ≅2. It must be noted that the slight tendency of single GFPmut2 molecules to stay in the original protonation state should be related to the existence of metastable states. We expect, therefore, that the values of 〈S〉 may depend on the time delay between the refolding and the subsequent unfolding experiment, τRU, and on the time occurred between the completion of unfolding and the subsequent refolding, τUR. Actually, the largest deviation of 〈S〉 from the equilibrium value 〈S〉 ≅ 0.5, found at [GdnHCl] = 5.5 M, vanishes by increasing the time delay τRU, as shown by Fig. 9, d and f. On the other hand, the value of 〈S〉 computed from the data reported in Fig. 7 is found to increase with τUR from a value 〈S〉 ≅ 0.5 up to 〈S〉 ≅ 0.9, as reported in Fig. 9 g.
The origin of the observed “memory” effect remains unclear. One possibility is that, due to constraints posed by gel pore caging to the conformational entropy of unfolded chains, anionic, and zwitterionic GFPmut2 molecules populate, upon unfolding, totally or partially distinct conformational ensembles. In this case, refolding could occur preferentially along a pathway leading to the original protonation state. The nonmeasurable fluorescence signal from the chromophore of denatured GFPmut2, and the extensive loss of secondary structure upon unfolding in the gel observed by CD spectroscopy (27), severely limit the possibility to experimentally test the above hypothesis. Alternatively, memory could arise from the fact that, during the gelification process, protein molecules act as a template for the gel matrix polymerization. In the mature gel, size and shape of the pores might be slightly different according to the conformation of the encapsulated molecules. This could bias GFPmut2 molecules toward refolding in a specific protonation state, endowed with a distinct conformation, as suggested by the distinct equilibrium unfolding curves of anionic and neutral species (Fig. 6). The fact that the overall rotational diffusion of the protein is largely unaffected by the gel encapsulation (28), indicates that no specific or unspecific interactions are at work between the protein surface and polar or charged groups of the gel matrix. However, the altered apparent viscosity with respect to diluted solutions, and constraints to the conformational entropy, can bias the equilibrium between preexisting conformations of the protein, as previously observed for GFPmut2 itself (27), lipases (48), and several pyridoxal 5′-phosphate-dependent enzymes (57,58) The dependence of the memory parameter 〈S〉 on the delay times between the refolding and the subsequent unfolding process (Fig. 9 f), confirms that some form of constraint on the protein conformation is acted by the gel pore, and refolding is kinetically biased toward the conformation that better fits the original cage. This bias is gradually lost (Fig. 9 f) once refolded molecules are allowed to redistribute, according to the equilibrium dictated by the pKa, between the anionic and neutral state. In this case, there is a significant probability that unfolding is triggered when the pore is occupied by a molecule transiently exhibiting the “unfavored” conformation, which will likely refold in the alternative state, thus leading to a reduction of the memory effect. The dependence of 〈S〉 on the residence time in the denatured state (Fig. 9 g), instead, could be explained by a relatively slow relaxation of the denatured states toward ensembles of conformations that are different depending on the shape of the hosting pore.
Graphical model of the unfolding-refolding cycles
The observations reported above could be cast in a simplified picture of the energy landscape for GFPmut2, such as that reported in Fig. 10. The chromophore of the folded protein is predominantly in the anionic form at pH = 6.6. The low probability for thermally induced anionic-neutral conversions indicates a large energy barrier between the two protonation states (Fig. 10 F, black dashed arrow). In the presence of denaturant the energy of the unfolded states lowers below that of the folded states (neutral and anionic) in such a way that the GFPmut2 molecules in the anionic state spread both on the anionic and the neutral unfolded states (see red solid arrows in Fig. 10 U). The observation that  at early times upon refolding suggests that, in the unfolded state, the equilibrium between the anionic and the neutral forms is shifted toward the neutral state (see black dashed arrow in Fig. 10 U). Upon refolding, a fast (<900 s) transition brings to a native-like intermediate state (Fig. 10 F*) in which the unfolded proteins may convert both to the anionic and the neutral folded states (Fig. 10 F*, red solid arrows). At this stage the population of the neutral and anionic folded state is out of equilibrium due to the perturbed pKa of the unfolded state. A slow relaxation is then found toward the equilibrium state at which
  (see black dashed arrow in Fig. 10 F*). This relaxation is likely to involve more than a simple protonation equilibrium. It has been reported that in the transition from the neutral to the charged species, the Tyr-66 phenolic proton is shuttled through an extensive hydrogen-bonding network to the carboxylate oxygen of Glu-222. These changes occur indeed in two steps. The first is solely a protonation change, whereas the second step is a conformational rearrangement with most changes occurring at Thr-203 (77,78). This results, together with the report of Abbruzzetti et al. (75) evoking structural rearrangement of the amino acids surrounding the chromophore upon rapid acidification of the solvent, and with our observation that neutral and anionic forms of GFPmut2 are endowed with a different thermodynamic stability, support the hypothesis that the slow transition from the intermediate to the folded state implies a conformational change. In this sense, the energy diagram reported in Fig. 10 must be considered as a simplified scheme of a more complex landscape in which more than four conformational substates should be drawn. The U → F* transition should involve most of the large-scale conformational changes actually related to refolding, whereas the F* → F transition consists of a protonation equilibrium rate limited by possibly minor conformational changes.
FIGURE 10.

Proposed simplified representation of the unfolding-refolding transitions for GFPmut2 on the energy landscape. The three panels refer to folded (F), unfolded (U), and metastable (F*) states. Solid arrows indicate the directions of the most probable transitions whereas the black dashed arrows indicate the transitions that occur through an energy barrier. The red solid circles represent the most populated state in each panel.
CONCLUSIONS
We have followed at single molecule resolution the unfolding and refolding of GFP-mut2 trapped in wet nanoporous silica gels. By monitoring the protein fluorescence at two well distinct excitation and emission wavelengths, we can select either the neutral or the anionic state of the chromophore, with no appreciable bleaching or photoinduced protonation for ≅10–20 h. The rate of decrease of the number of fluorescent molecules upon addition of GdnHCl allows us to measure the unfolding rate, which is in good agreement with the results of bulk experiments carried out by monitoring CD in solution and in high protein concentration silica gels (27). The main results of this study, which could not be achieved by bulk measurements, are: 1), the same single protein molecule can be followed in several unfolding-refolding cycles; and 2), the refolding of single protein molecules does not occur always in the same protonation state, but an apparently erratic distribution on the two protonation states is found after the first refolding step. A statistical analysis shows: 3), the refolded proteins have a systematic alkaline shift of the pKa that might be reminiscent of an increased pKa of the chromophore in the unfolded state of the protein; and 4), protein molecules tend to stay on the same protonation state assumed before unfolding. Overall, this report emphasizes the power of silica gel encapsulation for single molecule measurements.
Acknowledgments
The research reported in this work has been funded by a PRIN grant of the Ministry of Research and Education of Italy to G.C. and A.D. for the years 2004–2005. We also gratefully acknowledge the financial support of FIRB Nanotechnology 2003 from the Italian National Institute for the Physics of Matter (to G.C. and A.M.) and of FISR 1999 (to G.C.).
Abbreviations used: GFP, green fluorescent protein; CD, circular dichroism; FRET, Förster resonance energy transfer; TPE, two-photon excitation; OPE, one-photon excitation.
References
- 1.Anfinsen, C. B., E. Haber, M. Sela, and F. H. White, Jr. 1961. The kinetics of formation of native ribonuclease during oxidation of the reduced polypeptide chain. Proc. Natl. Acad. Sci. USA. 47:1309–1314. [DOI] [PMC free article] [PubMed] [Google Scholar]
- 2.Dill, K. A., and H. S. Chan. 1997. From Levinthal to pathways to funnels. Nat. Struct. Biol. 4:10–19. [DOI] [PubMed] [Google Scholar]
- 3.Onuchic, J. N., Z. Luthey-Schulten, and P. G. Wolynes. 1997. Theory of protein folding: the energy landscape perspective. Annu. Rev. Phys. Chem. 48:545–600. [DOI] [PubMed] [Google Scholar]
- 4.Eaton, W. A., V. Munoz, S. J. Hagen, G. S. Jas, L. J. Lapidus, E. R. Henry, and J. Hofrichter. 2000. Fast kinetics and mechanisms in protein folding. Annu. Rev. Biophys. Biomol. Struct. 29:327–359. [DOI] [PMC free article] [PubMed] [Google Scholar]
- 5.Myers, J. K., and T. G. Oas. 2002. Mechanism of fast protein folding. Annu. Rev. Biochem. 71:783–815. [DOI] [PubMed] [Google Scholar]
- 6.Bonneau, R., and D. Baker. 2001. Ab initio protein structure prediction: progress and prospects. Annu. Rev. Biophys. Biomol. Struct. 30:173–189. [DOI] [PubMed] [Google Scholar]
- 7.Lindorff-Larsen, K., P. Rogen, E. Paci, M. Vendruscolo, and C. M. Dobson. 2005. Protein folding and the organization of the protein topology universe. Trends Biochem. Sci. 30:13–19. [DOI] [PubMed] [Google Scholar]
- 8.Kubelka, J., J. Hofrichter, and W. A. Eaton. 2004. The protein folding ‘speed limit’. Curr. Opin. Struct. Biol. 14:76–88. [DOI] [PubMed] [Google Scholar]
- 9.Kuhlman, B., and D. Baker. 2004. Exploring folding free energy landscapes using computational protein design. Curr. Opin. Struct. Biol. 14:89–95. [DOI] [PubMed] [Google Scholar]
- 10.Onuchic, J. N., and P. G. Wolynes. 2004. Theory of protein folding. Curr. Opin. Struct. Biol. 14:70–75. [DOI] [PubMed] [Google Scholar]
- 11.Leite, V. B., J. N. Onuchic, G. Stell, and J. Wang. 2004. Probing the kinetics of single molecule protein folding. Biophys. J. 87:3633–3641. [DOI] [PMC free article] [PubMed] [Google Scholar]
- 12.Jia, Y., D. S. Talaga, W. L. Lau, H. S. M. Lu, W. F. DeGrado, and R. M. Hochstrasser. 1999. Folding dynamics of single GCN4 peptides by fluorescence resonant energy transfer confocal microscopy. Chem. Phys. 247:69–83. [Google Scholar]
- 13.Weiss, S. 2000. Measuring conformational dynamics of biomolecules by single molecule fluorescence spectroscopy. Nat. Struct. Biol. 7:724–729. [DOI] [PubMed] [Google Scholar]
- 14.Mayor, U., N. R. Guydosh, C. M. Johnson, J. G. Grossmann, S. Sato, G. S. Jas, S. M. Freund, D. O. Alonso, V. Daggett, and A. R. Fersht. 2003. The complete folding pathway of a protein from nanoseconds to microseconds. Nature. 421:863–867. [DOI] [PubMed] [Google Scholar]
- 15.Lipman, E. A., B. Schuler, O. Bakajin, and W. A. Eaton. 2003. Single-molecule measurement of protein folding kinetics. Science. 301:1233–1235. [DOI] [PubMed] [Google Scholar]
- 16.Michalet, X., A. N. Kapanidis, T. Laurence, F. Pinaud, S. Doose, M. Pflughoefft, and S. Weiss. 2003. The power and prospects of fluorescence microscopies and spectroscopies. Annu. Rev. Biophys. Biomol. Struct. 32:161–182. [DOI] [PubMed] [Google Scholar]
- 17.Deniz, A. A., T. A. Laurence, G. S. Beligere, M. Dahan, A. B. Martin, D. S. Chemla, P. E. Dawson, P. G. Schultz, and S. Weiss. 2000. Single-molecule protein folding: diffusion fluorescence resonance energy transfer studies of the denaturation of chymotrypsin inhibitor 2. Proc. Natl. Acad. Sci. USA. 97:5179–5184. [DOI] [PMC free article] [PubMed] [Google Scholar]
- 18.Schuler, B., E. A. Lipman, and W. A. Eaton. 2002. Probing the free-energy surface for protein folding with single-molecule fluorescence spectroscopy. Nature. 419:743–747. [DOI] [PubMed] [Google Scholar]
- 19.Talaga, D. S., W. L. Lau, H. Roder, J. Tang, Y. Jia, W. F. DeGrado, and R. M. Hochstrasser. 2000. Dynamics and folding of single two-stranded coiled-coil peptides studied by fluorescent energy transfer confocal microscopy. Proc. Natl. Acad. Sci. USA. 97:13021–13026. [DOI] [PMC free article] [PubMed] [Google Scholar]
- 20.Rhoades, E., E. Gussakovsky, and G. Haran. 2003. Watching proteins fold one molecule at a time. Proc. Natl. Acad. Sci. USA. 100:3197–3202. [DOI] [PMC free article] [PubMed] [Google Scholar]
- 21.Rhoades, E., M. Cohen, B. Schuler, and G. Haran. 2004. Two-state folding observed in individual protein molecules. J. Am. Chem. Soc. 126:14686–14687. [DOI] [PubMed] [Google Scholar]
- 22.Cormack, B. P., R. H. Valdivia, and S. Falkow. 1996. FACS-optimized mutants of the green fluorescent protein (GFP). Gene. 173:33–38. [DOI] [PubMed] [Google Scholar]
- 23.Cubitt, A. B., R. Heim, S. R. Adams, A. E. Boyd, L. A. Gross, and R. Y. Tsien. 1995. Understanding, improving and using green fluorescent proteins. Trends Biochem. Sci. 20:448–455. [DOI] [PubMed] [Google Scholar]
- 24.Bokman, S. H., and W. W. Ward. 1981. Renaturation of Aequorea green-fluorescent protein. Biochem. Biophys. Res. Commun. 101:1372–1380. [DOI] [PubMed] [Google Scholar]
- 25.Ward, W. W., C. W. Cody, R. C. Hart, and M. J. Cormier. 1980. Spectrophotometric identity of the energy transfer chromophores in Renilla and Aequorea green-fluorescent proteins. Photochem. Photobiol. 31:611–615. [Google Scholar]
- 26.Ward, W. W., and S. H. Bokman. 1982. Reversible denaturation of Aequorea green-fluorescent protein: physical separation and characterization of the renatured protein. Biochemistry. 21:4535–4540. [DOI] [PubMed] [Google Scholar]
- 27.Campanini, B., S. Bologna, F. Cannone, G. Chirico, A. Mozzarelli, and S. Bettati. 2005. Unfolding of green fluorescent protein mut2 in wet nanoporous silica gels. Protein Sci. 14:1125–1133. [DOI] [PMC free article] [PubMed] [Google Scholar]
- 28.Chirico, G., F. Cannone, S. Beretta, A. Diaspro, B. Campanini, S. Bettati, R. Ruotolo, and A. Mozzarelli. 2002. Dynamics of green fluorescent protein mutant2 in solution, on spin-coated glasses, and encapsulated in wet silica gels. Protein Sci. 11:1152–1161. [DOI] [PMC free article] [PubMed] [Google Scholar]
- 29.Ellerby, L. M., C. R. Nishida, F. Nishida, S. A. Yamanaka, B. Dunn, J. S. Valentine, and J. I. Zink. 1992. Encapsulation of proteins in transparent porous silicate glasses prepared by the sol-gel method. Science. 255:1113–1115. [DOI] [PubMed] [Google Scholar]
- 30.Avnir, D., S. Braun, O. Lev, and M. Ottolenghi. 1994. Enzymes and other proteins entrapped in sol-gel materials. Chem. Mater. 6:1605–1614. [Google Scholar]
- 31.Dave, B. C., B. Dunn, J. S. Valentine, and J. I. Zink. 1996. Nanoconfined proteins and enzymes: sol-gel based biomolecular materials. In Nanotechnology. G. M. Chow and K. E. Gonsalves, editors. Oxford University Press, Oxford. 351–365.
- 32.Gill, I., and A. Ballesteros. 2003. Immunoglobulin-polydiacetylene sol-gel nanocomposites as solid-state chromatic biosensors. Angew. Chem. Int. Ed. Engl. 42:3264–3267. [DOI] [PubMed] [Google Scholar]
- 33.Gill, I. 2001. Bio-doped nanocomposite polymers: sol-gel bioencapsulates. Chem. Mater. 13:3404–3421. [Google Scholar]
- 34.Mozzarelli, A., and S. Bettati. 2001. Functional properties of immobilized proteins. In Advanced Functional Molecules and Polymers. H. S. Nalwa, editor. Gordon and Breach Science Publishers, Singapore. 55–97.
- 35.Livage, J., T. Coradin, and C. Roux. 2001. Encapsulation of biomolecules in silica gels. J. Phys.-Condens. Matter. 13:R673–R691. [Google Scholar]
- 36.Jin, W., and J. D. Brennan. 2002. Properties and applications of proteins encapsulated within sol-gel derived materials. Anal. Chim. Acta. 461:1–36. [Google Scholar]
- 37.Bettati, S., B. Pioselli, B. Campanini, C. Viappiani, and A. Mozzarelli. 2004. Protein-doped nanoporous silica gels. In Encyclopedia of Nanoscience and Nanotechnology. H. S. Nalwa, editor. American Scientific Publishers, Stevenson Ranch, CA. 1–23.
- 38.Das, T. K., I. Khan, D. L. Rousseau, and J. M. Friedman. 1998. Preservation of the native structure in myoglobin at low pH by sol-gel encapsulation. J. Am. Chem. Soc. 120:10268–10269. [Google Scholar]
- 39.Flora, K., and J. D. Brennan. 1999. Comparison of formats for the development of fiber-optic biosensors utilizing sol-gel derived materials entrapping fluorescently-labelled protein. Analyst. 124:1455–1462. [DOI] [PubMed] [Google Scholar]
- 40.Lan, E. H., B. C. Dave, J. M. Fukuto, B. Dunn, J. I. Zink, and J. S. Valentine. 1999. Synthesis of sol-gel encapsulated heme proteins with chemical sensing properties. J. Mater. Chem. 9:45–53. [Google Scholar]
- 41.Samuni, U., M. S. Navati, L. J. Juszczak, D. Dantsker, M. Yang, and J. M. Friedman. 2000. Unfolding and refolding of sol-gel encapsulated carbonmonoxymyoglobin: an orchestrated spectroscopic study of intermediates and kinetics? J. Phys. Chem. B. 104:10802–10813. [Google Scholar]
- 42.Eggers, D. K., and J. S. Valentine. 2001. Crowding and hydration effects on protein conformation: a study with sol-gel encapsulated proteins. J. Mol. Biol. 314:911–922. [DOI] [PubMed] [Google Scholar]
- 43.Eggers, D. K., and J. S. Valentine. 2001. Molecular confinement influences protein structure and enhances thermal protein stability. Protein Sci. 10:250–261. [DOI] [PMC free article] [PubMed] [Google Scholar]
- 44.Brennan, J. D., D. Benjamin, E. DiBattista, and M. D. Gulcev. 2003. Using sugar and amino acid additives to stabilize enzymes within sol-gel derived silica. Chem. Mater. 15:737–745. [Google Scholar]
- 45.Shibayama, N., and S. Saigo. 1995. Fixation of the quaternary structures of human adult haemoglobin by encapsulation in transparent porous silica gels. J. Mol. Biol. 251:203–209. [DOI] [PubMed] [Google Scholar]
- 46.Shibayama, N., and S. Saigo. 2001. Direct observation of two distinct affinity conformations in the T state human deoxyhemoglobin. FEBS Lett. 492:50–53. [DOI] [PubMed] [Google Scholar]
- 47.Shibayama, N., and S. Saigo. 1999. Kinetics of the allosteric transition in hemoglobin within silicate sol-gel. J. Am. Chem. Soc. 121:444–445. [Google Scholar]
- 48.Reetz, M. T. 1997. Entrapment of biocatalysts in hydrophobic sol-gel materials for use in organic chemistry. Adv. Mater. 9:943–954. [Google Scholar]
- 49.Bettati, S., and A. Mozzarelli. 1997. T state hemoglobin binds oxygen noncooperatively with allosteric effects of protons, inositol hexaphosphate, and chloride. J. Biol. Chem. 272:32050–32055. [DOI] [PubMed] [Google Scholar]
- 50.Das, T. K., I. Khan, D. L. Rousseau, and J. M. Friedman. 1999. Temperature dependent quaternary state relaxation in sol-gel encapsulated hemoglobin. Biospectroscopy. 5:S64–S70. [DOI] [PubMed] [Google Scholar]
- 51.McIninch, J. K., and E. R. Kantrowitz. 2001. Use of silicate sol-gels to trap the R and T quaternary conformational states of pig kidney fructose-1,6-bisphosphatase. Biochim. Biophys. Acta. 1547:320–328. [DOI] [PubMed] [Google Scholar]
- 52.Bruno, S., M. Bonaccio, S. Bettati, C. Rivetti, C. Viappiani, S. Abbruzzetti, and A. Mozzarelli. 2001. High and low oxygen affinity conformations of T state hemoglobin. Protein Sci. 10:2401–2407. [DOI] [PMC free article] [PubMed] [Google Scholar]
- 53.Samuni, U., D. Dantsker, L. J. Juszczak, S. Bettati, L. Ronda, A. Mozzarelli, and J. M. Friedman. 2004. Spectroscopic and functional characterization of T state hemoglobin conformations encapsulated in silica gels. Biochemistry. 43:13674–13682. [DOI] [PubMed] [Google Scholar]
- 54.Samuni, U., D. Dantsker, I. Khan, A. J. Friedman, E. Peterson, and J. M. Friedman. 2002. Spectroscopically and kinetically distinct conformational populations of sol-gel-encapsulated carbonmonoxy myoglobin: a comparison with hemoglobin. J. Biol. Chem. 277:25783–25790. [DOI] [PubMed] [Google Scholar]
- 55.Navati, M. S., U. Samuni, P. Aisen, and J. M. Friedman. 2003. Binding and release of iron by gel-encapsulated human transferrin: evidence for a conformational search. Proc. Natl. Acad. Sci. USA. 100:3832–3837. [DOI] [PMC free article] [PubMed] [Google Scholar]
- 56.West, J. M., and E. R. Kantrowitz. 2003. Trapping specific quaternary states of the allosteric enzyme aspartate transcarbamoylase in silica matrix sol-gels. J. Am. Chem. Soc. 125:9924–9925. [DOI] [PubMed] [Google Scholar]
- 57.Pioselli, B., S. Bettati, T. V. Demidkina, L. N. Zakomirdina, R. S. Phillips, and A. Mozzarelli. 2004. Tyrosine phenol-lyase and tryptophan indole-lyase encapsulated in wet nanoporous silica gels: selective stabilization of tertiary conformations. Protein Sci. 13:913–924. [DOI] [PMC free article] [PubMed] [Google Scholar]
- 58.Pioselli, B., S. Bettati, and A. Mozzarelli. 2005. Confinement and crowding effects on tryptophan synthase alpha2beta2 complex. FEBS Lett. 579:2197–2202. [DOI] [PubMed] [Google Scholar]
- 59.Viappiani, C., S. Bettati, S. Bruno, L. Ronda, S. Abbruzzetti, A. Mozzarelli, and W. A. Eaton. 2004. New insights into allosteric mechanisms from trapping unstable protein conformations in silica gels. Proc. Natl. Acad. Sci. USA. 101:14414–14419. [DOI] [PMC free article] [PubMed] [Google Scholar]
- 60.Shen, C. Y., and N. M. Kostic. 1997. Kinetics of photoinduced electron-transfer reactions within sol-gel silica glass doped with zinc cytochrome c. Study of electrostatic effects in confined liquids. J. Am. Chem. Soc. 119:1304–1312. [Google Scholar]
- 61.Badjic, J. D., and N. M. Kostic. 1999. Effects of encapsulation in sol-gel silica glass on esterase activity, conformational stability, and unfolding of bovine carbonic anhydrase II. Chem. Mater. 11:3671–3679. [Google Scholar]
- 62.Ezaz-Nikpay, K., K. Uchino, R. E. Lerner, and G. L. Verdine. 1994. Construction of an overproduction vector containing the novel srp (sterically repressed) promoter. Protein Sci. 3:132–138. [DOI] [PMC free article] [PubMed] [Google Scholar]
- 63.Cannone, F., G. Chirico, G. Baldini, and A. Diaspro. 2003. Measurement of the laser pulse width on the microscope objective plane by modulated autocorrelation method. J. Microsc. 210:149–157. [DOI] [PubMed] [Google Scholar]
- 64.Diaspro, A. 2001. Building a two-photon microscope using a laser scanning confocal architecture. In Methods in Cellular Imaging. A. Periasamy, editor. Oxford University Press, New York. 162–179.
- 65.Chirico, G., F. Cannone, S. Beretta, G. Baldini, and A. Diaspro. 2001. Single molecule studies by means of the two-photon fluorescence distribution. Microsc. Res. Tech. 55:359–364. [DOI] [PubMed] [Google Scholar]
- 66.Zimmer, M. 2002. Green fluorescent protein (GFP): applications, structure, and related photophysical behavior. Chem. Rev. 102:759–781. [DOI] [PubMed] [Google Scholar]
- 67.Lossau, H., A. Kummer, R. Heinecke, F. Pollinger-Dammer, C. Kompa, G. Bieser, T. Jonsson, C. M. Silva, M. M. Yang, D. C. Youvan, and M. E. Michel-Beyerle. 1996. Time-resolved spectroscopy of wild-type and mutant green fluorescent proteins reveals excited state deprotonation consistent with fluorophore-protein interactions. Chem. Phys. 213:1–16. [Google Scholar]
- 68.Voityuk, A. A., M. E. Michel-Beyerle, and N. Rosch. 1998. Structure and rotation barriers for ground and excited states of the isolated chromophore of the green fluorescent protein. Chem. Phys. Lett. 296:269–276. [Google Scholar]
- 69.Hess, S. T., A. A. Heikal, and W. W. Webb. 2004. Fluorescence photoconversion kinetics in novel green fluorescent protein pH sensors (pHluorins). J. Phys. Chem. B. 108:10138–10148. [Google Scholar]
- 70.Blum, C., A. J. Meixner, and V. Subramaniam. 2004. Room temperature spectrally resolved single-molecule spectroscopy reveals new spectral forms and photophysical versatility of aequorea green fluorescent protein variants. Biophys. J. 87:4172–4179. [DOI] [PMC free article] [PubMed] [Google Scholar]
- 71.Cannone, F., M. Caccia, S. Bologna, A. Diaspro, and G. Chirico. 2005. Single molecule spectroscopic characterization of GFPmut2 mutant for two-photon microscopy applications. Microsc. Res. Tech. 65:186–193. [DOI] [PubMed] [Google Scholar]
- 72.Wachter, R. M., and S. J. Remington. 1999. Sensitivity of the yellow variant of green fluorescent protein to halides and nitrate. Curr. Biol. 9:R628–R629. [DOI] [PubMed] [Google Scholar]
- 73.Wachter, R. M., D. Yarbrough, K. Kallio, and S. J. Remington. 2000. Crystallographic and energetic analysis of binding of selected anions to the yellow variants of green fluorescent protein. J. Mol. Biol. 301:157–171. [DOI] [PubMed] [Google Scholar]
- 74.Haupts, U., S. Maiti, P. Schwille, and W. W. Webb. 1998. Dynamics of fluorescence fluctuations in green fluorescent protein observed by fluorescence correlation spectroscopy. Proc. Natl. Acad. Sci. USA. 95:13573–13578. [DOI] [PMC free article] [PubMed] [Google Scholar]
- 75.Abbruzzetti, S., E. Grandi, C. Viappiani, S. Bologna, B. Campanini, S. Raboni, S. Bettati, and A. Mozzarelli. 2005. Kinetics of acid-induced spectral changes in the GFPmut2 chromophore. J. Am. Chem. Soc. 127:626–635. [DOI] [PubMed] [Google Scholar]
- 76.Moglich, A., F. Krieger, and T. Kiefhaber. 2005. Molecular basis for the effect of urea and guanidinium chloride on the dynamics of unfolded polypeptide chains. J. Mol. Biol. 345:153–162. [DOI] [PubMed] [Google Scholar]
- 77.Chattoraj, M., B. A. King, G. U. Bublitz, and S. G. Boxer. 1996. Ultra-fast excited state dynamics in green fluorescent protein: multiple states and proton transfer. Proc. Natl. Acad. Sci. USA. 93:8362–8367. [DOI] [PMC free article] [PubMed] [Google Scholar]
- 78.Brejc, K., T. K. Sixma, P. A. Kitts, S. R. Kain, R. Y. Tsien, M. Ormo, and S. J. Remington. 1997. Structural basis for dual excitation and photoisomerization of the Aequorea victoria green fluorescent protein. Proc. Natl. Acad. Sci. USA. 94:2306–2311. [DOI] [PMC free article] [PubMed] [Google Scholar]