

Abstract
Protein self-interaction is important in protein crystal growth, solubilization, and aggregation, both in vitro and in vivo, as with protein misfolding diseases, such as Alzheimer's. Although second virial coefficient studies can supply invaluable quantitative information, their emergence as a systematic approach to evaluating protein self-interaction has been slowed by the limitations of traditional measurement methods, such as static light scattering. Comparatively, self-interaction chromatography is an inexpensive, high-throughput method of evaluating the osmotic second virial coefficient (B) of proteins in solution. In this work, we used self-interaction chromatography to measure B of lysozyme in the presence of various cosolvents, including sucrose, trehalose, mannitol, glycine, arginine, and combinations of arginine and glutamic acid and arginine and sucrose in an effort to develop a better fundamental understanding of protein self-interaction in complex cosolvent systems. All of these cosolvents, alone or in combination, increased B, indicating a reduction in intermolecular attraction. However, the magnitude of cosolvent-induced changes in B was found to be largely dependent on the ability to control long-range electrostatic repulsion. To the best of our knowledge, this work represents the most comprehensive virial coefficient study to date focusing on complex cosolvent-induced effects on the self-interaction of lysozyme.
INTRODUCTION
The study of protein interactions in solution is key to advances in biotechnology, biopharmaceutical development (1), understanding and treating protein misfolding diseases (2), and structural genomics and proteomics (3). Proteins naturally exist in complex multicomponent solutions containing numerous cosolvents (also known as excipients when used in pharmaceutical preparations) that serve vital roles in regulating protein solubility and stability (4). Timasheff (5,6) and colleagues pioneered the development of preferential interaction parameters and excluded volume effects, greatly improving our understanding of protein-cosolvent-water interactions. Nevertheless, direct measures of cosolvent-induced changes to protein behavior in solution are difficult to obtain and labor-intensive (7), prompting continued interest in the development of more efficient and reliable characterization approaches.
The osmotic second virial coefficient (B) is a thermodynamic parameter that characterizes two body interactions in dilute solutions by reflecting the magnitude and sign of interaction (8). Positive B values indicate predominantly repulsive intermolecular interactions, whereas negative values reflect predominantly attractive interactions (9). B correlates to protein stability (as seen in aggregation behavior) and solubility (9–17) by accounting for contributions from electrostatics, van der Waals interactions, excluded volumes, hydration forces, and hydrophobic effects, the same interactions that regulate protein phase behavior (18–20). Current applications and views on evaluating protein self-interaction through B values, along with technological advances aimed at improving the efficiency of making such measurements, are summarized in a recent excellent review by Tessier and Lenhoff (21).
Historically, static light scattering (SLS) has been the most common approach for measuring B of proteins in solutions. Unfortunately, widespread applications of these studies are lacking due to numerous experimental limitations. Macromolecular solution additives, such as polyethylene glycols and surfactants, are difficult to use because they scatter too much light. Small peptides, on the other hand, do not scatter enough light for B measurements. Even when the right conditions are met, SLS measurements can still be prohibitive because of the large quantities of sample needed and the long analysis times. By contrast, self-interaction chromatography (SIC), introduced less than a decade ago (22,23), offers an inexpensive, high-throughput approach to measuring B in complex protein solutions. Compared to SLS, SIC requires at least an order of magnitude less time and sample (24), permits the use of high molecular weight or self-associating cosolvents (25), allows virial coefficient measurements on small biomolecules (i.e., peptides), and has demonstrated the potential for miniaturization (26), further improving its efficiency.
In this study, SIC was used to measure B of lysozyme (LYZ) as a function of sucrose, trehalose, mannitol, glycine, arginine, glutamic acid, and NaCl. This study is broader than previous work because it focuses on the effects of multiple cosolvents on B of a single protein. Existing data in the field of cosolvent-induced changes in protein stability and solubility primarily comes from thermal denaturation experiments (27,28), hydrogen exchange studies (29), circular dichroism spectra (30), surface tension (31), and partial specific volume measurements (32). Thus, in many cases, direct comparison of these results with published literature values would be difficult. However, our SIC results qualitatively agree with the results obtained by these other methods. Additionally, we have obtained limited SLS results that validate the accuracy of using SIC to make B measurements in complex cosolvent systems.
SIC theory
In SIC, the protein of interest is immobilized onto a porous stationary phase and packed into a glass, stainless steel, or polymer-based column. Interactions between the protein free in the mobile phase and immobilized onto the stationary phase are detected as shifts in the retention volume. Moreover, mobile phases are mixed online and multiple samples can be loaded into an autosampler, enabling high-throughput screening of various conditions. B values are calculated using the relation from Tessier et al. (24), modified to achieve the appropriate units:
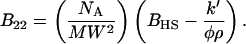 |
(1) |
According to Eq. 1, B can be measured as a function of the protein excluded volume (BHS), the immobilization density (ρ), the phase ratio (φ), and the chromatographic capacity factor (k′). The immobilization density (ρ) is the number of covalently immobilized protein molecules per unit of surface area of the bare chromatography particles. The phase ratio (φ), interpreted from the results of a previous study (33), is the surface area of the protein-modified particles that is available to the mobile phase protein. The chromatographic capacity factor (k′) is a direct measure of the strength of interaction between the mobile phase analyte and the stationary phase (34).
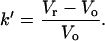 |
(2) |
Equation 2 characterizes SIC retention as a function of the volumes required to elute the interacting mobile phase protein (Vr) and a noninteracting species (neutral marker) of equivalent size (Vo). Dead-column (a column with no immobilized protein) experiments effectively correct for the size difference between proteins and acetone, the neutral marker in these studies. These experiments use ethanolamine-capped particles that have no appreciable interactions with mobile phase analytes. Additionally, all dead-column mobile phases contain 5% NaCl to minimize possible nonspecific protein-surface interactions. The ratio of protein and acetone retention volumes in the dead column (V′r/V′a) is multiplied by the retention volume of acetone in the live column (Va), producing a reasonable estimate for the retention volume of a hypothetically noninteracting species equivalent in size to the protein in interest (Vo).
EXPERIMENTAL PROCEDURE
Reagents
Lysozyme and trehalose were obtained from Calbiochem (San Diego, CA). Mannitol, sucrose, L-arginine, L-glutamic acid, glycine, ethanolamine, potassium phosphate, sodium hydroxide, and sodium chloride were obtained from Fisher Scientific (Pittsburgh, PA). Glacial acetic acid was obtained from Mallinckrodt (Phillipsburg, NJ). Toyopearl AF-Formyl-650M and AF-Amino-650M particles were purchased from Supelco (Bellefonte, PA). All reagents were used as received, without further purification.
Stationary phase modification procedure
LYZ was immobilized onto AF-Formyl-650M chromatography particles as outlined by Tessier et. al. (24). Briefly, LYZ (8 mg) was dissolved in 1.2 mL of 1.0M K2HPO4, pH 7.0. AF-Formyl 650-M chromatography particles (375 μL) were washed three times with 1.2 ml of the same phosphate buffer. The particles and LYZ solution were combined and allowed to settle. Then, 20 μL of the supernatant was removed and diluted to 250 μL for UV absorption measurement of the initial LYZ concentration at 280 nm using a UV-VIS spectrophotometer (Genesis 10uv, Thermo Spectronic, Rochester, NY). Sodium cyanoborohydride (15 mg) was added to the remaining LYZ-particle mixture to activate the coupling reaction. The reaction vial was then put in a room temperature rotary mixer for ∼80 min, after which a final UV measurement was taken exactly as described above. The remaining LYZ was removed by washing the particles with 2.4 mL of phosphate buffer containing 5% (w/v) NaCl. The particles were then washed with the original phosphate buffer. The particles were placed back in the rotary mixer, along with 1.2 mL of 1.0 M ethanolamine, pH 8.0, and 10 mg sodium cyanoborohydride, to cap any unreacted formyl groups. Finally, the particles were washed with 0.1 M acetate, pH 4.5, and stored at 4°C. Ethanolamine capped AF-Formyl-650M particles (used for the dead column) were prepared according to the final step of the coupling procedure described above.
Static light scattering
Sodium acetate buffer containing 5% (w/v) NaCl and varying excipient concentrations were prepared by adding 6.0 g of glacial acetic acid, 50.0 g of NaCl, and the appropriate amount of excipient to ∼900 ml of deionized water, titrating to pH 4.5 with 0.1 M NaOH, and filling with DI water to a 1.0-L mark. Lysozyme stock solutions were prepared in the desired buffer solutions at concentrations ranging from ∼2 to 7 mg/ml, depending on the solubility of the protein. The stock solutions were filtered using 0.22 μm Millex Millipore filters. Protein concentrations were determined spectrophotometrically using ɛ (1%, 1 cm, 280 nm) = 26.3.
SLS measurements for obtaining the second virial coefficient, B, were performed using a DAWN F laser photometer from Wyatt Technology (Santa Barbara, CA). The SLS method requires that the intensity of light scattered by a protein solution be measured as a function of protein concentration. Typically, four to five dilutions of a particular protein stock were prepared and filtered directly into the DAWN F scattering cell. The incident light source was a vertically polarized, 5-mW He-Ne laser with wavelength of 633 nm. Relative scattering intensities in excess of background (solvent, stray light) were converted to absolute scattering intensities (R90) by calibrating the instrument response using toluene as the calibration standard (R90 = 14.06 × 10⁻⁶ cm−1 at 633 nm).
SLS data was analyzed based on the working equation (Eq. 3) given by Kratochvil (35):
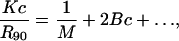 |
(3) |
where K is an optical constant given by Eq. 4:
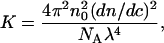 |
(4) |
and n0 is the refractive index of the solvent, NA is Avogadro's number, λ is the wavelength of the incident light, dn/dc is called the refractive index increment for the protein-solvent pair and R90 is the excess Rayleigh factor at a scattering angle of 90° (cm−1) measured as a function of protein concentration. As Eq. 3 suggests, plotting Kc/R90 versus c yields the second virial coefficient, B, from the slope of the plot.
Self-interaction chromatography
All buffers were prepared with 18 MΩ water (Nanopure, Barnstead, Dubuque, IA) and the pH adjusted with either NaOH or HCl. pH was followed using a digital pH meter (UB-5, Denver Instruments, Denver, CO). All mobile phases were buffered at pH 4.5 with 0.1 M acetate, except for the results in Fig. 5, where the buffer pH was increased to 6.0. LYZ and acetone injection samples were dissolved at 15 mg/mL and 2% (v/v), respectively. The SIC column consisted of Teflon FEP Tubing (1/8-inch outer diameter, 1/16-inch inner diameter, Upchurch, Oak Harbor, WA) fitted with a stainless steel frit (2-μm pores, Upchurch). The column was conditioned after packing for several hours with 0.1 M acetate, pH 4.5, at 0.15 mL/min, after which, no further bed settling was observed. Generally, for all experiments where the mobile phases incrementally increased in cosolvent concentrations, one buffer with no cosolvent and another with the maximum cosolvent concentration used were mixed by the high-performance liquid chromatography pump to achieve the entire range of desired conditions. Dead column experiments utilized identical mobile phase conditions with one exception, 5% NaCl was added to all mobile phases to suppress electrostatic interactions between mobile phase analytes and the ethanolamine capped stationary phase.
FIGURE 5.

Changes in LYZ B values as a function of equimolar amounts of arginine and glutamic acid added to solutions of 0.1 M acetate, 5% (w/v) NaCl, pH 6.0.
All chromatographic data were collected on a Hewlett Packard 1050 high-performance liquid chromatography and analyzed using Chemstation software (Dayton, OH). Mobile phases were mixed and degassed online. Sample volumes of 1.0 μL were injected using a Hewlett Packard 1050 autosampler and analyzed at a flow rate of 80 μL/min. Temperatures were controlled with a digital column heater (TC-50, Eppendorf, Westbury, NY). Eluting samples were detected by UV absorption at 280 nm. LYZ samples were run in quadruplicate, and acetone samples in triplicate. The sample chromatograms in Fig. 1 demonstrate the sensitivity of the LYZ peak shape to changes in solution conditions, i.e., LYZ retention times increase and the peaks broaden as LYZ self-interaction becomes increasingly attractive. By contrast, the ACE peak shape is unaffected by changes in solution conditions, indicating its suitability as a neutral marker. In all cases, retention times were taken as the maximum peak height. The methods for B calculations, as well as the relevant assumptions and uncertainties associated with SIC measurements of B, are discussed in detail elsewhere (24).
FIGURE 1.

LYZ and ACE (inset) peak shapes as a function of amount of NaCl in 0.1 M acetate buffer, pH 4.5: 0% (w/v) NaCl (solid line); 2% (w/v) NaCl (dashed line); and 5% (w/v) NaCl (dash-dotted line).
RESULTS AND DISCUSSION
NaCl
To demonstrate the accuracy of SIC, the ability to reproduce SLS results is critical. Therefore, changes in B as a function of NaCl were measured. Salts affect both protein structure and solubility to various degrees (36). In the case of LYZ and NaCl, the salt ions interact strongly with water molecules, shield long-range electrostatic repulsion and enhance attractive hydrophobic effects (37). The result is a reduction in LYZ solubility that corresponds to the decreasing trend in B seen in Fig. 2, where B goes from 3.43 ± 0.38 × 10⁻⁴ at 0% (w/v) NaCl to −6.50 ± 0.04 × 10⁻⁴ mol mL/g2 at 5% (w/v) NaCl. Clearly, our SIC results are in excellent quantitative agreement with those obtained from several independent SLS studies (12,14,38). The line at B = 0 mol mL/g2 has been included as a visual aid indicating a conditions where there is no net attraction or repulsion between LYZ molecules. The correlation between data sets obtained by SIC and SLS strengthens the validity of our experimental approach. This experiment can also be employed as a control to evaluate the stability of a SIC column. Typically, lysozyme-SIC columns lasted for several weeks.
FIGURE 2.

B values of LYZ at 25°C as a function of NaCl (w/v), measured by SIC (▪, 0.1 M acetate, pH 4.5) and several independent SLS studies: (★), 0.1 M acetate, pH 4.2 (14); (▴), 0.1 M acetate, pH 4.2 (38); and (•), 0.04 M acetate, pH 4.6 (12).
Sugars and polyols
The disaccharides sucrose and trehalose and the polyol mannitol are naturally occurring osmolytes that have long been known to stabilize protein structure (39–41). Mechanistically, these cosolvents preferably interact with water (42), migrating away from the protein surface, creating an excluded volume that is proportional to the protein's solvent-exposed surface area (32). Thus, in the presence of these cosolvents, proteins favor a more compact, native-like state (29) determined by circular dichroism (CD) spectroscopy and hydrogen exchange studies with infrared spectroscopy. Fig. 3 shows the results of our SIC measurements of LYZ in the presence of sucrose, trehalose, and mannitol. Interestingly, we found that the measured effects of these cosolvents were significantly dependent on the total solution ionic strength. When 2% (w/v) NaCl was added to all mobile phases, the subsequent addition of the sugar and polyol-based cosolvents had little effect on B, indicating no cosolvent-induced changes in protein self-interaction. For example, in the presence of 2% (w/v) NaCl, B for LYZ changed from 0.10 ± 0.04 × 10⁻⁴ at 0.0 M sucrose to 0.87 ± 0.09 × 10⁻⁴ mol mL/g2 at 0.5 M sucrose and from 0.73 ± 0.29 × 10⁻⁴ at 0.0 M mannitol to 1.03 ± 0.19 × 10⁻⁴ mol mL/g2 at 0.2 M mannitol. On the other hand, addition of the cosolvents to a 5% (w/v) NaCl solution clearly reduced the magnitude of attraction between LYZ molecules. Here, B for LYZ changed from −6.56 ± 0.35 × 10⁻⁴ at 0.0 M sucrose to −0.72 ± 0.43 × 10⁻⁴ mol mL/g2 at 0.5 M sucrose, from −7.25 ± 0.11 × 10⁻⁴ at 0.0 M trehalose to −1.05 ± 0.06 × 10⁻⁴ mol mL/g2 at 0.5 M trehalose, and from −5.89 ± 0.15 × 10⁻⁴ at 0.0 M mannitol to −2.81 ± 0.28 × 10⁻⁴ mol mL/g2 at 0.2 M mannitol. It appears that in the presence of 2% (w/v) NaCl protein self-interaction is still being dominated by long-range electrostatics, as B values for LYZ in 2% (w/v) NaCl, pH 4.5, are slightly positive (between 0.10 ± 0.04 × 10⁻⁴ and 0.73 ± 0.29 × 10⁻⁴ mol mL/g2), indicating weakly repulsive interactions. Increasing the NaCl concentration to 5% (w/v) lowers B to negative values (between −5.89 × 10⁻⁴ and −7.25 × 10⁻⁴ mol mL/g2), as seen in Fig. 2, where long-range electrostatic repulsions are suppressed and protein self-interaction becomes sufficiently attractive to result in self-association. To verify the accuracy of our results with respect to measuring B in the presence of sugars and polyols, SLS experiments were performed. Table 1 compares B obtained by SIC and SLS for sucrose, trehalose, and mannitol. The trends for B are similar between the two techniques.
FIGURE 3.

B values of LYZ as a function of sucrose (squares), mannitol (circles), and trehalose (triangles). Solution conditions: 0.1 M acetate, pH 4.5, and 2% (open symbols) or 5% (solid symbols) (w/v) NaCl.
TABLE 1.
Comparison of lysozyme osmotic second virial coefficients (B) measured by SIC and SLS
| B × 104 (mol mL/g2)
|
||
|---|---|---|
| Cosolvent molarity | SIC | SLS |
| Sucrose* | ||
| 0.2 | −2.56 ± 0.09 | −3.5 ± 0.3 |
| 0.3 | −1.76 ± 0.05 | −2.9 ± 0.6 |
| 0.5 | −0.72 ± 0.44 | 0.7 ± 0.8 |
| Trehalose* | ||
| 0.1 | −5.19 ± 0.14 | −5.80 ± 0.05 |
| 0.2 | −3.86 ± 0.12 | −4.29 ± 0.06 |
| Mannitol* | ||
| 0.04 | −4.57 ± 0.22 | — |
| 0.05 | — | −6.63 ± 0.35 |
| 0.20 | −2.81 ± 0.28 | −2.92 ± 2.20 |
All cosolvents were added to solution conditions of 0.1 M acetate, 5% (w/v) NaCl, pH 4.5, at 25°C.
It is known that protein self-association is largely driven by the formation of short range, noncovalent contacts, such as the coalescence of hydrophobic surface patches between individual molecules (43). This is one of the major ways that proteins reduce their thermodynamically unfavorable excluded volume and solvent-exposed surface area. The other major route involves intramolecular contractions of individual molecules. Notably, it has previously been reported that sugars (29,44) and polyols (45) influence the conformational dynamics of proteins, favoring the most compact conformation within the native-state ensemble. This reduction of protein volume is accompanied by a concomitant reduction in the hydrophobicity of the protein surface, thus reducing the tendency for self-association. These SIC results show that once long-range electrostatics have been minimized, the addition of sugars or polyols significantly reduces the intermolecular attractions, resulting in increased B values.
It is important to stress that the effects of structure-stabilizing cosolvents are independent of ionic strength (30,46). Rather, the conferred stabilization is a result of short-range excluded volume and/or hydrophobic effects, which necessarily influence conformational changes that alter a protein's solvent-exposed surface area. Strong electrostatic repulsion may keep proteins sufficiently far apart that intermolecular interactions are unaffected. Thus, at low ionic strengths and pH values far from the isoelectric point, B measurements may be similarly unaffected by the addition of cosolvents. Conversely, at high ionic strengths where electrostatic repulsion is minimized, intermolecular distances can be reduced to the range where cosolvent-induced stabilization is reflected in the measured B trends.
Amino acids
Glycine and arginine are two of the most well studied amino acid cosolvents. Glycine is a naturally occurring, preferentially excluded structure stabilizer (28,47,48). Conversely, the guanidinium group of arginine is believed to favorably interact with aromatic side chains based on structural analysis studies (49–51), making it a valuable aggregation suppressor, but an inefficient protein structure stabilizer. The effects of arginine and glycine on B, as a function of concentration, are shown in (Fig. 4). The same ionic strength dependence is observed as before. For example, in the presence of 2% (w/v) NaCl, the B value for LYZ changed from 1.04 ± 0.48 × 10⁻⁴ at 0.0 M arginine to 0.94 ± 0.19 × 10⁻⁴ mol mL/g2 at 0.1 M arginine and from 0.20 ± 0.24 × 10⁻⁴ at 0.0 M glycine to 0.54 ± 0.14 × 10⁻⁴ mol mL/g2 at 0.1 M glycine. In the presence of 5% (w/v) NaCl, the B value for LYZ changed from −5.97 ± 0.05 × 10⁻⁴ at 0.0 M arginine to −3.11 ± 0.31 × 10⁻⁴ mol mL/g2 at 0.1 M arginine and from −6.51 ± 0.33 × 10⁻⁴ at 0.0 M glycine to −5.45 ± 0.11 × 10⁻⁴ mol mL/g2 at 0.1 M glycine. From these data, it becomes clear that 0.1 M arginine has a much greater impact on B than an equivalent concentration of glycine. The increase in B as a function of arginine (from −5.97 × 10⁻⁴ at 0.0 M arginine and 5% (w/v) NaCl to −3.11 × 10⁻⁴ mol mL/g2 at 0.1 M arginine and 5% (w/v) NaCl) signifies a reduction in intermolecular attractions. These data are consistent with an SLS study reporting that the addition of 0.5 M arginine to the renaturation buffer significantly increases B (from 1.71 ± 0.76 × 10⁻³ at 0.0 M arginine in a buffer of 1.25 M Gdn-HCl, 6 mM GSSG, 5 mM dithiothreitol, 50 mM Tris, pH 8.0, to 4.76 ± 1.02 10−3 mol mL/g2 at 0.5 M arginine in the same buffer), thereby suppressing LYZ aggregation (52).
FIGURE 4.

B values of LYZ as a function of arginine (circles) and glycine (squares). Solution conditions: 0.1 M acetate, pH 4.5, and 2% (open symbols) or 5% (solid symbols) (w/v) NaCl.
On the other hand, there is only a marginal increase in B as a function of glycine (from 0.20 ± 0.24 × 10⁻⁴ at 0.0 M glycine to 0.54 ± 0.14 × 10⁻⁴ mol mL/g2 at 0.1 M glycine in the presence of 2% (w/v) NaCl and from −6.51 ± 0.33 × 10⁻⁴ at 0.0 M glycine to −5.45 ± 0.11 × 10⁻⁴ mol mL/g2 at 0.1 M glycine in the presence of 5% (w/v) NaCl). Previous investigators (47,48) found that glycine was effective at stabilizing LYZ against thermal denaturation using CD spectroscopy. It is quite possible that glycine could stabilize individual protein structure without affecting intermolecular interactions. The commonality between the previous cosolvents that have been shown to increase B is that they all in some way reduce attractive hydrophobic effects, either by direct interactions with surface hydrophobic patches (as with arginine (53)) or by influencing proteins to intramolecularly bury such patches (as with sugars (29,44) and polyols (45)). However, it has also previously been observed that glycine does not significantly affect the native structure of LYZ (28), providing stabilization only against thermal denaturation (unfolding). This is consistent with the observation that glycine is less effective at altering B and, thus, LYZ intermolecular interactions.
Mixed cosolvents
Combined effects of two amino acids (arginine and glutamic acid) and a sugar and amino acid (sucrose and arginine) on B were also investigated. In the presence of 5% (w/v) NaCl, increasing equimolar amounts of arginine and glutamic acid, up to a combined concentration of 0.2 M, changed B values from −1.41 ± 0.41 × 10⁻³ at 0.0 M arginine + glutamic acid to −8.13 ± 0.29 × 10⁻⁴ mol mL/g2 at 0.2 M arginine + glutamic acid (Fig. 5). In these experiments, the initial solution conditions, representing ΔB = 0, are 0.1 M acetate, 5% (w/v) NaCl, pH 6.0.
On a per-mole basis, the combination of arginine and glutamic acid is more effective at reducing intermolecular attraction (i.e., increasing LYZ B values by 5.98 ± 0.43 × 10⁻⁴ mol mL/g2 for a combined concentration of 0.2 M) than any single cosolvent in this study. These data support previous findings (54) that the simultaneous addition of arginine and glutamic acid dramatically increases protein solubility and long-term stability up to eightfold. Noting that they were working with poorly soluble proteins, these same researchers speculated that the charged and aliphatic portions of these amino acids were favorably interacting with oppositely charged and hydrophobic portions of the protein surface, respectively. Another study (31), using LYZ in solution conditions more comparable to ours with surface tension measurements, reported that the affinity of charged amino acids for oppositely charged groups on the protein surface is enhanced as electrostatic repulsions are minimized. Drawing from these suggestions, we speculate that our data in Fig. 5 support the theory that both arginine and glutamic acid are masking hydrophobic surface patches, thus stabilizing LYZ against self-association.
Arginine and sucrose were also combined (Fig. 6) to determine the impact of two different types of cosolvents on B. The complexity of this particular two cosolvent system is compounded by the very different nature of their preferential interactions with LYZ. It is known by CD spectroscopy that sucrose stabilizes compact native conformations (29,44) and arginine suppresses aggregation (49–51). The former is preferentially excluded from the protein surface and the latter displays weak binding. The link between the two is that they both decrease LYZ self-interaction by reducing attractive hydrophobic effects. These ideas are key to interpreting the data found in Fig. 6, which show a combined but not completely additive effect of arginine and sucrose on B.
FIGURE 6.

Changes in LYZ B values as a function of arginine and sucrose added to solutions of 0.1 M acetate, 5% (w/v) NaCl, pH 4.5.
First, consider the individual effects of sucrose on LYZ structure. It has been shown that the tendency toward more compact conformations and reduction of surface hydrophobicity is proportional to sucrose concentration (29). Consistently, SIC data in Figs. 4 and 6 indicate that higher concentrations of sucrose yield larger increases in B. Meanwhile, arginine is small enough to penetrate the sucrose-excluded volume and interact with LYZ. However, the degree of this interaction depends on the presence of hydrophobic side chains on the surface of LYZ, which is now proportional to the sucrose concentration. This would explain why adding 0.05 M arginine to a solution of 0.25 M sucrose and 5% (w/v) NaCl changed B from 4.07 ± 0.16 × 10⁻⁴ to 5.46 ± 0.16 × 10⁻⁴ (a change of 1.39 ± 0.23 × 10⁻⁴ mol mL/g2) and adding 0.05 M arginine to a solution of 0.50 M sucrose and 5% (w/v) NaCl changed B from 6.00 ± 0.21 × 10⁻⁴ to 6.28 ± 0.17 × 10⁻⁴ (a change of only 0.28 ± 0.27 × 10⁻⁴ mol mL/g2). Furthermore, increasing the concentration of arginine from 0.05 M to 0.10 M changed B by only 0.03 ± 0.23 × 10⁻⁴ mol mL/g2 in the presence of 0.25 M sucrose and only 0.20 ± 0.23 × 10⁻⁴ mol mL/g2 in the presence of 0.50 M sucrose. This suggests that there is a reduction in the number of hydrophobic patches on the protein surface and, thus, even low arginine concentrations can saturate the surface.
CONCLUSIONS
It appears that SIC is an excellent method for determining B for lysozyme self-interaction as a function of several cosolvents, including sucrose, trehalose, mannitol, glycine, arginine, and combinations of arginine and glutamic acid and arginine and sucrose. All of these cosolvents (including cases of combined cosolvents) lead to increased B, reflecting a reduction of intermolecular attraction. An interesting outcome of this study was that B was most affected by these cosolvents once electrostatic repulsions between lysozyme molecules had been fully suppressed (accomplished here by the addition of 5% (w/v) NaCl). This was not completely unexpected since cosolvent-induced stabilization is mechanistically explained in terms of hydration and excluded volume effects, which are much shorter-range than electrostatic forces.
SIC results agree with comparable SLS measurements, strengthening the validity of this approach to measuring B. To the best of our knowledge, this is the most comprehensive study on the ability of cosolvents to affect the self-interaction, and therefore B value, of a protein. Virtually all previous protein B studies have focused on salting out effects for crystallization purposes. Overall, this work demonstrates that SIC offers an efficient, high-throughput approach to measuring B of proteins in complex solutions. More studies of this nature are needed to fully explore all potential advantages and limitations of this characterization approach as well as to develop a fundamental understanding of protein self-interaction in complex solutions.
References
- 1.Manning, M. C., K. Patel, and R. T. Borchardt. 1989. Stability of protein pharmaceuticals. Pharm. Res. 6:903–918. [DOI] [PubMed] [Google Scholar]
- 2.Cohen, F. E., and J. W. Kelly. 2003. Therapeutic approaches to protein-misfolding diseases. Nature. 426:905–909. [DOI] [PubMed] [Google Scholar]
- 3.Tyers, M., and M. Mann. 2003. From genomics to proteomics. Nature. 422:193–197. [DOI] [PubMed] [Google Scholar]
- 4.Chi, E. Y., S. Krishnan, T. W. Randolph, and J. F. Carpenter. 2003. Physical stability of proteins in aqueous solution: mechanism and driving forces in nonnative protein aggregation. Pharm. Res. 20:1325–1336. [DOI] [PubMed] [Google Scholar]
- 5.Timasheff, S. N. 1993. The control of protein stability and association by weak interactions with water: how do solvents affect these processes. Annu. Rev. Biophys. Biomol. Struct. 22:67–97. [DOI] [PubMed] [Google Scholar]
- 6.Timasheff, S. N. 1998. Control of protein stability and reactions by weakly interacting cosolvents: the simplicity of the complicated. Adv. in Protein Chem. 51:355–432. [DOI] [PubMed] [Google Scholar]
- 7.Advant, S. J., D. Komarek, G. Adams, Y. W. Zhang, and R. Seetharam. 1997. Challenges in the analysis of formulated proteins in the presence of excipients. Genet. Eng. News. 17:20. [Google Scholar]
- 8.Neal, B. L., D. Asthagiri, and A. M. Lenhoff. 1998. Molecular origins of osmotic second virial coefficients of proteins. Biophys. J. 75:2469–2477. [DOI] [PMC free article] [PubMed] [Google Scholar]
- 9.Neal, B. L., D. Asthagiri, O. D. Velev, A. M. Lenhoff, and E. W. Kaler. 1999. Why is the osmotic second virial coefficient related to protein crystallization? J. Cryst. Growth. 196:377–387. [Google Scholar]
- 10.Krishnan, S., E. Y. Chi, J. N. Webb, B. S. Chang, D. X. Shan, M. Goldenberg, M. C. Manning, T. W. Randolph, and J. F. Carpenter. 2002. Aggregation of granulocyte colony stimulating factor under physiological conditions: characterization and thermodynamic inhibition. Biochemistry. 41:6422–6431. [DOI] [PubMed] [Google Scholar]
- 11.Chi, E. Y., S. Krishnan, B. S. Kendrick, B. S. Chang, J. F. Carpenter, and T. W. Randolph. 2003. Roles of conformational stability and colloidal stability in the aggregation of recombinant human granulocyte colony-stimulating factor. Protein Sci. 12:903–913. [DOI] [PMC free article] [PubMed] [Google Scholar]
- 12.Rosenbaum, D. F., and C. F. Zukoski. 1996. Protein interactions and crystallization. J. Cryst. Growth. 169:752–758. [Google Scholar]
- 13.George, A., and W. W. Wilson. 1994. Predicting protein crystallization from a dilute-solution property. Acta Crystallogr. D Biol. Crystallogr. 50:361–365. [DOI] [PubMed] [Google Scholar]
- 14.Guo, B., S. Kao, H. McDonald, A. Asanov, L. L. Combs, and W. W. Wilson. 1999. Correlation of second virial coefficients and solubilities useful in protein crystal growth. J. Cryst. Growth. 196:424–433. [Google Scholar]
- 15.Haas, C., J. Drenth, and W. W. Wilson. 1999. Relation between the solubility of proteins in aqueous solutions and the second virial coefficient of the solution. J. Phys. Chem. B. 103:2808–2811. [Google Scholar]
- 16.George, A., Y. Chiang, B. Guo, A. Arabshahi, Z. Cai, and W. W. Wilson. 1997. Second virial coefficient as predictor in protein crystal growth. Methods Enzymol. 276:100–110. [DOI] [PubMed] [Google Scholar]
- 17.Ruppert, S., S. I. Sandler, and A. M. Lenhoff. 2001. Correlation between the osmotic second virial coefficient and the solubility of proteins. Biotechnol. Prog. 17:182–187. [DOI] [PubMed] [Google Scholar]
- 18.Curtis, R. A., H. W. Blanch, and J. M. Prausnitz. 2001. Calculation of phase diagrams for aqueous protein solutions. J. Phys. Chem. B. 105:2445–2452. [Google Scholar]
- 19.Rosenbaum, D., P. C. Zamora, and C. F. Zukoski. 1996. Phase behavior of small attractive colloidal particles. Phys. Rev. Lett. 76:150–153. [DOI] [PubMed] [Google Scholar]
- 20.Haas, C., and J. Drenth. 1999. Understanding protein crystallization on the basis of the phase diagram. J. Cryst. Growth. 196:388–394. [Google Scholar]
- 21.Tessier, P. M., and A. M. Lenhoff. 2003. Measurements of protein self-association as a guide to crystallization. Curr. Opin. Biotechnol. 14:512–516. [DOI] [PubMed] [Google Scholar]
- 22.Przybycien, T. M. 1998. Protein-protein interactions as a means of purification. Curr. Opin. Biotechnol. 9:164–170. [DOI] [PubMed] [Google Scholar]
- 23.Patro, S. Y., and T. M. Przybycien. 1996. Self-interaction chromatography: a tool for the study of protein-protein interactions in bioprocessing environments. Biotechnol. Bioeng. 52:193–203. [DOI] [PubMed] [Google Scholar]
- 24.Tessier, P. M., A. M. Lenhoff, and S. I. Sandler. 2002. Rapid measurement of protein osmotic second virial coefficients by self-interaction chromatography. Biophys. J. 82:1620–1631. [DOI] [PMC free article] [PubMed] [Google Scholar]
- 25.Tessier, P. M., H. R. Johnson, R. Pazhianur, B. W. Berger, J. L. Prentice, B. J. Bahnson, S. I. Sandler, and A. M. Lenhoff. 2003. Predictive crystallization of ribonuclease A via rapid screening of osmotic second virial coefficients. Proteins. 50:303–311. [DOI] [PubMed] [Google Scholar]
- 26.Garcia, C. D., D. J. Hadley, W. W. Wilson, and C. S. Henry. 2003. Measuring protein interactions by microchip self-interaction chromatography. Biotechnol. Prog. 19:1006–1010. [DOI] [PubMed] [Google Scholar]
- 27.Santoro, M. M., Y. F. Liu, S. M. A. Khan, L. X. Hou, and D. W. Bolen. 1992. Increased thermal-stability of proteins in the presence of naturally-occurring osmolytes. Biochemistry. 31:5278–5283. [DOI] [PubMed] [Google Scholar]
- 28.Arakawa, T., and S. N. Timasheff. 1985. The stabilization of proteins by osmolytes. Biophys. J. 47:411–414. [DOI] [PMC free article] [PubMed] [Google Scholar]
- 29.Kim, Y. S., L. S. Jones, A. C. Dong, B. S. Kendrick, B. S. Chang, M. C. Manning, T. W. Randolph, and J. F. Carpenter. 2003. Effects of sucrose on conformational equilibria and fluctuations within the native-state ensemble of proteins. Protein Sci. 12:1252–1261. [DOI] [PMC free article] [PubMed] [Google Scholar]
- 30.Davis-Searles, P. R., A. S. Morar, A. J. Saunders, D. A. Erie, and G. J. Pielak. 1998. Sugar-induced molten-globule model. Biochemistry. 37:17048–17053. [DOI] [PubMed] [Google Scholar]
- 31.Kita, Y., T. Arakawa, T. Y. Lin, and S. N. Timasheff. 1994. Contribution of the surface free-energy perturbation to protein solvent interactions. Biochemistry. 33:15178–15189. [DOI] [PubMed] [Google Scholar]
- 32.Arakawa, T., and S. N. Timasheff. 1982. Stabilization of protein structure by sugars. Biochemistry. 21:6536–6544. [DOI] [PubMed] [Google Scholar]
- 33.DePhillips, P., and A. M. Lenhoff. 2000. Pore size distributions of cation-exchange adsorbents determined by inverse size-exclusion chromatography. J. Chromatogr. A. 883:39–54. [DOI] [PubMed] [Google Scholar]
- 34.Weston, A., and P. R. Brown. (1997) HPLC and CE: Principles and Practice. Academic Press, San Diego, CA.
- 35.Kratochvil, P. (1987) Classical Light Scattering from Polymer Solutions. Elsevier, Amsterdam and New York.
- 36.Curtis, R. A., J. Ulrich, A. Montaser, J. M. Prausnitz, and H. W. Blanch. 2002. Protein-protein interactions in concentrated electrolyte solutions: Hofmeister-series effects. Biotechnol. Bioeng. 79:367–380. [DOI] [PubMed] [Google Scholar]
- 37.Curtis, R. A., J. M. Prausnitz, and H. W. Blanch. 1998. Protein-protein and protein-salt interactions in aqueous protein solutions containing concentrated electrolytes. Biotechnol. Bioeng. 57:11–21. [DOI] [PubMed] [Google Scholar]
- 38.Garcia, C. D., S. C. Holman, C. S. Henry, and W. W. Wilson. 2003. Screening of protein-ligand interactions by affinity chromatography. Biotechnol. Prog. 19:575–579. [DOI] [PubMed] [Google Scholar]
- 39.Xie, G. F., and S. N. Timasheff. 1997. The thermodynamic mechanism of protein stabilization by trehalose. Biophys. Chem. 64:25–43. [DOI] [PubMed] [Google Scholar]
- 40.Lee, J. C., and S. N. Timasheff. 1981. The stabilization of proteins by sucrose. J. Biol. Chem. 256:7193–7201. [PubMed] [Google Scholar]
- 41.Gekko, K., and T. Morikawa. 1981. Thermodynamics of polyol-induced thermal stabilization of chymotrypsinogen. J. Biochem. (Tokyo). 90:51–60. [DOI] [PubMed] [Google Scholar]
- 42.Timasheff, S. N., J. C. Lee, E. P. Pittz, and N. Tweedy. 1976. Interaction of tubulin and other proteins with structure-stabilizing solvents. J. Colloid Interface Sci. 55:658–663. [Google Scholar]
- 43.Curtis, R. A., C. Steinbrecher, A. Heinemann, H. W. Blanch, and J. M. Prausnitz. 2002. Hydrophobic forces between protein molecules in aqueous solutions of concentrated electrolyte. Biophys. Chem. 98:249–265. [DOI] [PubMed] [Google Scholar]
- 44.Kendrick, B. S., J. F. Carpenter, J. L. Cleland, and T. W. Randolph. 1998. A transient expansion of the native state precedes aggregation of recombinant human interferon-gamma. Proc. Natl. Acad. Sci. USA. 95:14142–14146. [DOI] [PMC free article] [PubMed] [Google Scholar]
- 45.Kaushik, J. K., and R. Bhat. 1998. Thermal stability of proteins in aqueous polyol solutions: role of the surface tension of water in the stabilizing effect of polyols. J. Phys. Chem. B. 102:7058–7066. [Google Scholar]
- 46.Saunders, A. J., P. R. Davis-Searles, D. L. Allen, G. J. Pielak, and D. A. Erie. 2000. Osmolyte-induced changes in protein conformation equilibria. Biopolymers. 53:293–307. [DOI] [PubMed] [Google Scholar]
- 47.Arakawa, T., and S. N. Timasheff. 1983. Preferential interactions of proteins with solvent components in aqueous amino-acid solutions. Arch. Biochem. Biophys. 224:169–177. [DOI] [PubMed] [Google Scholar]
- 48.Sabulal, B., and N. Kishore. 1995. Differential scanning calorimetric study of the interactions of some stabilizing amino acids and oligopeptides with hen egg white lysozyme. J. Chem. Soc. Faraday Trans. 91:2101–2106. [Google Scholar]
- 49.Tsumoto, K., M. Umetsu, I. Kumagai, D. Ejima, J. S. Philo, and T. Arakawa. 2004. Role of arginine in protein refolding, solubilization, and purification. Biotechnol. Prog. 20:1301–1308. [DOI] [PubMed] [Google Scholar]
- 50.Baynes, B. M., D. I. C. Wang, and B. L. Trout. 2005. Role of arginine in the stabilization of proteins against aggregation. Biochemistry. 44:4919–4925. [DOI] [PubMed] [Google Scholar]
- 51.Reddy, R. C., H. Lilie, R. Rudolph, and C. Lange. 2005. L-Arginine increases the solubility of unfolded species of hen egg white lysozyme. Protein Sci. 14:929–935. [DOI] [PMC free article] [PubMed] [Google Scholar]
- 52.Ho, J. G. S., A. P. J. Middelberg, P. Ramage, and H. P. Kocher. 2003. The likelihood of aggregation during protein renaturation can be assessed using the second virial coefficient. Protein Sci. 12:708–716. [DOI] [PMC free article] [PubMed] [Google Scholar]
- 53.Clark, E. D., E. Schwarz, and R. Rudolph. 1999. Inhibition of aggregation side reactions during in vitro protein folding. Methods Enzymol. 309:217–236. [DOI] [PubMed] [Google Scholar]
- 54.Golovanov, A. P., G. M. Hautbergue, S. A. Wilson, and L. Y. Lian. 2004. A simple method for improving protein solubility and long-term stability. J. Am. Chem. Soc. 126:8933–8939. [DOI] [PubMed] [Google Scholar]