Abstract
We investigate single-molecule electrophoretic translocation of A50, C50, A25C50, and C50A25 RNA molecules through the α-hemolysin transmembrane protein pore. We observe pronounced bilevel current blockages during translocation of A25C50 and C50A25 molecules. The two current levels observed during these bilevel blockages are very similar to the characteristic current levels observed during A50 and C50 translocation. From the temporal ordering of the two levels within the bilevel current blockages, we infer whether individual A25C50 and C50A25 molecules pass through the pore in a 3′→5′ or 5′→3′ orientation. Correlation between the level of current obstruction and the inferred A25C50 or C50A25 orientation indicates that 3′→5′ translocation of a poly C segment causes a significantly deeper current obstruction than 5′→3′ translocation. Our analysis also suggests that the 3′ ends of C50 and A25C50 RNA molecules are more likely to initiate translocation than the 5′ ends. Orientation dependent differences in a smaller current blockage that immediately precedes many translocation events suggest that this blockage also contains information about RNA orientation during translocation. These findings emphasize that the directionality of polynucleotide molecules is an important factor in translocation and demonstrate how structure within ionic current signals can give new insights into the translocation process.
INTRODUCTION
We study the process wherein RNA molecules are electrophoretically driven through an isolated Staphylococcus aureus α-hemolysin (α-HL) protein pore embedded in an artificial phospholipid bilayer. This process can be observed at the single-molecule level by monitoring the ionic current flowing through the pore (1). Much of the interest in this system arises from potential applications in the detection and analysis of single-stranded DNA (ssDNA) and RNA molecules (2–8). The translocation of ssDNA/RNA through α-HL is also of intrinsic scientific interest because it provides a unique view of polymer dynamics at the single-molecule level and it may serve as a useful model system in the development of our understanding of biologically relevant nanoscale physical and chemical processes (9).
Electrophoretic translocation of an individual polynucleotide molecule through the α-HL pore causes a transient reduction of the ionic current flowing through the pore. Proof of principle for many nucleic acid detection and characterization applications has been provided by analysis of the overall duration and average depth of these current obstructions (2,4,10). These two parameters have also been the primary focus of experimental investigations of translocation dynamics (11,12). However, polynucleotide-induced current blockages exhibit internal structural features. Analysis of these structural features provides further insight into the translocation process (13,14) and will be central to both application development and scientific investigation of the α-HL system.
The directionality of the sugar-phosphate backbone plays an important role in determining the biochemical properties of polynucleotide molecules. Thus, it is reasonable to expect that this directionality affects the electrophoretic translocation of ssDNA/RNA through the α-HL pore. When plotted in the two-dimensional space of translocation duration versus average translocation current, ssDNA and RNA translocation signals often partition into two distinct, well-defined groups (1,2,10). It has been hypothesized that the existence of these two groups is attributable to the directionality of the sugar-phosphate backbone and that they represent translocation in either the 3′→5′ or 5′→3′ orientation (1,2,10). Recent experimental work on ssDNA has given support to this hypothesis (6,15). The role of polynucleotide orientation during translocation has also been discussed in various theoretical treatments of translocation dynamics (16,17).
It was previously demonstrated that RNA diblock copolymers comprised of a poly A and a poly C segment produce bilevel current obstructions during translocation, and that the two levels observed in these obstructions most likely reflect the diblock composition of the molecule (10). In this manuscript, we report on experimental investigations of the translocation of A25C50, C50A25, A50, and C50 RNA molecules through the α-HL pore. We recorded thousands of translocation events for each of the four RNA samples. Every event was analyzed using an algorithm that characterized both bilevel signals within the ionic current translocation record and a smaller current obstruction that often directly preceded translocation. We used the temporal ordering of the bilevel signals produced during translocation of A25C50 and C50A25 to infer the orientations of individual molecules as they passed through the pore. We found a strong correlation between the inferred orientation of a poly C segment during translocation and the level of obstruction of the ionic current. We also found evidence of an asymmetry in the likelihood that the 5′ or 3′ end of a given polymer will be captured by the electric field in the pore and initiate translocation. Orientation-dependent statistical trends observed in the durations of the smaller current obstructions preceding translocation indicated that these obstructions also contain information about polymer orientation during translocation.
MATERIALS AND METHODS
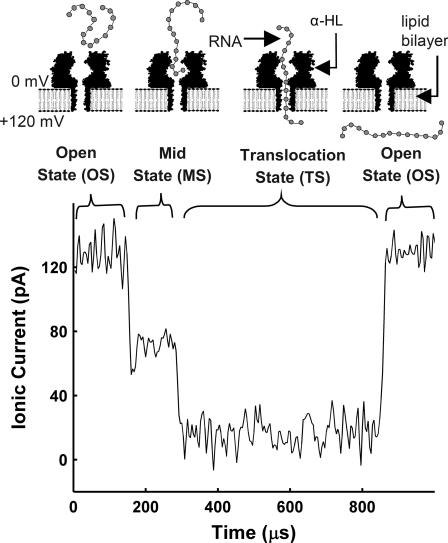
Our data consists of the time series record of the ionic current flowing through a single α-HL transmembrane protein pore that is embedded in an artificial phospholipid bilayer. RNA was introduced on the electrically negative side of the bilayer and transient obstructions in the ionic current were observed when single RNA molecules were electrophoretically driven through the pore (Fig. 1). The passage of each RNA molecule through the pore is referred to as a “translocation event”. The start of translocation was indicated by an abrupt reduction in the ionic current flowing through the pore to a level that is ∼0–20% of the initial, unobstructed “open-state” (OS) current level. We call this ∼0–20% level the “translocation-state” (TS). The TS corresponds to an RNA molecule passing through the narrowest part of the pore. Often the TS was preceded by a “mid-state” (MS) in which the ionic current was reduced to ∼35–85% of the OS current level. As suggested in Fig. 1, the MS is thought to correspond to a pre-translocation configuration where the RNA molecule has been drawn into the vestibule portion of the pore (18) but is not threaded through the narrowest constriction of the pore.
FIGURE 1.
Translocation of RNA through α-HL can be divided into four phases shown schematically in the upper portion of the figure. The lower portion of the figure shows an ionic current signal recorded during translocation of a single A50 RNA molecule through an α-HL pore. Passage of the RNA through the pore results in a brief blockage of the ionic current through the pore. In the MS, the ionic current is reduced to ∼35–85% of the OS value. The MS occurs with varying likelihood for all polynucleotides. It is thought to be related to a polymer that has entered the vestibule portion of the pore but that has not yet threaded into the narrowest part of the pore. During the TS, the ionic current is reduced to ∼0–20% of the OS value. The TS is indicative of a segment of RNA present in the narrowest section of the pore.
Apparatus and procedure
Our experimental apparatus and procedure for the formation of α-HL pores (EMD Biosciences, San Diego, CA) closely followed that described by Akeson et al. (10). Diphytanoyl-PC/hexadecene bilayers (Avanti Polar Lipids, Alabaster, AL) were formed across ∼20 μm diameter aperture in Teflon. All experiments were conducted 21 ± 2°C in pH 8, 1 M KCL, 10 mM HEPES/KOH buffer. For all data presented in this report, 120 mV (cis side negative) was applied across the bilayer. The average of the mean open-state current observed in the four data sets presented in this work was 128 pA. RNA concentrations of ∼1 μM in the ∼160 μl cis volume during data collection resulted in event rates of ∼0.5–2 Hz.
We used an Axopatch-1B patch clamp amplifier (Axon Instruments, Union City, CA) to apply voltage across the bilayer and measure the ionic current flowing through the pore. The analog signal was low-pass filtered at 50 kHz with a 4-pole Bessel filter. The amplified, filtered signal was digitized at 250 kHz with a NI PCI-6014 DAQ card (National Instruments, Austin, TX). Data acquisition was controlled with custom software written in LabWindows/CVI (National Instruments, Austin, TX).
RNA
The four RNA samples used in this work, A50, C50, A25C50 and C50A25, were synthesized and PAGE purified by Dharmacon RNA Technologies (Lafayette, CO). RNA samples were resuspended to a concentration of 20 μM in the experimental buffer and distributed into 10 μl aliquots which were stored at −20°C until immediately before use. After completion of a 10-month experimental period, sample aliquots of each of the four RNA constructs were 5′ end labeled with Polynucleotide Nucleotide Kinase and γ32PATP and run on a 10% denaturing polyacrylamide gel. The dried gel was exposed and scanned on a PhosphorImager (Molecular Dynamics) and gel images were analyzed with ImageQuant (Molecular Dynamics). Image analysis indicated that 60% of the A50 sample, 81% of the C50 sample, 74% of the A25C50 sample, and 67% of the C50A25 sample were full length. The A50 sample also demonstrated 8% N-1 and 6% N-2, which we interpret as incomplete sample purification after synthesis. Shorter RNA molecules in each sample are most likely the result of degradation during storage or handling.
Classification scheme
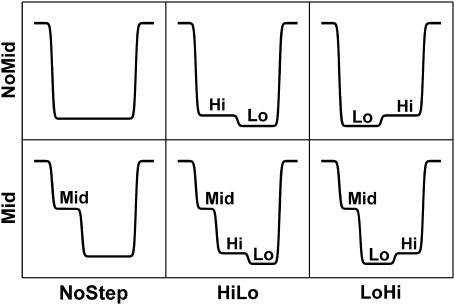
Each translocation signal was classified as one of six signal “types”. Schematic diagrams of these six types are shown in Fig. 2. They reflect the most prominent features observed in the ionic current signals of translocation events. The six signal types are the combination of three signal classes characterizing the TS and the presence or absence of an MS signal. The TS signal classes are NoStep, indicating that the TS does not exhibit a significant step, HiLo, indicating a “high to low” current step, and LoHi, indicating a “low to high” current step. Events demonstrating HiLo or LoHi signals will be collectively referred to as “step” events. The MS signal classes, Mid and NoMid, indicate the presence or absence of an MS preceding the TS of the event. In our nomenclature, the name of each signal type is formed by concatenating the MS and TS class names. For example, a type MidNoStep event has an MS but no step signal within the TS, and a type NoMidLoHi does not have an MS, but does show a “low-to-high” step within the TS.
FIGURE 2.
Translocation event classification scheme. An algorithm was used to classify each event as one of these six “types”. The six types arise from the presence or absence of an MS combined with three possible TS signatures. For example, a MidLoHi event begins with a ∼35–85% mid-state current level. It then transitions to a very low ∼0–10% “Lo” TS level and finally to a moderately low ∼10–20% “Hi” TS level before returning to the initial open-state level.
Data analysis algorithm
Our data analysis was implemented in MATLAB Release 13.1 (The MathWorks, Natick, MA). In our analysis algorithm, each event was fitted by six phenomenological functional forms that represent the six signal types described in the previous subsection. These “type-functions” are sums of logistic functions. Each transition between current levels corresponds to one term in the sum. The type-function used to represent MidHiLo and MidLoHi events is the following:
 |
(1) |
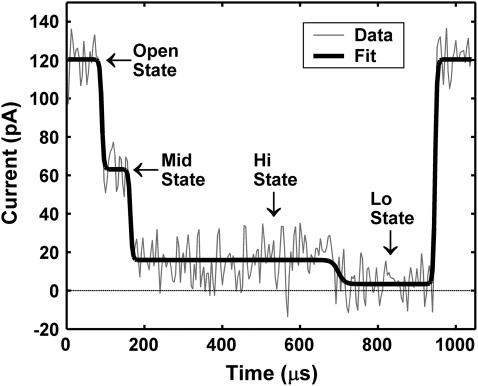
I0 was fixed at the mean OS current level. ΔIi is the difference in current between the ith and (i − 1)th levels, ti is the time at which the ith transition occurs, and τi governs the steepness of the ith transition. The other event types were represented by analogous sums of logistic functions and distinctions between event types were maintained by constraining the bounds of the type-function fit parameters. The ΔIi and ti parameters of each type-function were adjusted to optimize the fit to the event data by the Trust-region algorithm available in the MATLAB Curve Fitting Toolbox. All τi parameters describing OS↔MS↔TS current transitions were fixed to give a 10–90% rise-time of 7 μs to mimic the step response characteristics of our recording electronics. We chose to fix the τi parameter describing the Lo↔Hi TS transition to give a 10–90% rise time of 20 μs instead of 7 μs to better fit the actual Lo↔Hi transitions observed in the data. Our results were relatively insensitive to the specific values at which the τi parameters were fixed. Data and the fit for a MidHiLo event are shown in Fig. 3.
FIGURE 3.
Example fit to a C50A25 translocation event. The dark line shows the best fit to the data. The functional form of this fit is given in Eq. 1 and the event is classified as MidHiLo. Comparison of this fit to the MidNoStep fit with the F-test yielded a p-value of ∼10−14.
We then used the F-test (19) to determine the type-function that provided the best fit to a given event. We first checked for the presence of an MS, and we then checked for a step signal within the TS. To check for the presence of an MS, we compared the MidNoStep fit to the NoMidNoStep fit. If the p-value was <0.05 the event was classified as Mid, otherwise it was classified as NoMid. To check for the presence of a step signal in the TS, we compared the HiLo and LoHi fits to the NoStep fit. The event was classified as HiLo or LoHi if either comparison yielded a p-value <0.05. If neither comparison resulted in a p-value <0.05, then the event was classified as NoStep. The p-value obtained in comparing the MidHiLo fit to the MidNoStep fit for the event shown in Fig. 3 is ∼10−14, reflecting the very strong HiLo TS signal. The parameters of the best fitting type-function were used to estimate the MS, TS, Hi, and Lo current levels and durations.
Test of data analysis algorithm
To test our data analysis we created numerical simulations of translocation event signals and applied our analysis algorithm to these simulated signals. A range of idealized “noiseless” signals were generated by specifying parameters for the above described type-functions. To generate noise in our simulated signals we randomly selected segments of inter-event OS time series data and subtracted off the mean value. We then added the resulting time series data as noise on the simulated noiseless signals. The rms of the noise added to simulated signals was 9.5 pA, and the mean OS current level for the simulated signals was 130 pA, reflecting the experimental conditions we observed with 120 mV applied across the bilayer. These simulations revealed the ranges of TS step sizes and TS sublevel durations in which our algorithm is effective and the ranges in which it is limited. We found that simulated signals were correctly classified >90% of the time if the following criteria were met: The step size, ΔI/IOS, had to be larger than 0.08 and the durations of both the Hi and Lo sublevels had to be longer than 60 μs. As Hi or Lo state durations were made shorter or step sizes smaller, it became increasingly likely that steps that were present in the noiseless signals were not resolved in the signals with noise. Our analysis algorithm classified such events as NoStep, and thus NoStep events can best be interpreted as events that do not meet the above described criteria. In the results section we elaborate on the effects of these known detection inefficiencies in the context of experimentally observed translocation signals.
RESULTS
We present data from one experiment with each of the four RNA samples. These experiments were conducted with 120 mV applied across the bilayer. We repeated these experiments over a period of ten months with 120, 140, or 160 mV applied across the bilayer. The trends described in this report were consistently observed in all experiments. The A50 data set detailed here is representative of 16 data sets from 7 different pores, C50 is representative of 12 data sets from 5 pores, A25C50 is representative of 6 data sets from 3 pores, and C50A25 is representative of 12 data sets from 5 pores.
Translocation characteristics
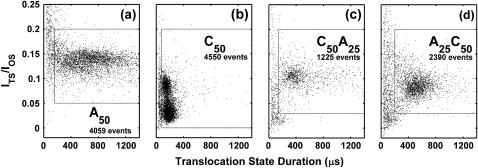
The coordinates of the points shown in Fig. 4 give the durations and average current levels of the TS of each translocation event. These current values represent the average current over the entire TS, and thus step signals have a current intermediate between the two sublevel current values. The location of each group was estimated as the centroid of the region bounded by a contour denoting 50% of the highest density of translocation events. In Fig. 4, most of the A50 events cluster into one main group that is located at a translocation duration of ∼600 μs and ITS/IOS ≈ 0.13. Most of the C50 events cluster into two well-resolved groups centered at ∼150 μs, ITS/IOS ≈ 0.025 and ∼120 μs, ITS/IOS ≈ 0.08. From these group locations we make the rough approximations that adenine segments take ∼12 μs/nt to move through the pore and obstruct the current at ITS/IOS ≈ 0.13, whereas cytosine segments take ∼3 μs/nt and obstruct the current at ITS/IOS ≈ 0.05. These approximations lead to an estimate of ∼450 μs and ITS/IOS ≈ 0.095 for the average duration and current obstruction levels expected for A25C50 and C50A25 translocation. In Fig. 4, the main A25C50 group is centered at ∼490 μs, I/IOS ≈ 0.08 and the main C50A25 is centered at ∼330 μs, I/IOS ≈ 0.10. The durations and current levels exhibited by events in the main A25C50 and C50A25 groups are thus reasonably intermediate between the A50 and C50 homopolymer translocation characteristics.
FIGURE 4.
Distribution of TS durations and current levels for A50, C50, C50A25, and A25C50 RNA. Each point represents one translocation event. The coordinates of the point correspond to the duration and average current of the TS of the event. TS current is expressed as a fraction of the OS current level. (a) Data for A50 RNA. (b) Data for C50 RNA. A50 events fall into one main group, whereas C50 events fall into two well-resolved groups. In c and d, the duration and current characteristics of the main groups of C50A25 and A25C50 events are approximately intermediate between C50 and A50 current blockage and translocation duration characteristics. Events falling outside of the dotted rectangles may arise from incomplete translocation of full-length RNA molecules, from translocation of RNA fragments produced by degradation, or from very rapid translocation of full-length molecules. Lacking a clear interpretation of these events, we chose exclude them from our analysis. The number of events indicated in each panel correspond to the number of points falling within the dashed rectangles. These four data sets were obtained under identical experimental conditions with 120 mV (cis side negative) applied across the bilayer. All results presented in this manuscript are derived from these four data sets. The trends seen in these data sets were consistently observed in data from many repeated experiments.
Although the majority of the events we observed were in or near the main groups, we did observe events that were well separated from the centers of the main groups. In Fig. 4 a there are a number of A50 events with very short durations, and many of these shorter events induce less of an obstruction of the ionic current than events near the center of the main A50 group. These short events could be the result of partial entry of molecules into the pore without translocation (1), translocation of short RNA fragments produced by degradation of our sample (6), or complete, rapid translocation of full-length molecules. Fig. 4, c and d, demonstrate secondary groups of events that are separated from the main groups by regions of low event density. Events in these secondary groups have shorter durations and many of them tend to cause a greater obstruction of the ionic current than events in the main groups. Similar to the short duration A50 events, events in the secondary groups in Fig. 4, c and d, could be interpreted as either incomplete translocation, translocation of short fragments, or complete, rapid translocation of full-length molecules. Since PAGE analysis of our RNA samples suggested that ∼30% of our A50, A25C50, and C50A25 molecules were shorter than full length, we believe translocation of short RNA fragments to be the most likely explanation for the presence of events outside of the main groups. However, we cannot rule out the other two possibilities. Lacking an unambiguous interpretation of events outside of the main groups, we choose to focus our analysis on events falling near the centers of the main groups. The dotted rectangles in Fig. 4 enclose the events included in the results presented in this work. The trends we observe and our overall conclusions are insensitive to the values assigned to these current and duration cutoffs, but we feel that the exclusion of ambiguous events allows for a clearer characterization of the majority of translocation events.
Event classification
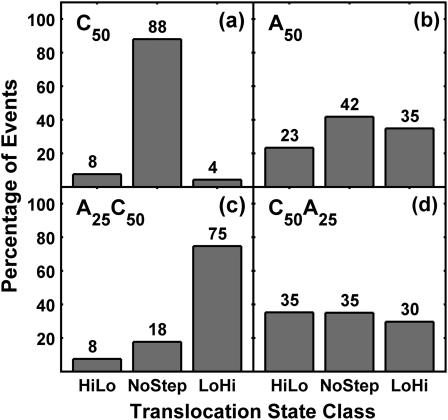
The data presented in Fig. 5 show that the characteristics of TS step signals depend strongly on RNA composition. Our classification algorithm designated 88% of the C50 events as NoStep (Fig. 5 a). The C50 distribution shows that the presence of strong, frequent steps in the TS ionic current signal is not a general phenomenon common to translocation of all RNA sequences. A50 translocation produced 23% HiLo events and 35% LoHi events, indicating that A50 does have a tendency to produce step signals (Fig. 5 b). A25C50 translocation produced a very high percentage of LoHi events (Fig. 5 c). This result is consistent with a simple model wherein the different current blockage levels observed in A50 and C50 translocation (Fig. 4, a and b) are reflected as step signals in copolymer translocation. C50A25 translocation produced a high percentage of step events, but it also produced a significant number of NoStep events (Fig. 5 d). This result is not as consistent with the simple model of copolymer translocation signals. In subsequent sections we compare the detailed characteristics of the step signals observed in A50, C50A25, and A25C50 translocation. This comparison leads to a clear interpretation of the presence of NoStep signals in copolymer translocation and shows that there are significant differences between A50 step signals and copolymer step signals.
FIGURE 5.
Event classification results. The bars in each panel correspond to the percentage of occurrence of the three TS classes: HiLo, NoStep, and LoHi. Panel a shows that the large majority of C50 translocation events do not exhibit strong step signals within the TS ionic current record. Panel c shows that a significant majority of A25C50 events exhibit a strong LoHi step signal. We observe moderate differences in the event-type distributions of A50 and C50A25. Analysis of the current blockage levels of the Lo and Hi substates indicates that most step events observed in A25C50 and C50A25 translocation are produced by the transition between poly A and poly C segments, whereas the step events observed in A50 translocation are produced by fluctuations in ionic current blockage levels that are intrinsic to poly A translocation.
Current blockage levels and RNA orientation during translocation
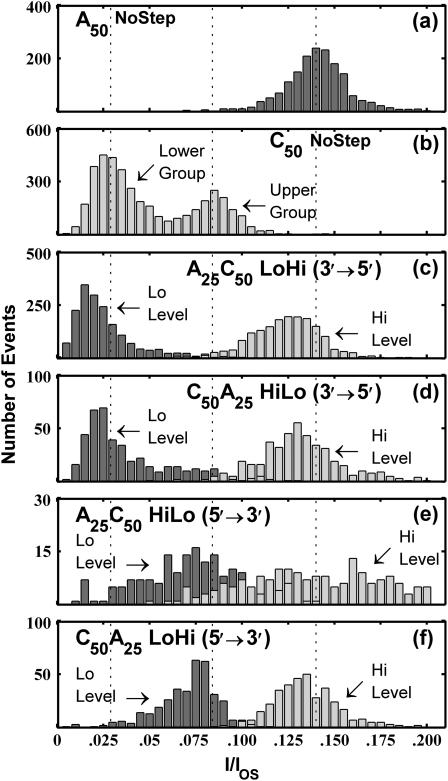
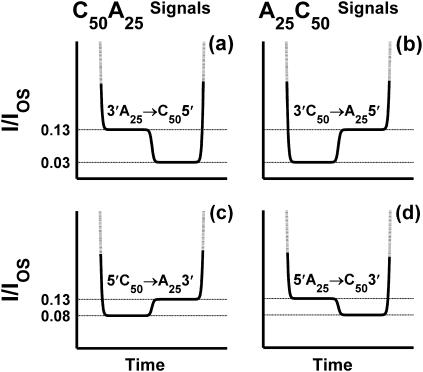
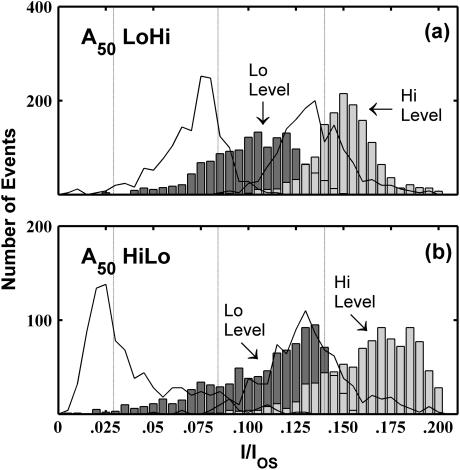
The distributions of the ionic current blockages observed in A50 and C50 NoStep events are shown in Fig. 6, a and b. The A50 current blockage distribution has one peak centered at I/I0 ≈ 0.14, whereas the C50 current blockage distribution has two peaks centered at I/I0 ≈ 0.08 and I/I0 ≈ 0.03. Class HiLo and class LoHi events are those in which we detect a step signal within the TS. The distributions of the current levels for the “Lo” and “Hi” TS substates observed in both HiLo and LoHi events are shown in Fig. 6, c–f. The current levels of the Lo state in A25C50 LoHi events (Fig. 6 c) are very similar to the TS current levels of the lower C50 group (Fig. 6 b) and the current levels of the Hi states in these events are very similar to the current levels of A50 (Fig. 6 a). These similarities suggest that A25C50 LoHi events represent poly C translocation followed by poly A translocation and that these events represent 3′→5′ translocation. The Hi state current levels in C50A25 HiLo events (Fig. 6 d) are very similar to A50 current levels whereas the Lo state levels are similar to the current levels in the lower C50 group. We interpret these similarities as indicative of poly A translocation followed by poly C translocation, suggesting that C50A25 HiLo events also represent 3′→5′ translocation. A25C50 LoHi and C50A25 HiLo events both appear to represent translocation in the 3′→5′ orientation and they both demonstrate Lo TS current levels that are similar to the TS current levels of the lower of the two C50 groups. From this we deduce that 3′→5′ translocation of a poly C segment results in a current blockade of I/IOS ≈ 0.03. The Hi-state current levels for A25C50 HiLo (Fig. 6 e) and C50A25 LoHi (Fig. 6 f) events are similar to the A50 current blockage levels, whereas the Lo state current levels for these events are similar to the current blockage levels of the upper C50 group. From these similarities we infer that A25C50 HiLo and C50A25 LoHi both represent 5′→3′ translocation, and that 5′→3′ poly C translocation results in a current blockade of I/IOS ≈ 0.08. Furthermore, signals suggestive of 5′→3′ copolymer translocation rarely demonstrated a Lo-state current blockage level of I/IOS ≈ 0.03, whereas signals suggestive of 3′→5′ copolymer translocation rarely demonstrated a Lo-state current blockage level of I/IOS ≈ 0.08. These trends indicate a strong correlation between poly C orientation and the level of ionic current blockage. A schematic diagram illustrating the orientation dependent bilevel signals is shown in Fig. 7. We further interpret the strong similarities between the step signal Lo levels and the two C50 current blockage levels as evidence that the lower group of C50 events in Fig. 4 b is representative of 3′→5′ translocation of C50 molecules whereas the upper group is representative of 5′→3′ translocation.
FIGURE 6.
Distributions of translocation state current blockage levels. Panels a and b show the distribution of TS current levels for all NoStep events observed in the A50 and C50 data, respectively. The two peaks in the C50 distribution correspond to the two C50 groups shown in Fig. 4. The dashed vertical lines correspond to mean current levels determined by Gaussian fits to the A50 distribution and to the lower and upper C50 distributions. Panels c–f show the distributions of the Hi and Lo TS substate current levels observed in the indicated event classes. From the time ordering of the step signal, we inferred the order in which the segments moved through the pore. Thus, we interpret HiLo events as A25→C50 and LoHi events as C50→A25. Comparing this information with the RNA sequence gives the orientation, 3′→5′ or 5′→3′, of the molecule during translocation. The inferred translocation orientations for each group of copolymer events are indicated in the corresponding panel.
FIGURE 7.
Diagram of the relationships between RNA orientation during translocation and observed TS signals for A25C50 and C50A25 copolymers. These relationships are inferred from the time ordering and current obstruction levels of the TS step signals shown in Fig. 6. We infer that poly A translocation results in I/IOS ≈ 0.13, regardless of orientation. However, poly C translocation results in I/IOS ≈ 0.03 for 3′→5′ translocation and I/IOS ≈ 0.08 for 5′→3′ translocation.
Our interpretation of the data in Fig. 6 implies that 3′→5′ translocation of A25C50 and C50A25 produces a strong, ΔI/IOS ≈ 0.11 step in the TS signal whereas 5′→3′ translocation produces a smaller ΔI/IOS ≈ 0.06 step. As described in Materials and Methods, we determined that our data analysis algorithm efficiently detects TS step signals that are larger than ΔI/IOS ≈ 0.08, and so it is unlikely that many 3′→5′ copolymer translocation events are classified as NoStep. However, our detection efficiency and accuracy declines with decreasing TS step signal size below ΔI/IOS ≈ 0.08. Thus it is reasonable to expect that many 5′→3′ copolymer translocation events are classified as NoStep events.
MS characteristics
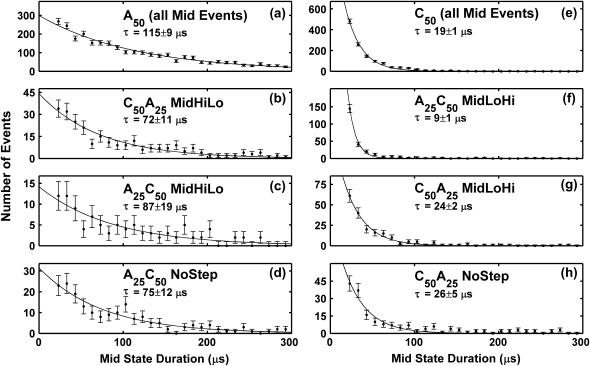
As with the TS characteristics shown in Fig. 4, a and b, we observed significant differences in the characteristics of the MS signals produced immediately before A50 and C50 translocation. However, unlike the TS distributions shown in Fig. 4, a and b, the two-dimensional A50 and C50 MS distributions have a significant region of overlap. Consequently, C50 and A50 MS signals are not distinguishable at the level of individual events. However, the statistical behavior of C50 and A50 MS signals is readily distinguishable. Fig. 8, a and e, shows the A50 and C50 MS duration distributions. We parameterized the distributions with an exponential fit and defined the exponential time constant as a phenomenological “characteristic MS duration”. As shown in Fig. 8, a and e, the characteristic A50 MS duration is significantly longer than the characteristic C50 MS duration. Fig. 8, b and c, show the MS duration distributions of C50A25 and A25C50 HiLo events. As described in the previous section, we interpret these events as arising from poly A translocation followed by poly C translocation. Fig. 8, f and g, shows the MS duration distributions of C50A25 and A25C50 LoHi events, both of which we interpret as arising from poly C translocation followed by poly A translocation. We find that the copolymer MS signals identified with A-first entry have significantly longer characteristic durations than copolymer MS signals that are identified with C-first entry. This trend suggests that the characteristics observed in A50 and C50 homopolymer MS signals are reflected in A25C50 and C50A25 MS signals and that MS signals are indicative of the segment of the molecule that goes on to initiate translocation. Furthermore, the A25C50 NoStep MS distribution in Fig. 8 d is very similar to the A25C50 HiLo MS distribution and quite distinct from the A25C50 LoHi MS distribution. Analogously, the C50A25 NoStep MS distribution in Fig. 8 h is similar the C50A25 LoHi MS distribution and distinct from the C50A25 HiLo MS distribution. These observations support our conjecture that most NoStep copolymer events arise from 5′→3′ translocation.
FIGURE 8.
Distributions of MS durations. Error bars on the data points represent the statistical uncertainty in binning the data. The solid lines show exponential fits to the data. The exponential time constant and 95% confidence intervals derived from the fit are given for each distribution. Panels a and e show that mid-states produced by A50 tend to be significantly longer than mid-states produced by C50. The distributions shown in panels b and c arise from events where we inferred that the molecules entered the pore with the poly A segment first, whereas the distributions in panels f and g correspond to C-first entry. The tendency of an A50 molecule to produce a longer mid-state than a C50 molecule appears to be reflected in copolymer translocation as a tendency for the A25 segment to produce a longer mid-state than the C50 segment. Comparison of the distribution in panel (d) with the distributions in panels b and c suggests that most A25C50 MidNoStep events correspond to A-first entry, whereas comparison of the distribution in panel h with the distributions in panels f and g suggests that most C50A25 MidNoStep events correspond to C-first entry. These observations provide qualitative support for our conjecture that most NoStep copolymer events are a result of the small size of the step signal produced during 5′→3′ translocation.
5′ vs. 3′ capture asymmetry
The correlation between the inferred poly C orientation and TS current blockage level suggests that translocation events in the upper C50 group in Fig. 4 a represent 5′ first entry, whereas events in the lower group represent 3′ first entry. By fitting the distribution shown in Fig. 6 b to the sum of two Gaussian curves and then comparing the relative areas under each curve, we estimate that 64% of the time C50 translocation begins with the 3′ end (lower group) whereas 36% of the time it begins with the 5′ end (upper group). Our classification algorithm designates 75% of the A25C50 events as LoHi, indicative of 3′ first entry for this molecule. Following our conjecture about 5′→3′ classification and evidence in the MS data, we make the crude but reasonable assumption that all NoStep events represent 5′ end first entry of polymers into the pore. With this assumption, we estimate a lower bound of 75% on the likelihood that an A25C50 molecule will enter the pore 3′ end first and a corresponding upper bound of 25% on 5′ first entry. Thus we deduce a significant asymmetry in the capture probabilities for the two ends of A25C50 molecules favoring the 3′, poly C end. For C50A25, our algorithm designates 35% of the events as HiLo, which we interpret as 3′ first entry. Again assuming that all NoStep events represent 5′→3′ translocation, we estimate an upper bound of 65% and a lower bound of 35% for the likelihood that a C50A25 molecule will enter the pore 5′ first or 3′ first, respectively. The C50A25 data suggest a possible capture asymmetry favoring the 5′, poly C end, but this asymmetry is dependent upon the accuracy of the assumption about NoStep event orientations. Preferred poly C first entry of C50A25 molecules, corresponding to 5′→3′ translocation and the smaller step signal, does provide a plausible explanation for the observation that C50A25 translocation produces a much higher percentage of NoStep events than A25C50 translocation (Fig. 5, d and c, respectively).
A50 TS step signals
During visual inspection of individual A50 translocation signals, we observed frequent, sizeable fluctuations in the level of ionic current obstruction. We analyzed the noise observed in the OS and the TS of five A50 experiments at 120 mV. The average variance of the OS current signal for these five experiments was ∼55 pA2, whereas the average TS variance was ∼88 pA2. In three C50 experiments at 120 mV we also observed an average OS variance of ∼55 pA2, but the average TS variance was only ∼72 pA2. These observations are consistent with visual inspection of translocation signals and suggest that A50 translocation results in greater fluctuation of the TS ionic current level than C50 translocation. These poly A fluctuations can be interpreted by our data analysis as bilevel signals, producing the A50 step events shown in Fig. 5 b. Fig. 9 indicates that there are significant differences in step signals produced by poly A fluctuations and step signals produced by transitions between poly A and poly C segments within one copolymer molecule. Specifically, the poly A induced Lo level obstructs the current less than either of the poly C induced Lo levels. The data presented in Fig. 9, the strong agreement of A25C50 and C50A25 Hi and Lo current levels with A50 and C50 current levels, and the consistency of MS and TS orientation information all suggest that it is unlikely that poly A fluctuations are responsible for a large fraction of the A25C50 or C50A25 step events. However, the presence of poly A fluctuations in copolymer translocation signals likely complicates detection and characterization of poly A↔poly C step signals. In particular, poly A fluctuations are likely to further hinder detection and characterization of the already small TS step signal arising from 5′→3′ copolymer translocation.
FIGURE 9.
We observed frequent step signals in A50 translocation. Distributions of Hi-state and Lo-state current blockage levels for A50 LoHi and A50 HiLo step events are shown in a and b, respectively. As a comparison, the solid black lines show the corresponding C50A25 current level distributions. The dashed vertical lines correspond to mean current levels determined by Gaussian fits to the A50 distribution and to the lower and upper C50 distributions in Fig. 6. The Lo level in A50 step events causes a smaller ionic current obstruction than either poly C related Lo level. This provides evidence that step events observed in C50A25 and A25C50 translocation are caused by differences between poly A and poly C ionic current obstruction, and not by fluctuations in poly A current obstruction levels.
DISCUSSION
The characteristics we observe in A50 and C50 homopolymer translocation are in good agreement with those previously reported for translocation of poly A and poly C homopolymers (10), and the step signal characteristics we observe in A25C50 translocation are consistent with those reported for the translocation of A30C70Gp RNA molecules (10). The partitioning of translocation events into two fairly distinct groups appears to be a rather general phenomenon (1,2,6,15). Our investigation gives strong experimental support to the hypothesis that the two distinct groups observed in poly C homopolymer translocation represent 3′→5′ and 5′→3′ translocation. Recent investigations involving chemically modified ssDNA molecules (6) and hairpin ssDNA molecules with homogeneous, 50-nucleotide long adenine overhangs (15) both found a correlation between DNA orientation and the partitioning of translocation events into two groups. In our work with C50 RNA and both investigations with ssDNA (6,15), events that caused a larger obstruction in the ionic current were more frequent and were identified with 3′-first entry of polynucleotide molecules into the α-HL pore. In addition to orientation-dependent differences in the level of ionic current obstruction, we also saw evidence of orientation-dependent differences in translocation durations. Continued refinement of our data analysis algorithm, the use of more sophisticated feature extraction and classification algorithms (13,14), improvements in the signal to noise in our measurements and more precise control of experimental parameters should allow an accurate characterization of TS sublevel duration distributions. Such measurements may enable the exploration of the orientation dependence of translocation durations and may lead to meaningful comparison between experimental observations and theoretical models of translocation dynamics (16,17,20).
The presence of a polynucleotide within the α-HL vestibule that is not threaded through the narrowest constriction of the pore results in a partial, ∼50% obstruction in the ionic current. This partial conductance state has been used to make a detailed analysis of the conformations adopted by hairpin DNA lodged in the α-HL vestibule (14). It has also been used to study the binding kinetics of short DNA duplexes present in the vestibule of engineered α-HL pores (21). We found evidence that the characteristics observed in RNA homopolymer MS signals are reflected in the characteristics of MS signals produced by homogeneous segments at the ends of RNA copolymer molecules. We also found evidence that the MS is indicative of the segment of the RNA molecule that goes on to initiate translocation. Although the MS analysis presented in this work cannot be used to determine the orientations of individual molecules during translocation, statistical information contained in the MS provides useful qualitative support for our conjecture that copolymer translocation events lacking a detectable TS step were produced predominately by 5′→3′ translocation.
Further development of experimental methods and data analysis techniques should enable the determination of 5′ vs. 3′ entry likelihoods with a high degree of precision. Accurate characterization of these orientation-dependent entry likelihoods combined with a more thorough investigation and characterization of the MS should give further insight into the capture phase of the translocation process (12,22,23). Increased understanding of this capture phase is particularly important for development of detector applications of the α-HL system (4,7).
A number of molecular level mechanisms underlying various translocation phenomena have been proposed (10,12,15,23). It was suggested that differing secondary structure is the primary cause of the current and duration differences observed in the translocation of A50 and C50 molecules (10) and a confinement-induced asymmetric tilt of the bases toward the 5′ end of the polymer has been implicated as the mechanism underlying observed orientation-dependent differences in the ionic current obstruction and diffusional dynamics of ssDNA molecules (15). Continued experimental and theoretical characterization are fundamental to the development of a detailed understanding of the α-HL system at the molecular level, and recent work has shown that simulation is a promising new tool for investigating the molecular details of the α-HL system (15,24–26).
SUMMARY AND CONCLUSIONS
We have conducted a systematic analysis of the prominent features observed in the ionic current signals produced by translocation of four different RNA molecules. We inferred the orientation of individual A25C50 and C50A25 RNA molecules as they were electrophoretically driven through the α-HL protein pore by monitoring the time ordering of the bilevel signals they produced during translocation. Our analysis provided strong evidence that the orientation of a poly C segment as it moves through the pore significantly affects the level at which it obstructs the ionic current flowing through the pore. Our analysis also indicated a difference in the likelihood of 5′ vs. 3′ capture by the electric field in the pore for C50 and A25C50 molecules. We also found orientation-dependent trends in the durations of smaller current obstructions preceding translocation, suggesting that the smaller obstructions also contain useful information about translocation orientation. These results emphasize that polynucleotide orientation is an important factor that should be taken into consideration when interpreting translocation data, developing models of the translocation process, or developing technological applications for the α-HL system. This work also illustrates how analysis of structure within translocation signals can give insight into subtle details of the translocation. Models of the molecular processes underlying these findings will lead to a better understanding of the dynamics of confined polymers and the interactions between polynucleotide molecules and the protein pore. Such understanding is vital to the development of the α-HL system as a useful model for biological processes and as a practical single molecule analytical device.
Acknowledgments
We acknowledge and thank Drs. M. Akeson, D. Deamer, and the University of California, Santa Cruz, nanopore group for teaching us the protocol for the formation of α-HL nanopores and for continued help in our nanopore research efforts. We are very grateful to Bertil Hille for loan of the patch clamp amplifier and for careful review of this manuscript. We also thank Christian Lanciault for PAGE analysis of RNA.
This work was supported by the National Science Foundation Integrative Graduate Education and Research Traineeship fellowship program, The University of Washington Royalty Research Fund, the University of Washington Physics Department, and the University of Washington Microbiology Department.
References
- 1.Kasianowicz, J. J., E. Brandin, D. Branton, and D. W. Deamer. 1996. Characterization of individual polynucleotide molecules using a membrane channel. Proc. Natl. Acad. Sci. USA. 93:13770–13773. [DOI] [PMC free article] [PubMed] [Google Scholar]
- 2.Meller, A., L. Nivon, E. Brandin, J. Golovchenko, and D. Branton. 2000. Rapid nanopore discrimination between single polynucleotide molecules. Proc. Natl. Acad. Sci. USA. 97:1079–1084. [DOI] [PMC free article] [PubMed] [Google Scholar]
- 3.Howorka, S., S. Cheley, and H. Bayley. 2001. Sequence-specific detection of individual DNA strands using engineered nanopores. Nat. Biotechnol. 19:636–639. [DOI] [PubMed] [Google Scholar]
- 4.Kasianowicz, J. J., S. E. Henrickson, H. H. Weetall, and B. Robertson. 2001. Simultaneous multianalyte detection with a nanometer-scale pore. Anal. Chem. 73:2268–2272. [DOI] [PubMed] [Google Scholar]
- 5.Vercoutere, W., S. Winters-Hilt, H. Olsen, D. Deamer, D. Haussler, and M. Akeson. 2001. Rapid discrimination among individual DNA hairpin molecules at single-nucleotide resolution using an ion channel. Nat. Biotechnol. 19:248–252. [DOI] [PubMed] [Google Scholar]
- 6.Wang, H., J. E. Dunning, A. P. H. Huang, J. A. Nyamwanda, and D. Branton. 2004. DNA heterogeneity and phosphorylation unveiled by single-molecule electrophoresis. Proc. Natl. Acad. Sci. USA. 101:13472–13477. [DOI] [PMC free article] [PubMed] [Google Scholar]
- 7.Nakane, J., M. Akeson, and A. Marziali. 2002. Evaluation of nanopores as candidates for electronic analyte detection. Electrophoresis. 23:2592–2601. [DOI] [PubMed] [Google Scholar]
- 8.Nakane, J., M. Wiggin, and A. Marziali. 2004. A nanosensor for transmembrane capture and identification of single nucleic acid molecules. Biophys. J. 87:615–621. [DOI] [PMC free article] [PubMed] [Google Scholar]
- 9.Meller, A. 2003. Dynamics of polynucleotide transport through nanometre-scale pores. J. Phys. Condens. Matter. 15:R581–R607. [Google Scholar]
- 10.Akeson, M., D. Branton, J. J. Kasianowicz, E. Brandin, and D. W. Deamer. 1999. Microsecond time-scale discrimination among polycytidylic acid, polyadenylic acid, and polyuridylic acid as homopolymers or as segments within single RNA molecules. Biophys. J. 77:3227–3233. [DOI] [PMC free article] [PubMed] [Google Scholar]
- 11.Meller, A., L. Nivon, and D. Branton. 2001. Voltage-driven DNA translocations through a nanopore. Phys. Rev. Lett. 86:3435–3438. [DOI] [PubMed] [Google Scholar]
- 12.Meller, A., and D. Branton. 2002. Single molecule measurements of DNA transport through a nanopore. Electrophoresis. 23:2583–2591. [DOI] [PubMed] [Google Scholar]
- 13.Kasianowicz, J. J., S. E. Henrickson, M. Misakian, H. H. Weetall, and B. Robertson. 2002. Physics of DNA threading through a nanometer pore and applications to simultaneous multianalyte sensing. In Structure and Dynamics of Confined Polymers. J. J. Kasianowicz, M. S. Z. Kellermayer, and D. W. Deamer, editors. Kluwer Academic Publishers, Dordrecht, The Netherlands. 141–163
- 14.Winters-Hilt, S., W. Vercoutere, V. S. DeGuzman, D. Deamer, M. Akeson, and D. Haussler. 2003. Highly accurate classification of Watson-crick basepairs on termini of single DNA molecules. Biophys. J. 84:967–976. [DOI] [PMC free article] [PubMed] [Google Scholar]
- 15.Mathe, J., A. Aksimentiev, D. R. Nelson, K. Schulten, and A. Meller. 2005. Orientation discrimination of single-stranded DNA inside the alpha-hemolysin membrane channel. Proc. Natl. Acad. Sci. USA. 102:12377–12382. [DOI] [PMC free article] [PubMed] [Google Scholar]
- 16.Lubensky, D. K., and D. R. Nelson. 1999. Driven polymer translocation through a narrow pore. Biophys. J. 77:1824–1838. [DOI] [PMC free article] [PubMed] [Google Scholar]
- 17.Muthukumar, M. 2002. Theory of sequence effects on DNA translocation through proteins and nanopores. Electrophoresis. 23:1417–1420. [DOI] [PubMed] [Google Scholar]
- 18.Song, L., M. R. Hobaugh, C. Shustak, S. Cheley, H. Bayley, and J. E. Gouaux. 1996. Structure of staphylococcal alpha-hemolysin, a heptameric transmembrane pore. Science. 274:1859–1866. [DOI] [PubMed] [Google Scholar]
- 19.Motulsky, H., and A. Christopoulos. 2004. Fitting Models to Biological Data using Linear and Nonlinear Regression: a Practical Guide to Curve Fitting. Oxford University Press, Oxford, New York.
- 20.Kolomeisky, A. B., and E. Slonkina. 2003. Polymer translocation through a long nanopore. J. Chem. Phys. 118:7112–7118. [Google Scholar]
- 21.Howorka, S., L. Movileanu, O. Braha, and H. Bayley. 2001. Kinetics of duplex formation for individual DNA strands within a single protein nanopore. Proc. Natl. Acad. Sci. USA. 98:12996–13001. [DOI] [PMC free article] [PubMed] [Google Scholar]
- 22.Ambjornsson, T., S. P. Apell, Z. Konkoli, E. A. Di Marzio, and J. J. Kasianowicz. 2002. Charged polymer membrane translocation. J. Chem. Phys. 117:4063–4073. [Google Scholar]
- 23.Henrickson, S., M. Misakian, B. Robertson, and J. J. Kasianowicz. 2000. Driven DNA transport into an asymmetric nanometer-scale pore. Phys. Rev. Lett. 85:3057–3060. [DOI] [PubMed] [Google Scholar]
- 24.Aksimentiev, A., J. B. Heng, G. Timp, and K. Schulten. 2004. Microscopic kinetics of DNA translocation through synthetic nanopores. Biophys. J. 87:2086–2097. [DOI] [PMC free article] [PubMed] [Google Scholar]
- 25.Noskov, S. Y., W. Im, and B. Roux. 2004. Ion permeation through the alpha-hemolysin channel: theoretical studies based on Brownian dynamics and Poisson-Nernst-Plank electrodiffusion theory. Biophys. J. 87:2299–2309. [DOI] [PMC free article] [PubMed] [Google Scholar]
- 26.Aksimentiev, A., and K. Schulten. 2005. Imaging alpha-hemolysin with molecular dynamics: ionic conductance, osmotic permeability, and the electrostatic potential map. Biophys. J. 88:3745–3761. [DOI] [PMC free article] [PubMed] [Google Scholar]


