Abstract
The Kaposi’s sarcoma-associated herpesvirus (KSHV) (or human herpesvirus 8) open reading frame (ORF) K15 encodes a putative integral transmembrane protein in the same genomic location as latent membrane protein 2A of Epstein-Barr virus. Ectopic expression of K15 in cell lines revealed the presence of several different forms ranging in size from full length, ∼50 kDa, to 17 kDa. Of these different species the 35- and 23-kDa forms were predominant. Mutational analysis of the initiator AUG indicated that translation initiation from this first AUG is required for K15 expression. Computational analysis indicates that the different forms detected may arise due to proteolytic cleavage at internal signal peptide sites. We show that K15 is latently expressed in KSHV-positive primary effusion lymphoma cell lines and in multicentric Castleman’s disease. Using a yeast two-hybrid screen we identified HAX-1 (HS1 associated protein X-1) as a binding partner to the C terminus of K15 and show that K15 interacts with cellular HAX-1 in vitro and in vivo. Furthermore, HAX-1 colocalizes with K15 in the endoplasmic reticulum and mitochondria. The function of HAX-1 is unknown, although the similarity of its sequence to those of Nip3 and Bcl-2 infers a role in the regulation of apoptosis. We show here that HAX-1 can form homodimers in vivo and is a potent inhibitor of apoptosis and therefore represents a new apoptosis regulatory protein. The putative functions of K15 with respect to its interaction with HAX-1 are discussed.
Kaposi’s sarcoma (KS)-associated herpesvirus (KSHV) is the infectious cause of KS and is also linked to the pathogenesis of certain lymphoproliferations (4, 14). It is proposed that KSHV latent proteins are directly involved in modulating signal transduction pathways and cellular circuits leading to uncontrolled cell proliferation (2).
At the far right-hand end of the KSHV genome, open reading frame (ORF) K15 encodes a putative transmembrane protein in the same genomic location as the Epstein-Barr virus (EBV) latent membrane protein 2A (LMP2A) (5, 7, 12, 39). K15 resembles LMP2A not only in genomic location but also in its splicing pattern and predicted protein structure. Two highly divergent forms of K15 have been identified: the predominant (P) and minor (M) forms (5, 12, 39). These two alleles possess only 33% amino acid identity yet retain 12 membrane-spanning domains and a putative cytoplasmic signal-transducing carboxyl terminus (C terminus) (5). The C terminus of K15 has potential signaling motifs, including Src homology 2 and 3 binding domains (SH2-B and SH3-B, respectively) (12). A CD8-K15 C-terminal chimeric protein was shown to be constitutively tyrosine phosphorylated within the SH2-B motif (5). Like LMP2A, this CD8-K15 chimeric protein modulates B-cell receptor (BCR) signal transduction. The mechanism(s) of signal transduction is unknown but appears to be distinct from that of LMP2A and does not involve intracellular free calcium mobilization (5).
In addition, the C terminus of K15 has sequences similar to those found in EBV LMP1, including a putative tumor necrosis factor receptor-associated factor (TRAF) binding site. K15 therefore appears to be a hybrid of a distant evolutionary relative of both EBV LMP1 and LMP2A (13). The putative C terminus of K15 has been shown to interact with the TRAFs (12), and we have also shown that K15 can indeed activate NF-κB via this putative TRAF binding site (unpublished data). By way of activating NF-κB, LMP1 of EBV plays an essential role in EBV-induced transformation of B lymphocytes (3, 16, 21). NF-κB activation also appears to be essential for the proliferation potential of KSHV positive primary effusion lymphoma (PEL) cells (22), but whether all of this NF-κB activity in PEL cells is due to K15 expression is not yet known.
Although K15 mRNA has been demonstrated in PEL cells (5, 12, 39), it is not known whether the K15 protein is actually expressed in latently infected tumor cells. The size of endogenous protein, its exact subcellular localization, and its cellular binding partners have not previously been determined.
We generated a monoclonal antibody (MAb) against K15 and show here that when K15 cDNA is ectopically expressed we detect the predicted 50-kDa form as well as a series of smaller proteolytically cleaved forms, of which the 35- and 23-kDa species are predominant. Deletion of the initiator AUG of the K15 ORF abolished protein expression, suggesting that the 50-kDa form of K15 is a precursor which is subsequently proteolytically processed into smaller species. We demonstrate here that K15 is expressed in latently infected PEL cells and in the KSHV-infected plasmablasts in multicentric Castleman’s disease (MCD) (8). We show that the predominant endogenous K15 protein species in PEL cells is 23 kDa and that K15 localizes to the endoplasmic reticulum (ER) and mitochondria. As a first step to elucidate functions of K15, we show that K15 interacts in a yeast two-hybrid system, in in vitro glutathione-S-transferase (GST) pull down, and in in vivo coimmunoprecipitation assays with the HS1 associated protein X-1 (HAX-1). HAX-1 is implicated in modulating apoptosis and in actin cytoskeletal binding and motility functions (11, 44, 49). Therefore, K15 may modulate any one of these cellular processes via its interaction with HAX-1.
MATERIALS AND METHODS
Plasmids.
KSHV K15 cDNA was cloned by reverse transcriptase PCR followed by nested PCR. Total RNA from the PEL cell line BC3 was extracted using the total RNA isolation kit from Qiagen (Crawley, United Kingdom). Total RNA (1 μg) was reverse transcribed using Superscript II RT (Gibco-BRL, Paisley, United Kingdom) and the KSHV 3′ primer 5′-GAGATCACTCTCCAA-3′ in a total reaction volume of 50 μl and incubated at 42°C for 20 min. A 5-μl aliquot of this cDNA was then used for nested PCR with K15 (P) 5′-specific primer 5′-PO4-ATGAAGACACTCATATTCTTCTG-3′ (predicted start codon underlined) and the 3′-specific primer 5′-GTGGTCGTGGAGGGCTAGTTCCTGGG-3′ (predicted stop codon in boldface type) with Expand high fidelity Taq polymerase (Roche Diagnostics, Mannheim, Germany) in a total reaction volume of 50 μl. The resulting 1.4-kb DNA fragment product was agarose gel purified and then cloned with a Unidirectional TA cloning kit (Invitrogen, Groningen, The Netherlands) into the eukaryotic expression vector pCR3.1-Uni (Invitrogen) to express the eight-exon P form of K15 (5, 12, 39).
pGEX6P-1-K15-CT was used to produce recombinant GSH-K15-CT protein (see below) and was constructed as follows. The region of cDNA encoding amino acids (aa) 345 to 489 was PCR amplified from the full-length K15 wild type previously cloned (see above) using the 5′ primer 5′-CGCGGATCCTATTTATATAAGGAAAAAAAAGTGGTGGCTG-3′ to incorporate a BamHI site (underlined) and the 3′ primer 5′-TAGAAGGCACAGTCGAG-3′, specific for pCR3.1, 3′ downstream from where K15 was cloned into the vector. The PCR product was purified and restriction enzyme digested with BamHI and XhoI and ligated in frame into similarly cut pGEX6P-1 vector (Amersham Pharmacia Biotech, Amersham, United Kingdom).
pAS2.1-K15-CT was created by PCR amplification of the C-terminal 144-aa cytoplasmic portion of K15 (K15-CT) from pCR3.1-K15 using the 5′ primer 5′-GCATGCCATGGCGTATTTATATAAGGAAAAAAAAGTGGTGGCTG-3′ and the pCR3.1 reverse primer (Stratagene, Amsterdam, The Netherlands). This PCR product was then digested with NcoI and EcoRI, ligated into similarly cut pAS2.1 vector to create a GAL4 DNA binding domain (GAL4BD)-K15-CT fusion protein, and used for yeast two-hybrid screening.
The deletion and point mutations created in pAS2.1-K15-CT, pCR3.1-K15, and pGEX6-1-K15-CT were created using the QuickChange mutagenesis kit (Stratagene) as per the manufacturer’s instructions and with the following mutation primer pairs (5′ and 3′ primers, respectively): for Δ387–390, CCACCTTGGCAATAATGTAATTAGCCCTCCTTTTTTTAGACAGCCTGTTAGGTTACC and GGTAACCTAACAGGCTGTCTAAAAAAAGGAGGGCTAATTACATTATTGCCAAGGTGG; for Δ431–435, GTGAATAGGGACCCACCCAATGTATTCGGGGTGTCCGGTGCGGAAGAATCACGTGAACC and GGTTCACGTGATTCTTCCGCACCGGACACCCCGAATACATTGGGTGGGTCCCTATTCAC; for Δ451–455, CGGAAGAATCACGTGAACCATCACCACAGCCAGACATTTTAAGGGTTGATGGTGGGAGTGCCTTCCG and CGGAAGGCACTCCCACCATCAACCCTTAAAATGTCTGGCTGTGGTGATGGTTCACGTGATTCTTCCG; for Δ475–478, GCCTTCCGTATAGACACCGCCCAAGCCGCCACCGACCTGTATGAGGAGGTTTTATTTCCCAGG and CCTGGGAAATAAAACCTCCTCATACAGGTCGGTGGCGGCTTGGGCGGTGTCTATACGGAAGGC; for Δ481–485, CACCGCCCAAGCCGCCACCCAACCGACAGACGACCTGTTTCCCAGGAACTAGAAGCCGAATTCTGCAGATATCC and GGATATCTGCAGAATTCGGCTTCTAGTTCCTGGGAAACAGGTCGTCTGTCGGTTGGGTGGCGGCTTGGGCGGTG; for aa481Y→F, CCCAACCGACAGACGACCTGTTTGAGGAGGTTTTATTTCCCAGG and CCTGGGAAATAAAACCTCCTCAAACAGGTCGTCTGTCGGTTGGG.
The murine HAX-1-GST (GSH-HAX-1) fusion protein expression plasmid (pEBG/HAX-1fl) was kindly provided by Ralph Witzgall (Heidelberg, Germany).
Lentivirus expressing K15 construction, production, and infection.
In order to obtain pseudotyped lentivirus (recombinant human immunodeficiency virus type 1 with vesicular stomatitis virus G envelope protein) which expresses K15 we employed the gene delivery and production system developed by Naldini et al. (31). For K15 expression from the recombinant virus we first ligated the full-length K15 cDNA BamHI/XhoI fragment into similarly cut pHR-CMV vector (empty) to create pHR-CMV-K15 (Lenti-K15). Deletion of the first AUG was created by digestion of pHR-CMV-K15 with BamHI and ApaI and then blunt-end ligation to create pHR-CMV-K15ΔAUG (Lenti-K15ΔAUG).
For virus production, 293 T cells were seeded at 4 × 10⁶ cells in a 75-cm2 flask or 8 × 10⁶ cells in a 150-cm2 flask the previous day. At 15 min prior to cell transfection the media were changed (6 ml in a 75-cm2 flask or 12 ml in a 150-cm2 flask). For transfections, plasmids were mixed as follows. For mix 1 (based on a 150-cm2 flask) p8.9 (20 μg), pHR-K-15/empty (30 μg), and pVSV-G (10 μg) were made up to 1,400 μl with 150 mM NaCl. Polyethyleneimine (10 mM; 200 μl) and 1,200 μl of 150 mM NaCl (mix 2) were combined to make 1,400 μl. Mix 1 and mix 2 were combined with gentle shaking and incubated at 22°C for 15 min. The mixture was added into the 293T medium dropwise and incubated for 5 h at 37°C (5% CO2). The medium was changed (20 ml in a 150-cm2 flask), and virus was harvested 48 h later, followed by filtration through a 0.45-μm-pore-size filter. Filtered virus was centrifuged at 25,000 rpm in a Beckman SW28 rotor for 2 h at 4°C, medium was discarded, and virus was allowed to resuspend in endothelial growth medium (EGM-2)-10% fetal calf serum (FCS)-penicillin-streptomycin for 30 min on ice. Viruses were then stored at −80°C for long-term storage or 4°C for short-term storage.
Cell culture, transfection, and reporter assays.
Human embryonic kidney (HEK) 293 and HeLa cells were cultured in Dulbecco’s modified Eagle’s medium (Gibco-BRL) supplemented with 10% FCS, 2 mM glutamine, 50 IU of penicillin/ml, and 50 μg of streptomycin/ml. BC3, JSC-1, DG75, Raji, and Ramos cells were cultured in RPMI 1640 medium (Gibco-BRL) supplemented with 10% FCS, 50 IU of penicillin/ml, and 50 μg of streptomycin/ml in the presence of 5% CO2. The BCP-1 cell line was grown in the same manner but with 20% FCS. The endothelial cell line IE7 and primary human primary microvascular endothelial cells (HMVEC) were cultured in EGM-2 supplemented with 10% FCS, 50 IU of penicillin/ml, and 50 μg of streptomycin/ml (Clontics). For transient transfections, 8 × 10⁵ HEK 293 or HeLa cells were plated in a 25-cm2 flask and the following day were transfected by using a standard calcium phosphate technique.
Yeast two-hybrid screen.
The C-terminal portion of K15 (P) was amplified by PCR and cloned into the pAS2.1 bait vector as described above. The resulting plasmid (pAS2.1-K15-CT) was pretransformed into the Saccharomyces cerevisiae PJ69-4a (MATa trp1-90 leu2-3,112 ura3-52 his3-200 gal4Δ gal80Δ LYS2::GAL1-HIS3 GAL2-ADE2 met2::GAL7-lacZ) (17) reporter strain using a modified lithium acetate protocol (see protocol 01525; Elsevier’s Trends Journals Technical Tips Online, available at http://tto.trends.com). Subsequently, this strain was cotransformed with the BC3 cDNA library (produced using the Stratagene HybriZAP cDNA library kit) in the GAL4 DNA activation domain (GAL4AD) fusion “prey” vector. Selection for HIS3, and ADE2 reporter gene activation was performed on agar plates without histidine, adenine, leucine, or tryptophan (SD agar lacking Leu, Trp, His, and Ade) according to the Matchmaker protocol (BD Clontech, Basingstoke, United Kingdom). Colonies growing after ∼5 days at 30°C were screened for lacZ reporter gene activity by filter assays. Plasmids from positive clones were purified and transferred to E. coli KC8 by electroporation, and plated out onto M9 plates (without Leu, with 100 μg of ampicillin/ml) to isolate cDNA prey clones only (Matchmaker protocol [Clontech]). For checking specificity of interaction and submapping the interaction between K15-CT and HAX-1, constructs encoding positive or negative controls or distinct deletion mutants of K15-CT were cotransformed with GAL4AD-HAX-1 into PJ69-4a yeast cells plated onto SD plates (lacking Leu and Trp) and then restreaked onto SD plates (lacking Leu, Trp, His, and Ade) to select for interaction via HIS3 and ADE2 reporter gene activation. Only those yeasts that contain two fusion proteins that specifically interact were able to grow on selection medium lacking His and Ade. The p53 and simian virus 40 large T-antigen (SV40 LT) GAL4 fusion plasmids were included as positive controls.
β-Galactosidase assay.
The liquid β-galactosidase assays were performed by standard methods. Briefly, 5 ml of a mid-exponential-phase liquid culture of yeast was centrifuged and resuspended in 500 μl of β-galactosidase buffer. Chloroform (40 μl) was added, and the cells were vortexed for 1 min. Then, 250 μl of β-galactosidase assay buffer complemented with ortho-nitro-phenol-galactopyranoside (4 mg/ml) was added. The incubation took place at 37°C, and activity was measured by optical density at 420 nm divided by time of incubation and number of cells.
Generation of recombinant GSH-K15-CT fusion protein.
aa 345 to 489 of K15, which contain the amino acids encoding the predicted cytoplasmic carboxyl terminus, were expressed as a recombinant GST fusion protein from the pGEX6P-1-K15-CT plasmid. Mid-log-phase Escherichia coli (BL21 DE3 pLysS) cells (800 ml) expressing the recombinant GSH-K15-CT were harvested, and cell extracts were produced by resuspension of cells in 20 ml of phosphate-buffered saline (PBS) containing protease inhibitors (leupeptin, 1 μM; pepstatin, 1 μM; phenylmethylsulfonyl fluoride, 1 mM; aprotinin, 0.3 μM). The cell suspension was freeze-thawed twice and incubated with lysozyme (200 μg/ml) at 4°C for 30 min with rotation. The extract was then sonicated twice for 2 min and made to 1% Nonidet P-40 (NP-40) and incubated at room temperature (22°C) for 30 min. After centrifugation at 12,000 × g for 30 min, 600 μl of a 50% glutathione bead slurry was added to the 20 ml of supernatant and incubated for 1 h at 4°C. The beads were washed twice in PBS followed by washing once in PreScission Protease cleavage buffer (50 mM Tris-HCl, pH 7.0; 150 mM EDTA; 1 mM dithiothreitol) and resuspended in 300 μl of cleavage buffer. PreScission Protease (Amersham Pharmacia Biotech) was added to beads at a final concentration of 80 U/ml and incubated at 4°C for 4 h with rotation. This step cleaved the K15-CT from the GST bound to beads and released the K15-CT into the supernatant. This produced highly purified K15-CT protein in the supernatant, with which we produced anti-K15 MAbs.
Anti-K15 MAb production and purification.
BALB/c mice were immunized with 25 μg of K15-CT in RAS adjuvant (Sigma) subcutaneously at two sites. One month later they received boosters with 25 μg of K15-CT in RAS adjuvant intraperitoneally. Ten days later test bleeds were taken and analyzed by enzyme-linked immunosorbent assay (ELISA) and Western blotting with the recombinant GST-K15 fusion protein. Four days prior to fusion the chosen mouse was injected intravenously with 100 μg of K15-CT recombinant protein in saline. Three days prior to fusion 50 μg of K15-CT in saline was injected intraperitoneally. MAb-secreting hybridomas were produced by fusing mouse spleen cells with the mouse myeloma cell line X63-Ag8.653. Hybridomas were initially identified by ELISA followed by Western blotting with recombinant K15-CT protein. Cell lines of interest were cloned by limiting dilution, retested for a positive and specific signal, and then scaled up for affinity purification. The anti-K15 MAbs 3B5/D7 and IF3/A10 were purified from culture medium supernatant (500 ml) using the HiTrap Protein G HP (1-ml column; Amersham Pharmacia Biotech). Briefly, once the supernatant had been applied to the column it was washed with 20 mM sodium phosphate binding buffer, pH 7.0, and then eluted with 0.1 M glycine-HCl, pH 2.7. The flow rate was 1 ml per min. Peak fractions were pooled, dialyzed, concentrated, and then made to 20% glycerol-0.02% sodium azide ready for use.
Immunoblots.
Unless otherwise stated, cells were harvested and lysed with RIPA lysis buffer (150 mM NaCl, 1% IGEPAL CA-630, 0.5% sodium deoxycholate, 0.1% sodium dodecyl sulfate [SDS], 50 mM Tris [pH 8.0]) containing protease inhibitors (leupeptin, aprotinin, phenylmethylsulfonyl fluoride, and bestatin). Lysates were incubated on ice for 15 min and then centrifuged at 13,000 rpm and 4°C for 5 min to remove debris. Polypeptides corresponding to 105 cells were resolved by SDS-15% polyacrylamide gel electrophoresis (SDS-15% PAGE) (unless otherwise stated) and transferred to Hybond-P membrane (Amersham Pharmacia Biotech) by standard semidry electrotransfer methods. The membrane was then blocked with blocking reagent (PBS, 0.1% Tween 20, 5% nonfat dry milk) for 30 min and then probed with the indicated primary antibody (in blocking reagent) overnight at 4°C. Blots were washed three times (20 min each) in 1× PBS with 0.1% Tween (PBS-T) and then incubated for 1 h at 22°C with the indicated secondary horseradish peroxidase-conjugated antibody, followed by further washing and then enhanced chemiluminescence (ECL) (Amersham Pharmacia Biotech).
Immunohistochemistry.
PEL and control cells from Burkitt’s lymphoma cell lines were fixed in 3% paraformaldehyde for 10 min and immersed in 0.2% Triton X-100 for 5 min. Cells were separately stained for K15 with a mouse MAb (clone IF3/A10; 1/50 dilution) and for HAX-1 (1/30 dilution) followed by biotinylated rabbit anti-mouse antibody and peroxidase-conjugated avidin. The staining was finally visualized with diaminobenzidine tetrahydrochloride and briefly counterstained with hematoxylin. Consecutive frozen sections of a KSHV-positive plasmablastic lymphoma, from a patient with MCD, were similarly stained with the K15 antibody (1/30 dilution) and LNA-1 (LN53; 1/1500 dilution).
Coimmunoprecipitation.
BC3 cell extracts (500 μl) prepared as described above in RIPA lysis buffer were incubated with 5 μg of anti-K15 MAb (3B5/D7) or the isotype control (immunoglobulin G1 [IgG1]) for 1 h at 4°C with rotation. Protein G beads (50:50 slurry) were added and further incubated at 4°C with rotation for 3 h. Beads were washed extensively in RIPA buffer and protein denatured by the addition of 25 μl of 2× SDS-PAGE sample buffer. Proteins were separated by SDS-15% PAGE and Western blotted with the indicated primary antibody.
GST pull down binding assays.
E. coli cell extracts (100 μl) containing the indicated GST fusion protein were incubated with 50 μl of glutathione beads (50:50 slurry) plus 400 μl of RIPA cell lysis buffer and then incubated at 4°C for 1 h with rotation. Beads were then washed extensively in RIPA buffer. When more than one protein was being assayed for binding (as in the case with the K15 mutants), 5 μl of each bead slurry was resuspended in 1× SDS-PAGE loading buffer separated by SDS-PAGE and then stained with Coomassie blue to ensure equal loading of each protein to beads. Beads with protein bound were incubated with 100 to 200 μl of the indicated cell extract and made up to 500 μl with RIPA. The binding reaction mixtures were incubated at 4°C for 2 h with rotation, washed as before, resuspended in 25 ml of 2× SDS-sample buffer heated to 95°C for 3 min, and separated by SDS-PAGE and Western blotted as indicated.
Immunofluorescence.
HeLa cells were used for indirect immunofluorescence assays. Briefly, HeLa cells transfected with the indicated expression plasmids were washed three times with ice-cold PBS and fixed with −20°C cold methanol-acetone (1:1) for 20 min. Cells were washed three times with ice-cold PBS and incubated at 22°C with blocking buffer (PBS with 3% bovine serum albumin, 1 mM CaCl2, and MgCl2). Cells were then washed with wash buffer (1:10 dilution in 1× PBS with 1 mM CaCl2 and MgCl2) and incubated with primary antibody in wash buffer for 60 to 120 min at 22°C. Cells were washed again with wash buffer and incubated with the indicated secondary antibody at 22°C, washed as before, and then mounted on slides with 20 μl of glycerol. Images of localized or colocalized proteins were obtained using confocal laser scanning microscopy. ER staining for indirect immunofluorescence assays was performed by incubating fixed cells with the ER-specific dye DiOC6 (3) (Molecular Probes Europe, Leiden, The Netherlands) for 10 min at 22°C.
Subcellular fractionation.
HeLa cells (107) were resuspended in 1 ml of RSB buffer (10 mM Tris-HCl, pH 7.4; 100 mM NaCl; 2.5 mM MgCl2) supplemented with digitonin (40 μg/ml) and incubated for 10 min at 4°C. Cells were then disrupted by passing through a 25-gauge needle and centrifuged at 900 × g (3,000 rpm) for 10 min at 4°C. While the supernatant (S1) was kept on ice, the pellet containing the nuclei was resuspended in RSB buffer, sonicated, layered onto 30% (wt/vol) sucrose, and centrifuged at 1,200 × g (13,000 rpm) for 15 min at 4°C. The resulting pellet contained insoluble chromatin, nucleoli, and other insoluble material, whereas the material overlaying the sucrose cushion corresponded to the nucleoplasmic fraction. To prepare other subcellular fractions, the S1 fraction was centrifuged at 14,000 × g for 15 min at 4°C to give a pellet, which contained mitochondria, peroxisomes, and lysosomes (M). The supernatant underwent further centrifugation at 100,000 × g for 60 min at 4°C to give the ER-microsomal (pellet) (ER) and cytoplasmic (supernatant) (C) fractions. All fractions were finally adjusted to the same volume with RSB 100 buffer, aliquoted, and stored at −80°C until further use.
Apoptosis assay.
HeLa cells (4 × 10⁵) were transfected with the indicated expression plasmids and incubated at 37°C for 48 h. To measure mitochondrial transmembrane potential, HeLa cells were incubated with 500 μM CMXRosamine (CMXRos; Molecular Probes, Eugene, Oreg.) added to the culture media at 37°C for 30 min and detached using trypsin. Treated cells were washed once in PBS and then analyzed for fluorescence using FACScalibur flow cytometry together with the CellQuest software (Becton Dickinson, Franklin Lakes, N.J.). The numbers reported represent the average and standard deviation of at least three independent experiments.
Prediction of signal peptide and signal peptide cleavage sites.
In order to identify potential signal sequence/peptide we used the iPSORT program (http://psort.nibb.ac.jp/), which is a subcellular localization site predictor for N-terminal sorting signals. Given a protein sequence, it predicts whether the sequence contains a signal peptide (SP) or mitochondrial targeting peptide (mTP). For the prediction of signal peptidase cleavage sites within K15 we employed the SignalP V1.1 prediction program developed by Nielsen et al. (http://www.cbs.dtu.dk/services/SignalP/) (32, 33). For each sequence, SignalP will report the maximal C, S, and Y scores, and the mean S score between the N-terminal and the predicted cleavage site. These values are used to distinguish between signal peptides and nonsignal peptides. If the sequence is predicted to have a signal peptide, the cleavage site is predicted to be immediately before the position with the maximal Y score. The C score is the raw cleavage site score, the S score is the signal peptide score, and the Y score is the combined cleavage site score. The prediction of cleavage site location is optimized by observing where the C score is high and the S score changes from a high to a low value. The Y score formalizes this by combining the height of the C score with the slope of the S score. All three scores are averages of five networks trained on different partitions of the data.
RESULTS
Cloning and expression of K15 from the BC3 PEL cell line.
The cDNA encoding K15 was cloned from total RNA, isolated from a Ficoll-treated unstimulated PEL cell line BC3 using two gene-specific primers for the predominant (P) form of K15. Sequence analysis of 45 independent cDNA clones confirmed the isolation of full-length cDNA encoding the full eight-exon ORF for the P form of K15. Since gene-specific 5′ and 3′ primers were used for the initial reverse transcriptase PCR, only full-length clones were obtained and no splice variants, as previously reported, were isolated (5, 12).
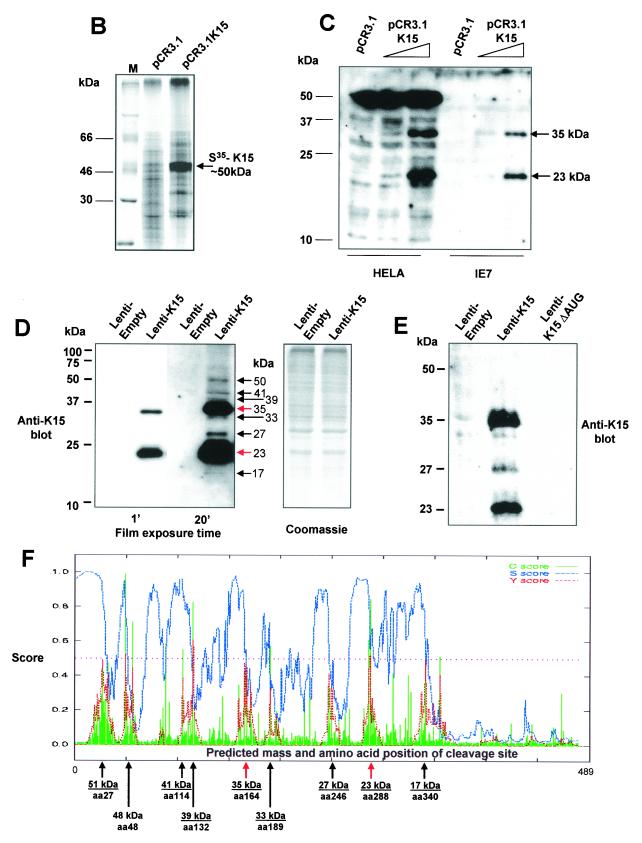
In vitro transcription and translation (TNT) of the K15 cDNA was performed in the presence of [35S]methionine (Fig. 1B). The vector pCR3.1, in which K15 was cloned, contains a T7 promoter for in vitro TNT in the Promega TNT Quick system. Figure 1B shows TNT with pCR3.1 vector only and pCR3.1K15 as indicated. Expression of the full-length (eight-exon) form of K15 migrates to around 50 kDa, which is close to its predicted size.
FIG. 1.
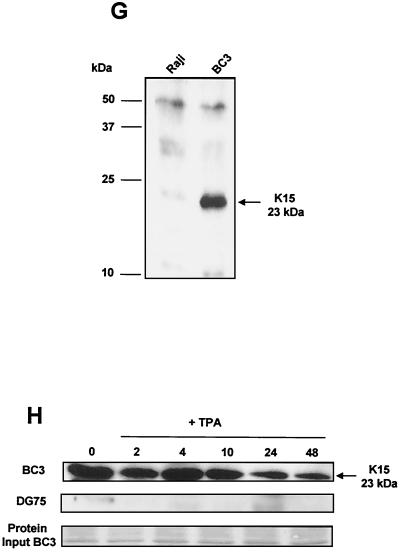
K15 expression analysis. (A) Sequence comparison of K15 C-terminal domain for the P and M forms. The predicted C-terminal cytoplasm domains of both the P and M forms of K15 are shown. Grey shading indicates identical amino acids. Dashed lines indicate amino acids deleted for mutational analysis (see below). Predicted SH2-B and SH3-B domains are indicated. The boxed region indicates putative mitochondrial targeting sequence. (B) In vitro TNT in the presence of [35S]methionine and pCR3.1 (vector only) or pCR3.1K15 as indicated. The full-length eight-exon form of K15 produces a protein of approximately 50 kDa. (C) HeLa and the endothelial cell line IE7 as indicated were transiently transfected with either vector-only control (pCR3.1) or full-length wild-type K15 (pCR3.1K15). The predominant protein sizes for K15 in all three cell types were 23 and 35 kDa. (D) Primary HMVEC were infected with lentivirus expressing K15 (Lenti-K15) and virus not expressing K15 (Lenti-empty [negative control]). Equal viral loads were determined by p24 ELISA (data not shown). Cell extracts were made 48 h postinfection and Western blotted with anti-K15 MAb (3B5/D7), developed using ECL, and exposed to autoradiographic film for the indicated times. The blot was subsequently stained with Coomassie blue to demonstrate equal protein input. (E) Infection of HMVEC with Lenti-empty, Lenti-K15, and Lenti-K15ΔAUG. At 48 h postinfection cell extracts were Western blotted with anti-K15 MAb. (F) Internal signal sequence cleavage site prediction for K15. For the prediction of cleavage sites within K15 we employed the SignalP V1.1 prediction program (see Materials and Methods). The arrows indicate amino acid positions of predicted cleavage sites and the molecular mass of the cleaved C-terminal protein product. Red arrows indicate those sites that most closely match the cleavage consensus sequence. (G) Endogenous expression of K15. Raji and BC3 (PEL) cell extracts equivalent to 105 cells were also subjected to SDS-15% PAGE and blotted for K15 with the 3B5/D7 MAb as described above. Positions of molecular mass markers are indicated at left. The predominant protein detected was 23 kDa. (H) K15 protein kinetics of expression following lytic cycle induction. BC3 and DG75 cells (6.0 × 10⁵) were treated with TPA (20 ng/ml). At the time points indicated 105 cells were harvested and lysed and subjected to SDS-PAGE and anti-K15 blotting as described above.
Full-length K15-encoded cDNA was then used to construct a GST-K15 carboxy terminal (last 144 aa) vector (GSH-K15-CT), which was used to produce MAbs as described in Materials and Methods.
Expression of K15 in vivo.
The eukaryotic expression vector pCR3.1 containing cDNA encoding the eight-exon P form of K15 was used to transfect HeLa and IE7 cells (Fig. 1C). Transfection of K15 cDNA into HeLa cells revealed the expression of two specific species of K15, which migrated at 35 and 23 kDa (Fig. 1C). The ratio of expression of these two species varied, but in general the 23-kDa form was present in greater amounts (Fig. 1C and D). Due to background cross-reactivity the predicted 50-kDa form of K15 could not be specifically detected in HeLa cells (Fig. 1C). Transfection of the same cDNA into the endothelial cell line IE7 again resulted in expression of the 35- and 23-kDa forms but without the 50-kDa cross-reactivity (Fig. 1C). However, we were still unable to detect the full-length K15. Because this endothelial cell line gave low background cross-reactivity in anti-K15 blots, we used endothelial cells in subsequent expression studies. To increase K15 expression and thus detect low-level-expressed K15 (such as the full-length version) we constructed a pseudotyped lentivirus which expressed K15 (see Materials and Methods) and which could be used to obtain >95% infection and expression in primary endothelial cells. HMVEC were chosen to be infected with this virus due to the absence of nonspecific cross-reactivity. At 48 h after infection cell extracts were produced and Western blotting was performed (Fig. 1D). Exposure of the blot with ECL to film for 1 min showed the expression of the characteristic 35- and 23-kDa forms with no cellular background or cross-reactivity (Fig. 1D). Development of the blot for 20 min revealed the expression of other forms of K15, including the predicted full-length size of 50 kDa (Fig. 1D). In order to show equal loading of samples the blot was subsequently stained with Coomassie blue (Fig. 1D).
We next examined the possible reasons for the expression of these different forms of K15. Two possible explanations can account for this. Firstly, the full-length 50-kDa form is made and then specifically cleaved to produce the other forms. Secondly, it is possible that there is internal initiation at one or more of the nine in-frame AUGs in the mRNA, which produces proteins of the indicated sizes (Fig. 1D). To test which of these models was correct we deleted the first 20 bp of the K15 cDNA, which encodes the initiating AUG but retains all other in-frame AUGs. Figure 1E shows no K15 expression upon deletion of the first AUG, indicating that the full-length 50-kDa form is required to be synthesized in order to produce the other species of K15 (Fig. 1E).
We next examined the amino acid sequence of K15 in order to determine whether any specific proteolytic cleavage motifs could be detected. Using the iPSORT program we identified a signal sequence in the first 30 aa of K15 (data not shown). This sequence may target K15 for specific cleavage in the ER. By contrast LMP1 and LMP2A of EBV do not possess a signal sequence under the same analysis (data not shown). Using the online SignalP program we were able to detect a tandem array of eight internally located signal sequences within the full-length K15 protein (Fig. 1F). Furthermore, the predicted molecular masses of these cleaved forms match those detected by Western blotting (compare molecular masses in Fig. 1D and F). Of the eight predicted signal sequences, those present at aa 148 to 167 and aa 265 to 290 show the closest match to the consensus signal sequence motif (data not shown) and would be predicted to produce proteins of 35 and 23 kDa, respectively (Fig. 1D and F). These data indicate that the full-length 50-kDa K15 is synthesized upon ectopic expression of full-length cDNA and is then specifically processed into small forms, of which the 35- and 23-kDa forms are predominant.
We next examined endogenous expression of K15 in KSHV positive PEL cells (Fig. 1G). In the PEL cell line BC3 there was a specific 23-kDa protein that was not present in the KSHV-negative cell line Raji (Fig. 1G). This 23-kDa protein was also observed in another PEL cell line, JSC-1, but not in the Ramos (KSHV-negative) control (data not shown).
In order to determine if the expression of K15 was latent, we treated the KSHV-positive PEL cell line BC3 and a KSHV-negative cell line (DG75) with the lysis-inducing agent 12-O-tetradecanoylphorbol-13-acetate (TPA) and harvested cells for Western blot analysis of K15 at the indicated time intervals (Fig. 1H). In the absence of TPA treatment, the 23-kDa species was detected (Fig. 1H). Upon addition of TPA, no overall change in the level of expression occurred over a period of 10 h (Fig. 1H), but a decrease in expression occurred at 24 and 48 h. The DG75 samples gave no positive signal with the anti-K15 MAb (Fig. 1H). Equal loading of BC3 protein for each sample is shown (Fig. 1H).
K15 in situ staining in KSHV-positive tumors.
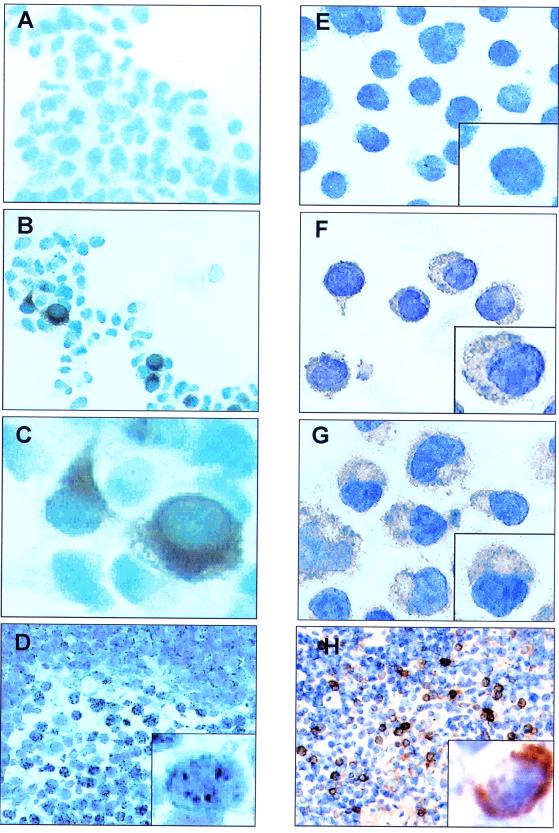
The eukaryotic expression vector pCR3.1 containing cDNA encoding the eight-exon P form of K15 was used to transiently transfect HEK 293 cells (Fig. 2A to C). Following transfection, expression of the wild-type K15 was examined via immunocytochemistry using the K15 specific MAb IF3/A10. Cells transfected with vector only (as a negative control) gave only background staining with this MAb (Fig. 2A). Cells transfected with K15 produced a strong staining pattern (Fig. 2B), which under higher magnification indicated localization within the cytoplasm and around the nuclear membrane (Fig. 2C).
FIG. 2.
Immunohistochemical staining for K15. HEK 293 cells were transfected with either pCR3.1 vector-only control (A) or the full-length eight-exon P form of K15 (B). (C) High-power (×100) magnification of panel B. Cells were then fixed and stained with the anti-K15 MAb 3B5/D7 (1:200). (E to G) K15 staining of KSHV-positive PEL cell lines BC3 (F) and JSC-1 (G) and negative control cell line Raji (E). (D) LNA-1 staining of plasmablasts in KSHV-associated MCD with characteristic nuclear stippling. (H) K15 staining of an adjacent section shows that all the plasmablasts also express K15 with characteristic cytoplasmic staining.
We next examined the in situ staining pattern of K15 in the KSHV-positive PEL cell lines BC3 and JSC-1 (Fig. 2F and G, respectively). The KSHV-negative cells (Raji) did not stain (Fig. 2E). In both the BC3 and JSC-1 cells there was specific staining for K15 in more than 95% of cells. The pattern of staining was similar to that seen by ectopic expression in 293 cells (Fig. 2C). We next stained adjacent sections of a plasmablastic lymphoma (8) from a patient with KSHV-positive MCD. All the plasmablasts were positive for LNA-1 (Fig. 2D and insert show typical nuclear stippling), and these positive cells were also positive for K15 in an adjacent section (Fig. 2H and insert show cytoplasmic staining).
Subcellular localization of K15.
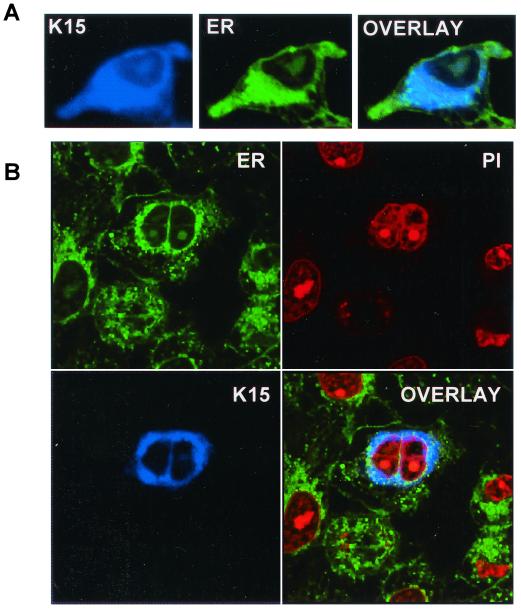
Because the initial immunocytochemical staining in 293 cells indicated possible ER subcellular localization we used the specific ER stain 3,5-dihexyloxacarbocyanide iodide [DiOC6 (3)] (3, 24, 42) in colocalization experiments (Fig. 3A). Figure 3B shows the same markers on a cell that has just undergone mitosis. The staining of the nucleus with propidium iodide was included as indicated (Fig. 3B). The overlay of K15 and ER staining shows that K15 is specifically localized to this organelle.
FIG. 3.
Localization of K15 to the ER. (A) HeLa cells grown on coverslips were transfected with expression vectors for K15. Cells were stained 48 h posttransfection as described in Materials and Methods. K15 was detected with the anti-K15 MAb (3B5/D7) followed by a goat anti-mouse IgG AMCA conjugate (DAKO). ER was detected with the specific dye DiOC6(3). (B) Staining of K15 and ER in transfected HeLa cells (as above) shows a cell that has undergone mitosis. This panel includes propidium iodide staining for the nucleus.
K15 interacts with HAX-1 in a yeast two-hybrid system.
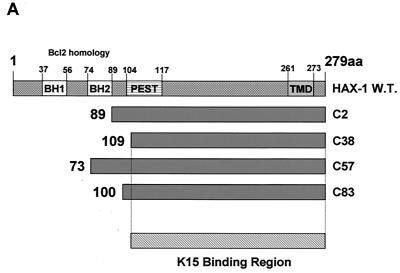
To identify possible K15 protein binding partners we used the yeast two-hybrid protein interactive screening method (10). Briefly, the yeast strain PJ69-4A was transformed with the pAS2.1-K15-CT vector, selected for expression by growth on medium without Trp, and Western blotted for expression of the GAL4BD-K15-CT fusion protein (data not shown). This strain was subsequently transformed with the BCP-1 or HeLa cDNA library in the GAL4AD fusion prey vector. Selection for HIS3 and ADE2 reporter gene activation was performed on agar plates without histidine, adenine, leucine, or tryptophan according to the Matchmaker protocol (BD Clontech). Colonies growing after ∼5 days at 30°C were screened for lacZ reporter gene activity by filter assays. Plasmids from positive clones were isolated and sequenced. The BCP-1 library screen (3.0 × 10⁶ CFU screened) identified three HAX-1 cDNAs, and the HeLa library screen (1.25 × 10⁶ CFU screened) identified one HAX-1 cDNA. All cDNAs were sequenced in both directions and completely matched the published sequence of human HAX-1 (44). Each of the HAX-1 cDNAs encodes a different N-terminal starting region with common overlapping C-terminal amino acid sequences as indicated (Fig. 4A). The diagrammatic alignment in Fig. 4A shows each of these four cDNAs (shown translated into amino acid sequence) in relation to the wild-type HAX-1 protein sequence. These overlapping proteins enabled us to determine that aa 1 to 109 are dispensable for K15 interaction and that the K15 binding domain is located within the C-terminal 170 aa of HAX-1 (Fig. 4A).
FIG. 4.
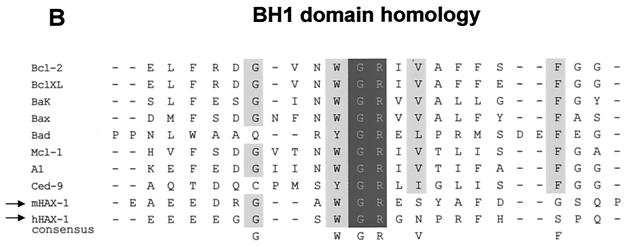
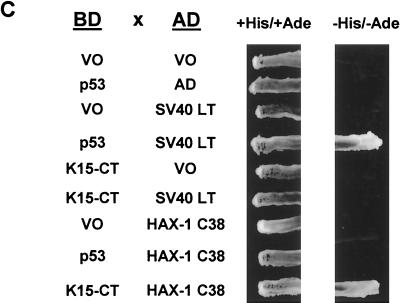
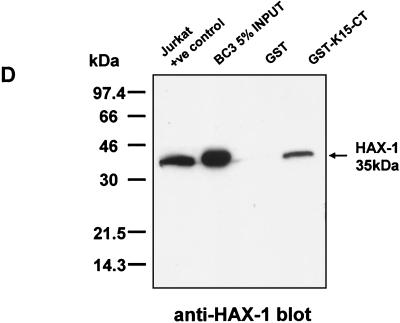
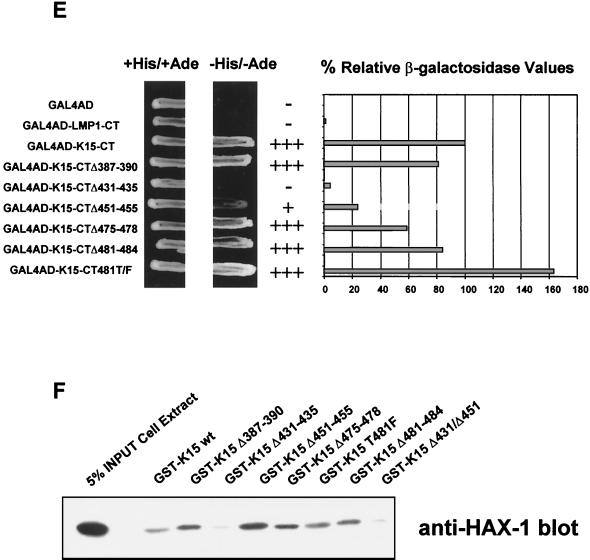
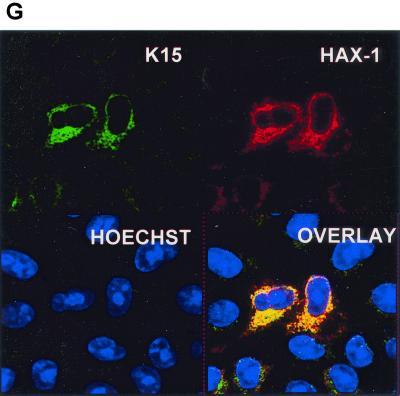
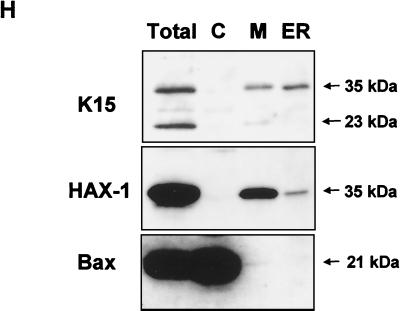
HAX-1 and K15 interaction. (A) Diagrammatic summary of HAX-1 cDNA clones obtained from yeast two-hybrid screens. Wild-type HAX-1 amino acid sequence and the regions of overlap with each of the HAX-1 clones (C2, 38, 57, and 83) obtained from the yeast two-hybrid screen are shown. Bcl-2 homology domains 1 and 2 (BH1 and -2) are indicated. W.T., wild type; TMD, transmembrane domain. (B) Alignment of the BH1 domain of Bcl-2 family members with human and murine HAX-1 (hHAX-1 and mHAX-1, respectively). Dark-grey-shaded areas indicate amino acid identity in all entries. Light-grey-shaded areas indicate amino acid identity in seven or more entries. (C) The specificity of the HAX-1-K15-CT interaction in the yeast two-hybrid assay was tested by combination of these two proteins with positive and negative controls and then assayed by prototrophy for histidine (His) and adenine (Ade). The indicated GAL4BD fusion (BD), GAL4AD (AD), or vector-only (VO) plasmids were cotransformed into yeast strain PJ69-4a. Growth on medium lacking His and Ade (−His/−Ade) is indicative of specific interactions. P53 and SV40-LT were included as a positive control. (D) HAX-1 binds GSH-K15-CT in vitro. BC3 cell extracts, which contain endogenous HAX-1, were incubated with GST or GST-K15-CT attached to glutathione-Sepharose beads as described in Materials and Methods. Specifically bound HAX-1 protein was eluted off beads with SDS-PAGE sample buffer and subjected to SDS-PAGE and then blotted with anti-HAX-1 MAb. (E) The yeast two-hybrid system was used to determine the region in K15-CT necessary for the interaction with HAX-1. The interaction was assayed for prototrophy for His and Ade and by a liquid β-galactosidase assay (β-galactosidase activity obtained with the wild-type GAL4-K15-CT fusion protein was set at 100%). GAL4BD-HAX-1 (C38) was transformed with the indicated GAL4AD-K15-CT mutants and replica plated onto selection media with His and Ade (+His/+Ade) or lacking His and Ade (−His/−Ade). As an extra control the C-terminal cytoplasmic domain of a related membrane protein (EBV LMP-1) was included. Growth on medium lacking His and Ade is indicative of specific interactions. (F) The GST pull down assay was used to confirm the yeast two-hybrid data. BC3 cell extracts, which contain endogenous HAX-1, were incubated with GST, GSH-K15-CT, or the indicated GST-K15-CT mutants attached to glutathione-Sepharose beads as described in Materials and Methods. Specifically bound HAX-1 protein was eluted off beads with SDS-PAGE sample buffer and subjected to SDS-PAGE and then blotted with anti-HAX-1 MAb. (G) Colocalization of K15 and HAX-1. HeLa cells grown on coverslips were cotransfected with expression vectors for K15 and GSH-mHAX-1. Cells were stained 48 h posttransfection as described in Materials and Methods. K15 was detected with the anti-K15 MAb (3B5/D7) followed by a goat anti-mouse IgG fluorescein isothiocyanate conjugate (DAKO). HAX-1 was detected with the rabbit anti-GST polyclonal followed by a donkey anti-rabbit IgG R-phycoerythrin conjugate. The cell nucleus was stained with Hoechst dye. Colocalization of the two proteins is seen upon overlay of the images. (H) Subcellular fractionation of HeLa cells transfected with K15 or expressing endogenous HAX-1 was analyzed. Both K15 and HAX-1 are detected in the ER and mitochondrial fractions. Bax is a cytoplasmic positive control and an ER negative control. Lane M, mitochondrial fraction; lane C, cytoplasmic fraction.
To check the specificity of this interaction in the yeast two-hybrid system, we transformed yeast with HAX-1 (cDNA C38) (Fig. 4A) and positive and negative control plasmids and then tested for growth on selective media (Fig. 4C). In this assay for histidine and adenine prototrophy no growth was observed for either K15-CT or HAX-1 when combined with vector-only controls or unrelated proteins (SV40 LT or p53) (Fig. 4C). Specific growth was seen only when HAX-1 and K15-CT were combined. The positive control p53 and SV40 LT interaction was also seen (Fig. 4C).
Further confirmation of the specificity of the HAX-1-K15-CT interaction was shown by the ability to pull down endogenous HAX-1 from BC3 cell extracts using the recombinant GSH-K15-CT (Fig. 4D). HAX-1 was specifically pulled down only in the presence of K15-CT and not by GST alone. These data also show that BC3 cells express HAX-1 protein at levels equivalent to that of the Jurkat cell extract positive control (Fig. 4D).
The conserved YASIL motif within the C terminus of K15 is required for HAX-1 interaction.
In order to specify the region within K15-CT required to interact with HAX-1 a series of deletion mutants was constructed at sites of high conservation between the P and M forms of K15 as indicated in Fig. 1 and was analyzed in both the yeast K15-CT expression vector and the GST-K15-CT vector (Fig. 4E and F). In the yeast two-hybrid assay, deletion of the YASIL motif (K15-CTΔ431-435) caused a loss of ability of yeast to grow in selective media lacking histidine and adenine compared to K15 wild-type/HAX-1 control (Fig. 4E). Furthermore, there was a 95% reduction of relative β-galactosidase reporter with this K15 deletion mutant (Fig. 4E). Thus, the YASIL motif is critical for the ability of K15 to interact with HAX-1. The deletion mutant K15-CTΔ451–455 (amino acids QSGM) showed a reduction in its ability to grow on selective media and had an approximately 80% reduction of relative β-galactosidase values (Fig. 4E). All GAL4BD-K15 fusion proteins were expressed to equal levels in yeast, as determined by Western blotting with an anti-GAL4BD MAb (data not shown). As a negative control we tested the GAL4BD LMP1 C-terminal fusion with HAX-1 and could detect no interaction in the yeast two-hybrid system. To confirm these findings, a GST pull down assay using each of the indicated GST-K15-CT mutations was performed (Fig. 4F). Endogenous HAX-1 from BC3 cell extracts was pulled down with wild-type GSH-K15-CT and all the indicated mutants except Δ431–435 and the double deletion mutant Δ431/Δ451 (Δ431–435 and Δ451–455) (Fig. 4F). The Δ451–455 deletion on its own was still able to bind HAX-1 and to a greater extent than the wild-type K15. The reasons for this are unclear, but it is possible that conformational differences between the GST-K15-CT fusion in the in vitro assay and the GAL4BD-K15-CT fusion in the in vivo assays may account for this. Furthermore, it is possible that the yeast system is more sensitive to mutational changes than the GST fusion pull down assay. Although equal amounts of each GST-K15-CT mutant protein were present, this assay was utilized to determine qualitative differences in binding, not quantitative difference as in the yeast two-hybrid β-galactosidase data. Therefore, in this GST pull down binding assay the YASIL motif is the only critical region in the C terminus required for HAX-1 binding to K15 (Fig. 4F).
K15 colocalizes and associates with HAX-1 in vivo.
K15 and GST-HAX-1 were immunostained in cotransfected cells and examined by confocal laser scanning microscopy. In Fig. 4G we show that K15 and GSH-HAX-1 colocalize. To confirm this result, cell fractionation on similarly transfected HeLa cells showed that K15 and HAX-1 are present in the ER fraction (Fig. 4H). In addition, we also detected K15 and HAX-1 in the mitochondrial fraction (Fig. 4H). Both the 35- and 23-kDa forms of K15 were detected in the mitochondrial fraction, but only the 35-kDa form was detectable in the ER fraction (Fig. 4H). Bax was used as a control for cross contamination during fractionation, since it is a cytoplasmic protein that does not localize to the ER and is only present in the mitochondria of a few cells undergoing apoptosis (Fig. 4H).
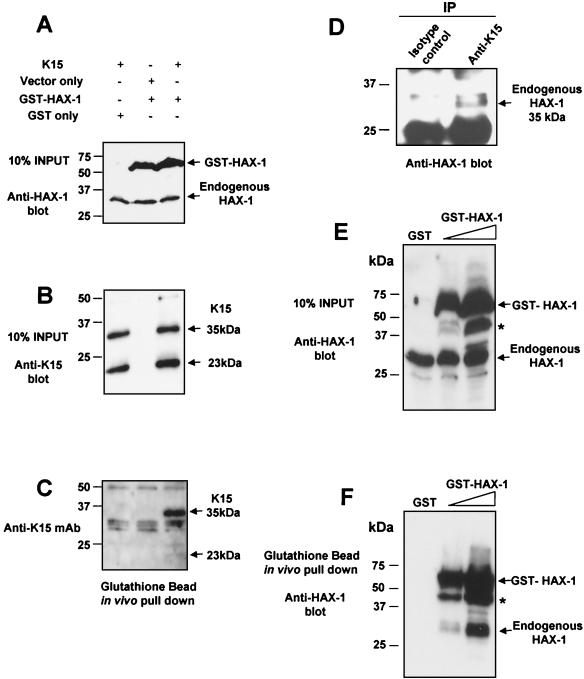
Due to the partial localization of K15 to the mitochondria we analyzed the amino acid sequence using the iPSORT online software and found a putative mitochondrial targeting peptide sequence from aa 345 to 374 (Fig. 1A). Further evidence that K15 and HAX-1 interact in vivo was provided by in vivo pull down experiments in transiently transfected HeLa cells expressing full-length wild-type K15 (P) and the GST murine full-length HAX-1 fusion protein. In vivo pull down of GSH-HAX-1 resulted in the coprecipitation of K15 (Fig. 5A to C). In addition, we performed an in vivo coimmunoprecipitation of endogenous K15 and HAX-1 from BC3 cell extracts (Fig. 5D). Cell extracts were immunoprecipitated with anti-K15 MAb (3B5/D7) and blotted for HAX-1. The input controls for K15 and HAX-1 are shown in Fig. 1G and 4D, respectively.
FIG. 5.
K15 and HAX-1 coprecipitate in vivo. HeLa cells were transiently transfected with the indicated combination of K15, GSH-HAX-1, or control expression vectors as indicated (A). Cell extracts were prepared as described in Materials and Methods, and then tested for expression of HAX-1 (A) and K15 (B) by Western blotting. (C) The same extracts were incubated with glutathione-Sepharose beads as described in Materials and Methods. Specifically bound GSH-HAX-1 protein was eluted off beads with SDS-PAGE sample buffer and subjected to SDS-PAGE and then blotted with anti-K15 MAb (3B5/D7). (D) Endogenous K15 and HAX-1 interact in vivo. Five micrograms of anti-K15 MAb and isotype control were incubated with 500 μl of BC3 cell extracts (prepared as described in Materials and Methods) at 4°C for 1 h with rotation. Fifty microliters of protein G (50:50 slurry) was then added and incubated for 2 h as before. Beads were washed extensively in RIPA buffer and then analyzed by Western blotting with anti-HAX-1 MAb. Input controls for K15 and HAX-1 expression in BC3 extracts have been shown (Fig. 1G and 4D, respectively). (E and F) HAX-1 forms homodimers in vivo. HeLa cells were transiently transfected with the indicated GST only or increasing concentrations of GSH-HAX-1 expression plasmid. Cell extracts were prepared as described in Materials and Methods and then checked for expression with the anti-HAX-1 MAb (H65220; Transduction Labs, Lexington, Ky.), which recognizes both human and mouse HAX-1 (E). Extracts were then incubated with glutathione-Sepharose beads as described in Materials and Methods. Specifically bound GSH-HAX-1 protein was eluted off beads with SDS-PAGE sample buffer and subjected to SDS-PAGE and then blotted with anti-HAX-1 MAb (F). Endogenous HAX-1 (35 kDa) coprecipitates in the presence of GSH-HAX-1 and not GST alone. An asterisk indicates the GSH-HAX-1 degradation product.
By virtue of the fact that the endogenous HAX-1 and GSH-HAX-1 were of different molecular weights, we were able to test for the ability of HAX-1 to homodimerize in vivo. Figure 5E and F shows that in vivo pull down with glutathione beads using HeLa cells transiently expressing GSH-HAX-1 also precipitated endogenous HAX-1 (35 kDa). Endogenous HAX-1 is not pulled down from cell extracts transfected with GST alone (Fig. 5E and F).
HAX-1 is a potent inhibitor of Bax-induced apoptosis.
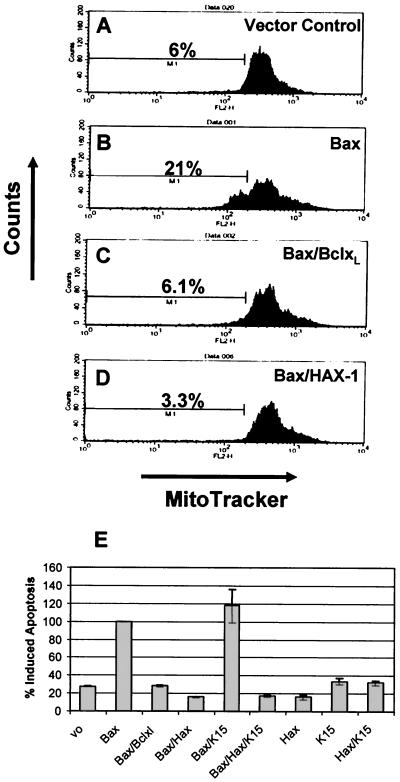
Suzuki et al. have previously reported that HAX-1 possesses homology to Bcl-2 and its family members within the BH1 domain (Fig. 4B) (44). We therefore investigated whether HAX-1 was able to block apoptosis induced by using Bax (a Bcl-2 family member with a strong proapoptotic function) in transient-transfection assays (Fig. 6). As a positive control Bcl-XL was cotransfected with Bax (Fig. 6C). In the presence of Bcl-XL, Bax-induced apoptosis was reduced to background levels (compare Fig. 6A and C). In the presence of HAX-1, Bax-induced apoptosis is also reduced to background levels (Fig. 6D). Transfection of vector only, HAX-1, or K15 alone did not induce apoptosis (Fig. 6E). To determine whether K15 had any effect on the ability of HAX-1 to inhibit apoptosis we cotransfected Bax, HAX-1, and K15 and compared this to Bax/HAX-1-transfected cells (Fig. 6E). K15 with HAX-1 had no positive or negative effect on HAX-1 blocking of Bax-induced apoptosis (Fig. 6E).
FIG. 6.
HAX-1 inhibits Bax-induced apoptosis. HeLa cells were transfected with the expression plasmids indicated in the top right portion of each panel. At 48 h posttransfection all cells, both adherent and in suspension, were pooled, washed, and stained with the mitochondrial membrane specific dye MitoTracker Red CMXRosamine (Molecular Probes, Leiden, The Netherlands) and analyzed by fluorescence-activated cell sorting. The percentage of apoptotic cells is indicated. (A to D) Fluorescence-activated cell sorter analysis of representative samples for each assay. (E) Summary of percent induced apoptosis for each of the indicated transfections. These data represent the average and standard deviations (error bars) of three independent experiments.
DISCUSSION
We have shown that the K15 protein of KSHV is latently expressed in all PEL cells tested and in KSHV-positive MCD by using a specific anti-K15 MAb. We demonstrated K15 expression in latently infected PEL cells by Western analysis (Fig. 1G and H) and in PEL cells and MCD by immunohistochemistry (Fig. 2). Other KSHV proteins that have been shown to be latently expressed in KSHV-related tumor cells include the latent nuclear antigen (LNA-1) encoded by ORF 73 (9, 34), viral cyclin (38), and viral FLIP (26). ORF K10.5, encoding an interferon-regulatory protein homologue (IRF-3) (40), and ORF K2, encoding the viral interleukin 6 (vIL6) homologue (28), are both expressed in some latently infected PEL and MCD cells, but not in KS spindle cells (35).
Latently expressed viral proteins are thought to play a direct role in the establishment and maintenance of proliferation of virus-induced cancer cells. In EBV-induced malignancies, a distinct latency program characterizes the different EBV-associated tumors. For example, LMP1 and LMP2A are expressed in nasopharyngeal carcinoma but not in Burkitt’s lymphoma (23). We were not able to demonstrate K15 protein expression in KS spindle cells. One explanation for this could be that the lower viral episome copy number in KS compared to those in PEL and MCD (25) results in undetectable expression levels of K15.
Western blot analysis of K15 expression in PEL cells in the absence and presence of TPA showed that K15 is expressed pretreatment and does not increase over time. In fact, we see a decrease of K15 at later time points, which is a TPA-induced expression pattern associated with latent (type I) herpesvirus proteins (Fig. 1H) (43). This is in contrast to previous reports of an increase in mRNA levels for K15 following TPA treatment by Northern blot and cDNA array analysis (5, 12, 18, 37). An explanation for the increase in mRNA levels, but no increase in protein level, could be that the K15 mRNA is under tight translational control.
Western blot analysis of K15 expressing cells revealed the presence of at least eight different species of K15, including the predicted full-length product of approximately 50 kDa (Fig. 1D) (5). The 35- and 23-kDa forms were predominant in ectopically expressed cells (Fig. 1C and D), and the 23-kDa form was predominant in endogenous BC3 (PEL) cells (Fig. 1G).
To address whether the smaller forms are produced by proteolytic processing of the full-length K15 or by internal initiation of the mRNA, we deleted the first initiator AUG. Upon this deletion no K15 expression was detected (Fig. 1E), indicating that the smaller species detected are produced from proteolytic processing of the full-length 50-kDa form and not by translation initiation from internal in-frame AUGs on the mRNA. It has been shown that a related protein, LMP1 of EBV, is proteolytically cleaved to produce a C-terminal protein of 25 kDa (29, 30). Our own computational analysis of LMP1 indicates that it possesses an internal signal sequence site at the junction between the membrane-spanning domain and cytoplasmic C terminus (aa 180) which upon cleavage would produce a C-terminal protein of 25 kDa (data not shown). We therefore analyzed K15 for predicted internal signal sequence peptidase cleavage sites (Fig. 1F). The predicted sizes found by this analysis match those detected by Western blotting (compare Fig. 1D and F). Of the internal signal sequences, two (aa 148 to 167 and aa 265 to 290) matched well to the consensus motif for cleavage (6, 46). Cleavage of K15 at these two sites would produce proteins of approximately 35 and 23 kDa, respectively (Fig. 1F). This could explain why these two species are predominantly expressed.
Previous reports have suggested that K15 localizes to the Golgi, perinuclear, and plasma membranes (5, 12). We showed here that K15 localizes to the ER and mitochondria (Fig. 3 and 4H). We found no colocalization of K15 with markers for the plasma membrane or Golgi (data not shown). A mitochondrial pattern of staining was not observed for K15, which may indicate that only those mitochondria in close proximity to the ER contain K15 and thus overlap with the ER-localized signal. LMP1 and LMP2A of EBV localize to the plasma membrane (20, 27), and their localization is therefore different from that of K15, suggesting that the principle functions of K15 are distinct from these structurally related γ-herpesvirus latent membrane proteins.
The cellular circuits targeted by individual oncogenic viral proteins are often essential pathways involved in cell growth, signal transduction, and apoptosis. As a first step to understand potential functions of K15, we performed two separate yeast two-hybrid screens with the C terminus of K15 (aa 344 to 489). Both screens identified the HAX-1 protein as a highly specific binding partner to K15, and GST pull down assays confirmed this to be a specific interaction (Fig. 4C and D). Furthermore, we found that the YASIL conserved motif within K15, the HAX-1 interacting motif (HIM), and the C-terminal portion of HAX-1 are important for this association (Fig. 4E and F). Confirmation of the K15-HAX-1 interaction was shown by colocalization of the two proteins (Fig. 4G), by in vivo pull down assays (Fig. 5A to C), and by coimmunoprecipitation of endogenous K15 and HAX-1 (Fig. 5D).
HAX-1 was first identified as a protein that associates with hemopoietic specific protein 1 (HS1) (44). HS1 is thought to play a role in signal transduction in B cells: upon BCR cross-linking, HS1 is one of the earliest proteins to be tyrosine phosphorylated in a sequential process by the nonreceptor tyrosine kinases Syk and Lyn (41). Following this HS1 translocates to the nucleus where it induces apoptosis (48). The interaction of HAX-1 with HS1 suggests it plays a role in BCR-induced apoptosis. However, HAX-1 is ubiquitously expressed, indicating it may have other functional roles. Protein domain and motif analysis of HAX-1 show it to contain a PEST site at aa 104 to 117 and a putative hydrophobic transmembrane domain at aa 261 to 273 (Fig. 4A). In addition to these domains, HAX-1 shows limited sequence similarity to the apoptosis-related proteins Bcl-2 and Nip3 (44) (Fig. 4B). It has not been shown whether HAX-1 can block apoptosis. Here we provide evidence that HAX-1 is a potent inhibitor of apoptosis (Fig. 6). Furthermore, its ability to inhibit apoptosis was as efficient as, if not better than, that of Bcl-XL (Fig. 6) (1). Thus, HAX-1 is a ubiquitously expressed gene with antiapoptotic function. The ability of K15 to modulate this function of HAX-1 was also tested. In the assay used, K15 did not have any positive or negative effect with respect to the ability of HAX-1 to inhibit apoptosis (Fig. 6E). Possible explanations for this are that K15 via HAX-1 may regulate apoptosis in a Bax-independent process or that K15 sequesters HAX-1 to fulfill other functions.
In addition to HS1, HAX-1 also binds to cortactin (or EMS1). Cortactin is an HS1 family member that is also a tyrosine-phosphorylated F-actin binding protein, but unlike HS1, it is not restricted to cells of the hematopoietic lineage (11). Cortactin also interacts with the Arp2/3 complex and in so doing promotes actin polymerization and stabilization, which is important for the ability of the actin network to drive protrusion at the leading edge of motile cells (45, 47). Overexpression of cortactin leads to increased endothelial cell motility (15, 36). Further studies would show whether K15 regulates cellular motility or invasion by way of interaction with the HAX-1-cortactin-F-actin complex.
It is of note that HAX-1 also interacts with EBNA-LP and with the polycystic kidney disease gene product (PKD2) which is mutated in most patients with autosomal dominant polycystic kidney disease. EBNA-LP, a predominantly nuclear antigen, appears to bind and localize with HAX-1 in the cytoplasm, but the biological significance of this interaction remains to be elucidated (19). Because HAX-1 interacts with cortactin, the binding of PKD2 with HAX-1 is thought to implicate dysfunctional PKD2 in abnormal cytoskeletal elements leading to multiple cyst formation (11). In addition to this HAX-1 has recently been shown to bind the interleukin 1α N terminus where it is thought to play a role in motility and/or adhesion of cells (49).
In summary, by examining K15 protein expression in vivo and in situ we have shown K15 to be a latently expressed KSHV gene that is posttranslationally cleaved to produce predominant 35- and 23-kDa forms and that in vivo K15 is able to bind the ubiquitously expressed antiapoptotic protein HAX-1. We were unable to detect any ability of K15 to modulate the antiapoptotic function of HAX-1. However, since HAX-1 may have several functions other than antiapoptosis, K15 may regulate these in a fashion which is advantageous for maintaining viral latency or promoting growth and motility of the infected cell. Overall, the specific binding of KSHV K15 with HAX-1 infers a role for K15 in B-cell signaling and apoptosis and potentially in cell invasion and motility.
Acknowledgments
We thank Ralph Witzgall for providing the murine HAX-1-GST construct and Robin Weiss and Mary Collins for helpful discussions.
This work was supported by The Cancer Research Campaign.
REFERENCES
- 1.Boise, L. H., M. Gonzalez-Garcia, C. E. Postema, L. Ding, T. Lindsten, L. A. Turka, X. Mao, G. Nunez, and C. B. Thompson. 1993. bcl-x, a bcl-2-related gene that functions as a dominant regulator of apoptotic cell death. Cell 74:597–608. [DOI] [PubMed] [Google Scholar]
- 2.Boshoff, C., and Y. Chang. 2001. Kaposi’s sarcoma-associated herpesvirus: a new DNA tumor virus. Annu. Rev. Med. 52:453–470. [DOI] [PubMed] [Google Scholar]
- 3.Cahir-McFarland, E. D., D. M. Davidson, S. L. Schauer, J. Duong, and E. Kieff. 2000. NF-kappa B inhibition causes spontaneous apoptosis in Epstein-Barr virus-transformed lymphoblastoid cells. Proc. Natl. Acad. Sci. USA 97:6055–6060. [DOI] [PMC free article] [PubMed] [Google Scholar]
- 4.Choi, J., R. E. Means, B. Damania, and J. U. Jung. 2001. Molecular piracy of Kaposi’s sarcoma associated herpesvirus. Cytokine Growth Factor Rev. 12:245–257. [DOI] [PubMed] [Google Scholar]
- 5.Choi, J. K., B. S. Lee, S. N. Shim, M. Li, and J. U. Jung. 2000. Identification of the novel K15 gene at the rightmost end of the Kaposi’s sarcoma-associated herpesvirus genome. J. Virol. 74:436–446. [PMC free article] [PubMed] [Google Scholar]
- 6.Dalbey, R. E., and G. Von Heijne. 1992. Signal peptidases in prokaryotes and eukaryotes—a new protease family. Trends Biochem. Sci. 17:474–478. [DOI] [PubMed] [Google Scholar]
- 7.Damania, B., J. K. Choi, and J. U. Jung. 2000. Signaling activities of gammaherpesvirus membrane proteins. J. Virol. 74:1593–1601. [DOI] [PMC free article] [PubMed] [Google Scholar]
- 8.Dupin, N., T. L. Diss, P. Kellam, M. Tulliez, M. Q. Du, D. Sicard, R. A. Weiss, P. G. Isaacson, and C. Boshoff. 2000. HHV-8 is associated with a plasmablastic variant of Castleman disease that is linked to HHV-8-positive plasmablastic lymphoma. Blood 95:1406–1412. [PubMed] [Google Scholar]
- 9.Dupin, N., C. Fisher, P. Kellam, S. Ariad, M. Tulliez, N. Franck, E. van Marck, D. Salmon, I. Gorin, J. P. Escande, R. A. Weiss, K. Alitalo, and C. Boshoff. 1999. Distribution of human herpesvirus-8 latently infected cells in Kaposi’s sarcoma, multicentric Castleman’s disease, and primary effusion lymphoma. Proc. Natl. Acad. Sci. USA 96:4546–4551. [DOI] [PMC free article] [PubMed] [Google Scholar]
- 10.Fields, S., and O. Song. 1989. A novel genetic system to detect protein-protein interactions. Nature 340:245–246. [DOI] [PubMed] [Google Scholar]
- 11.Gallagher, A. R., A. Cedzich, N. Gretz, S. Somlo, and R. Witzgall. 2000. The polycystic kidney disease protein PKD2 interacts with Hax-1, a protein associated with the actin cytoskeleton. Proc. Natl. Acad. Sci. USA 97:4017–4022. [DOI] [PMC free article] [PubMed] [Google Scholar]
- 12.Glenn, M., L. Rainbow, F. Aurad, A. Davison, and T. F. Schulz. 1999. Identification of a spliced gene from Kaposi’s sarcoma-associated herpesvirus encoding a protein with similarities to latent membrane proteins 1 and 2A of Epstein-Barr virus. J. Virol. 73:6953–6963. [DOI] [PMC free article] [PubMed] [Google Scholar]
- 13.Hayward, G. S. 1999. KSHV strains: the origins and global spread of the virus. Semin. Cancer Biol. 9:187–199. [DOI] [PubMed] [Google Scholar]
- 14.Herndier, B., and D. Ganem. 2001. The biology of Kaposi’s sarcoma. Cancer Treat. Res. 104:89–126. [DOI] [PubMed] [Google Scholar]
- 15.Huang, C., J. Liu, C. C. Haudenschild, and X. Zhan. 1998. The role of tyrosine phosphorylation of cortactin in the locomotion of endothelial cells. J. Biol. Chem. 273:25770–25776. [DOI] [PubMed] [Google Scholar]
- 16.Huen, D. S., S. A. Henderson, D. Croom-Carter, and M. Rowe. 1995. The Epstein-Barr virus latent membrane protein-1 (LMP1) mediates activation of NF-kappa B and cell surface phenotype via two effector regions in its carboxy-terminal cytoplasmic domain. Oncogene 10:549–560. [PubMed] [Google Scholar]
- 17.James, P., J. Halladay, and E. A. Craig. 1996. Genomic libraries and a host strain designed for highly efficient two-hybrid selection in yeast. Genetics 144:1425–1436. [DOI] [PMC free article] [PubMed] [Google Scholar]
- 18.Jenner, R. G., M. M. Alba, C. Boshoff, and P. Kellam. 2001. Kaposi’s sarcoma-associated herpesvirus latent and lytic gene expression as revealed by DNA arrays. J. Virol. 75:891–902. [DOI] [PMC free article] [PubMed] [Google Scholar]
- 19.Kawaguchi, Y., K. Nakajima, M. Igarashi, T. Morita, M. Tanaka, M. Suzuki, A. Yokoyama, G. Matsuda, K. Kato, M. Kanamori, and K. Hirai. 2000. Interaction of Epstein-Barr virus nuclear antigen leader protein (EBNA-LP) with HS1-associated protein X-1: implication of cytoplasmic function of EBNA-LP. J. Virol. 74:10104–10111. [DOI] [PMC free article] [PubMed] [Google Scholar]
- 20.Kaye, K. M., K. M. Izumi, and E. Kieff. 1993. Epstein-Barr virus latent membrane protein 1 is essential for B-lymphocyte growth transformation. Proc. Natl. Acad. Sci. USA 90:9150–9154. [DOI] [PMC free article] [PubMed] [Google Scholar]
- 21.Kaye, K. M., K. M. Izumi, G. Mosialos, and E. Kieff. 1995. The Epstein-Barr virus LMP1 cytoplasmic carboxy terminus is essential for B-lymphocyte transformation; fibroblast cocultivation complements a critical function within the terminal 155 residues. J. Virol. 69:675–683. [DOI] [PMC free article] [PubMed] [Google Scholar]
- 22.Keller, S. A., E. J. Schattner, and E. Cesarman. 2000. Inhibition of NF-κB induces apoptosis of KSHV-infected primary effusion lymphoma cells. Blood 96:2537–2542. [PubMed] [Google Scholar]
- 23.Kieff, E. 1996. Epstein-Barr virus and its replication, p.2343–2396. In B. N. Fields, D. M. Knipe, and P. M. Howley (ed.), Fields virology. Lippincott, Philadelphia, Pa.
- 24.Korkotian, E., A. Schwarz, D. Pelled, G. Schwarzmann, M. Segal, and A. H. Futerman. 1999. Elevation of intracellular glucosylceramide levels results in an increase in endoplasmic reticulum density and in functional calcium stores in cultured neurons. J. Biol. Chem. 274:21673–21678. [DOI] [PubMed] [Google Scholar]
- 25.Lallemand, F., N. Desire, W. Rozenbaum, J. C. Nicolas, and V. Marechal. 2000. Quantitative analysis of human herpesvirus 8 viral load using a real-time PCR assay. J. Clin. Microbiol. 38:1404–1408. [DOI] [PMC free article] [PubMed] [Google Scholar]
- 26.Low, W., M. Harries, H. Ye, M. Q. Du, C. Boshoff, and M. Collins. 2001. Internal ribosome entry site regulates translation of Kaposi’s sarcoma-associated herpesvirus FLICE inhibitory protein. J. Virol. 75:2938–2945. [DOI] [PMC free article] [PubMed] [Google Scholar]
- 27.Miller, C. L., A. L. Burkhardt, J. H. Lee, B. Stealey, R. Longnecker, J. B. Bolen, and E. Kieff. 1995. Integral membrane protein 2 of Epstein-Barr virus regulates reactivation from latency through dominant negative effects on protein-tyrosine kinases. Immunity 2:155–166. [DOI] [PubMed] [Google Scholar]
- 28.Moore, P. S., C. Boshoff, R. A. Weiss, and Y. Chang. 1996. Molecular mimicry of human cytokine and cytokine response pathway genes by KSHV. Science 274:1739–1744. [DOI] [PubMed] [Google Scholar]
- 29.Moorthy, R., and D. A. Thorley-Lawson. 1990. Processing of the Epstein-Barr virus-encoded latent membrane protein p63/LMP. J. Virol. 64:829–837. [DOI] [PMC free article] [PubMed] [Google Scholar]
- 30.Moorthy, R. K., and D. A. Thorley-Lawson. 1993. Biochemical, genetic, and functional analyses of the phosphorylation sites on the Epstein-Barr virus-encoded oncogenic latent membrane protein LMP-1. J. Virol. 67:2637–2645. [DOI] [PMC free article] [PubMed] [Google Scholar]
- 31.Naldini, L., U. Blomer, P. Gallay, D. Ory, R. Mulligan, F. H. Gage, I. M. Verma, and D. Trono. 1996. In vivo gene delivery and stable transduction of nondividing cells by a lentiviral vector. Science 272:263–267. [DOI] [PubMed] [Google Scholar]
- 32.Nielsen, H., J. Engelbrecht, S. Brunak, and G. von Heijne. 1997. Identification of prokaryotic and eukaryotic signal peptides and prediction of their cleavage sites. Protein Eng. 10:1–6. [DOI] [PubMed] [Google Scholar]
- 33.Nielsen, H., J. Engelbrecht, S. Brunak, and G. von Heijne. 1997. A neural network method for identification of prokaryotic and eukaryotic signal peptides and prediction of their cleavage sites. Int. J. Neural Syst. 8:581–599. [DOI] [PubMed] [Google Scholar]
- 34.Parravicini, C., B. Chandran, M. Corbellino, E. Berti, M. Paulli, P. S. Moore, and Y. Chang. 2000. Differential viral protein expression in Kaposi’s sarcoma-associated herpesvirus-infected diseases: Kaposi’s sarcoma, primary effusion lymphoma, and multicentric Castleman’s disease. Am. J. Pathol. 156:743–749. [DOI] [PMC free article] [PubMed] [Google Scholar]
- 35.Parravicini, C., S. J. Olsen, M. Capra, F. Poli, G. Sirchia, S. J. Gao, E. Berti, A. Nocera, E. Rossi, G. Bestetti, M. Pizzuto, M. Galli, M. Moroni, P. S. Moore, and M. Corbellino. 1997. Risk of Kaposi’s sarcoma-associated herpes virus transmission from donor allografts among Italian posttransplant Kaposi’s sarcoma patients. Blood 90:2826–2829. [PubMed] [Google Scholar]
- 36.Patel, A. S., G. L. Schechter, W. J. Wasilenko, and K. D. Somers. 1998. Overexpression of EMS1/cortactin in NIH3T3 fibroblasts causes increased cell motility and invasion in vitro. Oncogene 16:3227–3232. [DOI] [PubMed] [Google Scholar]
- 37.Paulose-Murphy, M., N. K. Ha, C. Xiang, Y. Chen, L. Gillim, R. Yarchoan, P. Meltzer, M. Bittner, J. Trent, and S. Zeichner. 2001. Transcription program of human herpesvirus 8 (Kaposi’s sarcoma-associated herpesvirus). J. Virol. 75:4843–4853. [DOI] [PMC free article] [PubMed] [Google Scholar]
- 38.Platt, G. M., E. Cannell, M. E. Cuomo, S. Singh, and S. Mittnacht. 2000. Detection of the human herpesvirus 8-encoded cyclin protein in primary effusion lymphoma-derived cell lines. Virology 272:257–266. [DOI] [PubMed] [Google Scholar]
- 39.Poole, L. J., J. C. Zong, D. M. Ciufo, D. J. Alcendor, J. S. Cannon, R. Ambinder, J. M. Orenstein, M. S. Reitz, and G. S. Hayward. 1999. Comparison of genetic variability at multiple loci across the genomes of the major subtypes of Kaposi’s sarcoma-associated herpesvirus reveals evidence for recombination and for two distinct types of open reading frame K15 alleles at the right-hand end. J. Virol. 73:6646–6660. [DOI] [PMC free article] [PubMed] [Google Scholar]
- 40.Rivas, C., A. E. Thlick, C. Parravicini, P. S. Moore, and Y. Chang. 2001. Kaposi’s sarcoma-associated herpesvirus LANA2 is a B-cell-specific latent viral protein that inhibits p53. J. Virol. 75:429–438. [DOI] [PMC free article] [PubMed] [Google Scholar]
- 41.Ruzzene, M., A. M. Brunati, O. Marin, A. Donella-Deana, and L. A. Pinna. 1996. SH2 domains mediate the sequential phosphorylation of HS1 protein by p72syk and Src-related protein tyrosine kinases. Biochemistry 35:5327–5332. [DOI] [PubMed] [Google Scholar]
- 42.Sabnis, R. W., T. G. Deligeorgiev, M. N. Jachak, and T. S. Dalvi. 1997. DiOC6(3): a useful dye for staining the endoplasmic reticulum. Biotechnol. Histochem. 72:253–258. [DOI] [PubMed] [Google Scholar]
- 43.Sarid, R., S. J. Olsen, and P. S. Moore. 1999. Kaposi’s sarcoma-associated herpesvirus: epidemiology, virology, and molecular biology. Adv. Virus Res. 52:139–232. [DOI] [PubMed] [Google Scholar]
- 44.Suzuki, Y., C. Demoliere, D. Kitamura, H. Takeshita, U. Deuschle, and T. Watanabe. 1997. HAX-1, a novel intracellular protein, localized on mitochondria, directly associates with HS1, a substrate of Src family tyrosine kinases. J. Immunol. 158:2736–2744. [PubMed] [Google Scholar]
- 45.Uruno, T., J. Liu, P. Zhang, Y. Fan, C. Egile, R. Li, S. C. Mueller, and X. Zhan. 2001. Activation of Arp2/3 complex-mediated actin polymerization by cortactin. Nat. Cell Biol. 3:259–266. [DOI] [PubMed] [Google Scholar]
- 46.von Heijne, G. 1990. The signal peptide. J. Membr. Biol. 115:195–201. [DOI] [PubMed] [Google Scholar]
- 47.Weaver, A. M., A. V. Karginov, A. W. Kinley, S. A. Weed, Y. Li, J. T. Parsons, and J. A. Cooper. 2001. Cortactin promotes and stabilizes Arp2/3-induced actin filament network formation. Curr. Biol. 11:370–374. [DOI] [PubMed] [Google Scholar]
- 48.Yamanashi, Y., T. Fukuda, H. Nishizumi, T. Inazu, K. Higashi, D. Kitamura, T. Ishida, H. Yamamura, T. Watanabe, and T. Yamamoto. 1997. Role of tyrosine phosphorylation of HS1 in B cell antigen receptor-mediated apoptosis. J. Exp. Med. 185:1387–1392. [DOI] [PMC free article] [PubMed] [Google Scholar]
- 49.Yin, H., H. Morioka, C. A. Towle, M. Vidal, T. Watanabe, and L. Weissbach. 2001. Evidence that hax-1 is an interleukin-1alpha n-terminal binding protein. Cytokine 15:122–137. [DOI] [PubMed] [Google Scholar]


