Abstract
Alternative splicing is a prominent feature of higher eukaryotes. Understanding of the function of mRNA isoforms and the regulation of alternative splicing is a major challenge in the post-genomic era. The development of mRNA isoform sensitive microarrays, which requires precise splice-junction sequence information, is a promising approach. Despite the availability of a large number of mRNAs and ESTs in various databases and the efforts made to align transcript sequences to genomic sequences, existing alternative splicing databases do not offer adequate information in an appropriate format to aid in splicing array design. Here we describe our effort in constructing the Manually Annotated Alternatively Spliced Events (MAASE) database system, which is specifically designed to support splicing microarray applications. MAASE comprises two components: (1) a manual/computational annotation tool for the efficient extraction of critical sequence and functional information for alternative splicing events and (2) a user-friendly database of annotated events that allows convenient export of information to aid in microarray design and data analysis. We provide a detailed introduction and a step-by-step user guide to the MAASE database system to facilitate future large-scale annotation efforts, integration with other alternative splicing databases, and splicing array fabrication.
Keywords: alternative splicing, manual annotation, database, splicing array
INTRODUCTION
Sequencing of a large number of genomes, including fly, nematode, mouse, and human, reveals that, surprisingly, most genomes do not encode more than 30,000 genes (Lander et al. 2001; Waterston et al. 2002) and, thus, gene number does not correlate with the complexity and functional diversity of organisms. On the other hand, alignment of cloned mRNA and EST sequences to the genome indicates that a large number of genes in higher eukaryotic organisms express multiple alternatively spliced mRNA isoforms, which has the potential to dramatically increase the functional diversity of encoded gene products and allows mRNA isoforms to be differentially regulated in disparate biological processes. In humans, for instance, more than half of the genes are alternatively spliced (Croft et al. 2000; Lander et al. 2001; Modrek et al. 2001; Johnson et al. 2003), and many mRNA isoforms may have either distinct biological functions or may be differentially regulated in disparate cell types or during development (Thabard et al. 1999; Tomonaga et al. 2000; Dredge et al. 2001; Caceres and Kornblihtt 2002; Mankodi et al. 2002; Baelde et al. 2004; Jiang et al. 2004). Furthermore, numerous mRNA isoforms appear to be associated with, or contribute to, specific diseases (Beck et al. 1999; Cooper and Mattox 1997; Garcia-Blanco et al. 2004). Given the prevalence and functional diversity of mRNA isoforms, understanding of the mechanism and regulation of alternative splicing is a major goal of modern biological and biomedical research.
Traditional approaches to the study of alternative splicing have relied on detailed molecular dissection of specific model systems in order to define cis-acting elements and trans-acting factors involved in specific regulatory paradigms. More recently, microarray approaches have been adapted for large-scale analysis of alternative splicing. Microarray techniques are ideally suited for the detection of regulated splicing in large candidate pools and the identification of regulated splicing in biological contexts. The construction of splicing arrays requires sequence information uniquely associated with specific mRNA isoforms. To date, two isoform-sensitive microarray platforms have been described. The first platform probes individual spliced junctions, each of which is linked to a molecular barcode (or zipcode) for quantification on a universal barcode array (Yeakley et al. 2002). Another platform is based on the use of short oligonucleotides to detect exon-exon junctions (Clark et al. 2002; Johnson et al. 2003; Pan et al. 2004). Each platform has its advantages and disadvantages. For example, the barcoding approach is robust in both sensitivity and specificity; however the assay requires the synthesis of relatively long oligonucleotides. The exon-exon junctional oligonucleotide platform can be fabricated in high density and used for whole-genome analysis, but the strategy suffers from problems associated with probe specificity (i.e., half-hybridization).
These approaches have a common need for highly curated alternative splicing information to support array fabrication, data analysis, and data validation using independent approaches. Many alternative splicing databases have been developed; to name a few, ASDB (Dralyuk et al. 2000), ISIS (Croft et al. 2000), AsMamDB (Ji et al. 2001), PALS db (Huang et al. 2002), ASAP (Lee et al. 2003), EASED (Pospisil et al. 2004), and ASD (Thanaraj et al. 2004). Each database effort has contributed to our understanding of alternative splicing, but most of them were not specifically designed to enable experimentalists to efficiently extract precise splice junction information for microarray fabrication. Also, many of these databases were constructed purely computationally, thus lacking systematic manual curation. In constructing these databases, some level of heuristics had to be introduced, rendering many of them either heavily contaminated with low-quality EST sequences (if the heuristics were not strict enough) or lacking many mRNA isoforms (if the heuristics were too strict). Computationally derived databases also omit splicing information that can only be found in the literature. Most importantly, none of these databases were specially built to efficiently aid experimental approaches.
Due to the limitations of the existing databases, we have built the Manually Annotated Alternatively Spliced Events (MAASE) database system with experimentalists and splicing array platforms explicitly in mind (Zheng et al. 2004). Our goal is to provide a comprehensive tool for annotating and organizing sequence and functional information relevant to alternative splicing. In addition, MAASE is designed to allow convenient retrieval of curated sequence information for both theoretical and experimental purposes. Here we describe the MAASE database system in detail to facilitate its use in future annotation projects, to seek input from the splicing community for its refinement, to provide curated content for independent bioinformatic analysis, and to stimulate integration with other alternative splicing databases.
RESULTS AND DISCUSSION
Overview of database components and features
The MAASE database system comprises two main components: a manual/computational annotation tool for alternative splicing events and a user-friendly database of annotated events. The database is also linked to oligonucleotide design tools for splicing-array applications. In this communication, we present step-by-step procedures for the use of the annotation system, describe functional features of the database, and illustrate various ways for users to export sequence information for experimental and theoretical applications.
Overall, the MAASE database is designed to assist with splicing array applications, and it is not intended to be a one-stop shop detailing all potential isoforms derived from genome-mRNA and mRNA/EST comparison. This has been accomplished in previous efforts, one of which (PALS db, Huang et al. 2002) is integrated with our annotation system as a useful resource. The MAASE database is also not intended to be a comprehensive source of biological information of reported mRNA isoforms in the literature. Striking a balance between feasibility and consistency with our goals, we have included the following information in MAASE: (1) gene name, (2) literature references, (3) transcript sequences, (4) associated EST frequencies, (5) selected isoforms described only in the literature, (6) sequences surrounding splice junctions, and (7) splicing modes.
Currently, our focus is on mouse and human genes. Mouse genes were selected based on their deposition in the Swiss-Prot database (Gasteiger et al. 2003), and human genes were selected from our annotation effort directed toward a specific array project (prostate cancer). In addition, we included genes which show evidence of conserved splicing patterns between human and mouse (J.-H. Wang and M.Q. Zhang, pers. comm.).
The MAASE annotation system
Loading of a list of start IDs
To begin using the annotation system, one first creates a list of start IDs for genes of interest, formatted as a single-column text file. Start IDs consist of Swiss-Prot IDs or, if the Swiss-Prot ID is unavailable, a TrEMBL ID. If neither of these is available, an NCBI accession number may be used. This hierarchy of preference for start IDs corresponds to the information available in each entry. Swiss-Prot entries contain the most functional information about a specific gene. The more information that is available, the more comprehensive the automatic extraction of relevant gene information for the MAASE database becomes.
The next step is to go to the front page of MAASE (http://maase.genomics.purdue.edu) and sign in. A new user will have to register and create a username and password before logging in. After logging in, a page listing all existing projects (if any) will be displayed. A project consists of a group of genes (represented by start IDs) to be annotated. To begin a new project, users must provide a project name and upload the file of start IDs. For better manageability, we suggest that a project contain ~20 start IDs, although this is not required. If a project consists of more than 20 entries, users may separate them into multiple projects in order to conveniently follow the progress of individual projects. Users can also add new start IDs to an existing project by selecting the existing project and uploading a file of new start IDs.
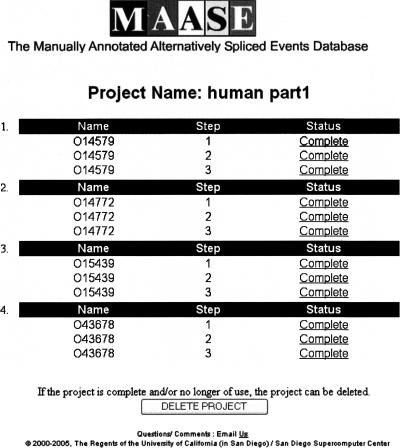
After uploading the start IDs, users are brought to the Progress Page for the project, which displays the annotation progress of each start ID (Fig. 1). The status of each start ID is shown as either: Queued (waiting to be processed), Processing (currently being processed), Complete, Need Information, or Error. An “Error” status arises when MAASE detects an error during processing or from user input. “Complete,” “Need Information,” and “Error” are hyper-links providing detailed information on the status and, if necessary, instructions on how to proceed. The annotation system controls the queuing of jobs and the allocation of resources to individual users. This prevents interference between users using the system at the same time, and allows for efficient parallel processing of jobs submitted by multiple users.
FIGURE 1.
Screen shot of the Progress Page. The Progress Page tracks the progress of each target ID in a project. There are five possible status messages: “Queued,” “Processing,” “Complete,” “Error,” and “Need Information.” The last three messages are Web links containing detailed information on how to proceed. Users are also able to delete a project within this page. At the completion of each step, users are automatically returned to the Progress Page.
The MAASE annotation process
The MAASE annotation tool was inspired by our early efforts at manually annotating alternative splicing events for splicing array experiments. Through this tedious exercise, we determined the information we desired from the annotation process (i.e., necessary information for the experiments), the annotation steps that could be automated, and the steps that we felt would be crucial to be maintained manually to accomplish the goal of obtaining highly curated information on alternative splicing. The annotation of each gene comprises three distinct steps. Each of the three steps includes both manual and computational aspects (Fig. 2).
FIGURE 2.
MAASE annotation stepwise flowchart. The annotation procedure consists of three automatic/manual steps. Step 1 is the identification of transcript sequences. Step 2 is the alignment of transcript sequences (part 1) and the determination of splicing mode(s) (part 2). Step 3 concludes with the deposition of annotated information into MAASE.
Step 1: Identification of sequences
This step consists of collecting general information about each gene and selecting potential transcript sequences. This step is divided into two parts: The first part is automated and the second part is manual. The automatic portion begins immediately after the uploading of the file of start IDs. The MAASE system automatically queues Step 1 for each start ID, which automatically retrieves information from multiple sources. First, MAASE retrieves general information about the gene. If the start ID is a Swiss-Prot ID or TrEMBL ID, MAASE queries the ExPASy database (Gasteiger et al. 2003) to retrieve the gene name, protein name, functional information, literature references, and NCBI cross-references in the form of NCBI accession numbers. MAASE then searches for potential transcript sequences by using the retrieved NCBI accession numbers to query NCBI for related sequences. If the start ID is an NCBI accession number, MAASE uses this directly to query NCBI for related sequences as well as to retrieve literature references from the NCBI entry. Querying NCBI for related sequences often results in many unwanted NCBI entries. Therefore, only the following are retained: sequences (1) from the same species, (2) on the same chromosome as the start ID, and (3) representing mRNA/EST sequences (thus excluding UTRs, contigs, individual exons, genomic DNA sequences, etc.). All collected information is written into a file, thereby completing the automated portion of Step 1.
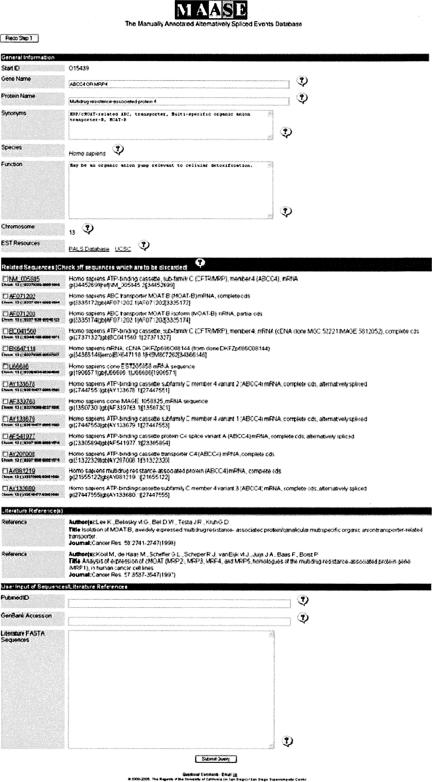
While MAASE is automatically collecting the information, the Progress Page displays a status of “Processing,” and when a job is complete, the status “Complete” is displayed. All processed information is then displayed to the user for inspection and manual intervention (Fig. 3). The displayed page has four sections: General Information, Related Sequences, Literature References, and User Input. “General Information” contains information such as gene name, protein name, functional information, chromosome number, and Web links to other mRNA and EST resources (i.e., PALS db and UCSC Genome Browser) to be used in the “User Input” section as described below. Most of the retrieved information in this section is displayed in text boxes allowing users to edit the information as needed. “Related Sequences” displays sequences retrieved from the NCBI-related sequence query described above. Users inspect and manually exclude irrelevant sequences (such as a transcript from a neighboring gene). Genomic information for each sequence is provided to aid users in identifying irrelevant sequences to be excluded during annotation. If it is difficult to decide whether a sequence should be eliminated, we recommend that the sequence be included, and if it does not align properly in Step 2, the sequence can then be excluded. “Literature References” contain literature references retrieved for the start ID. “User Input” allows users to add the following information in the provided text boxes. (1) Additional literature references as PubMed IDs. (2) Additional mRNA and EST sequences from external resources such as PALSdb (Huang et al. 2002) and the UCSC Genome Browser (Karolchik et al. 2003). PALSdb visually aligns Unigene cluster sequences to the longest cDNA of the cluster, color-coding the degree of similarity between the aligned sequences. Similarly, the UCSC Genome Browser displays known mRNAs and ESTs. Visual inspection of these pre-aligned sequences allows efficient identification of desired alternative transcripts to be included. Users may identify useful mRNA and EST sequences and simply copy their NCBI accession numbers into the corresponding text box. (3) Additional alternative splicing events found in the literature. Specific transcript sequences in FASTA format can be copied from the literature and pasted into the corresponding text box.
FIGURE 3.
Screen shot of automatically collected information from Step 1. This page is separated into four sections: General Information, Related Sequences, Literature References, and User Input. “General Information” contains descriptive information about the gene such as gene name, protein name, and gene function. The information is within text boxes to allow users to edit/add if needed. “Related Sequences” contains a list of transcript sequences retrieved from NCBI. Users are able to choose which sequences are to be included/excluded. “User Input” provides space for users to provide additional information such as more literature references, more transcript sequences (i.e., mRNAs or ESTs), and alternative splicing events only found in the literature.
Once all user inspection and/or input is complete, the information is submitted to MAASE by pressing “Submit” at the bottom of the page. Before MAASE queues Step 2, MAASE verifies the submitted sequences by checking that all sequences are on the same chromosome and on the same chromosome strand. MAASE also verifies that sequences copied from literature in “User Input” overlap the same genomic region as other selected sequences. If an error is flagged, a message will appear to advise users of potential solutions. Once Step 2 is successfully queued, both the automated and manual portions of Step 1 are complete.
Step 2, part 1: Alignment of mRNA sequences to genomic sequences
All transcript sequences compiled from the previous step are automatically aligned to the genomic sequence using BLAT (Kent 2002) and sim4 (Florea et al. 1998). BLAT is used to narrow down the genomic region, and sim4 is then used to create the gene model for each transcript. If MAASE is unable to align a sequence, an “Error” status will appear on the Progress Page. The “Error” status notifies users about the nature of the error and provides information on how to proceed (for example, a transcript from a related gene, which does not align properly with other transcripts, may have been accidentally included. In this case, users will be advised to remove it).
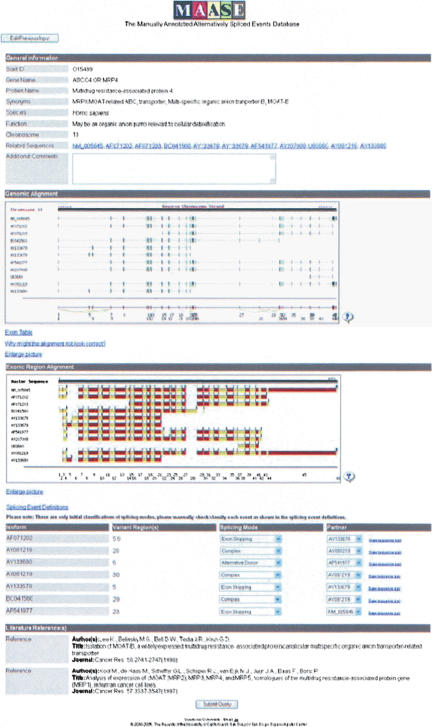
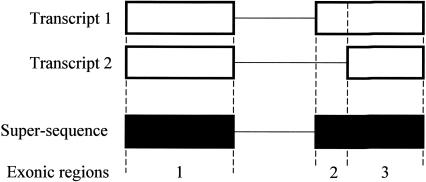
Once all sequences are aligned, MAASE makes an initial categorization of the location(s) and type(s) of alternative splicing event(s) present. When this computational portion of Step 2 is complete, MAASE will indicate this by showing “Complete” on the Progress Page. Clicking “Complete” will display the processed information (Fig. 4). Users can now begin the manual portion of Step 2. This output is once again divided into several sections: General Information, Global View, Exonic Region Alignment, Splicing Event(s), and Literature References. “General Information” displays information such as gene name and protein name, including user additions from the previous step, if any, and a text box for incorporating additional comments. “Global View” visually displays the alignment of each transcript sequence to the genomic sequence. The view can be enlarged to visualize small differences. Among the transcript sequences, a black line serves to partition those which are not yet deposited in the database (above the line) and those that are already deposited (below the line). This informs users of transcripts that have been annotated in previous efforts. At the bottom, displayed in red, is the representation of all unique exonic regions calculated by MAASE. Exonic regions are not necessarily whole exons, particularly when the exon is alternatively spliced. For example, alternative 3′ choices would result in an alternative portion and a common portion, which are indicated as separate exonic regions (Fig. 5), and the numbers listed below the superstring serve to identify distinct exonic regions. Exons are represented as boxes, introns are displayed as black lines, and alternative splicing events are indicated by yellow lines. Transcript(s) which do not align properly can be removed by clicking on the “Edit Previous Input” button to return to the previous step. Informational links are also provided, allowing users to display genomic coordinates of exon sequences, to obtain instructions for handling misaligned transcripts, and to enlarge the display, or to zoom in on alternatively spliced regions. “Exonic Region Alignment” displays the distinct exonic regions for each transcript sequence, using alternating colors to distinguish between neighboring exonic regions. As discussed above, exonic regions involved in alternative splicing may not always represent a full exon sequence. To highlight full exons, a blue bar and a black bar are used to indicate the beginning and the end of each full exon, respectively. This partition and alignment of exonic regions helps users focus on specific alternative events.
FIGURE 4.
Screen shot of processed information from Step 2. This page is separated into five sections: General Information, Global View, Exonic Region Alignment, Alternative Splicing Event, and Literature References. The “General Information” section contains information similar to that in Fig. 2, in addition to user additions (if any), a list of retained transcript sequences from Step 1, with Web links to their original database sources, and a text box for additional comments. The “Global View” section displays a graphical representation of each transcript sequence to the genomic sequence. The last sequence, depicted in red, is the super-sequence of all exonic regions. Alternative splicing events are indicated by yellow lines connecting different segments within the super-sequence. The “Exonic Region Alignment” section displays the presence of each exonic region in each transcript in alternating colors. The “Alternative Splicing Event(s)” section contains the identification and initial categorization of each internal alternative splicing event. Users are able to edit the information to refine the annotation.
FIGURE 5.
Construction of the super-sequence of exonic regions. Note that an exonic region involved in alternative splicing may represent an entire exon subject to inclusion or exclusion or a portion of an exon due to the use of alternative donors or acceptors.
Step 2, part 2: Determination of the splicing mode
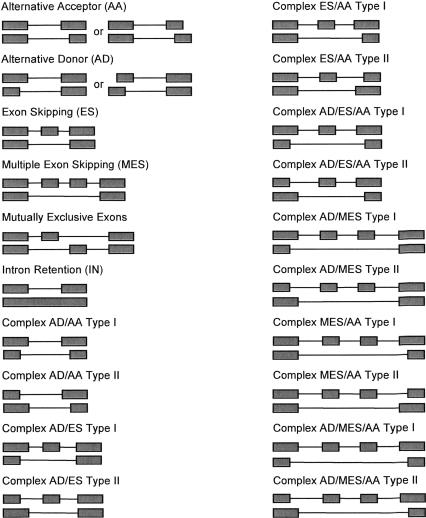
An important task in Step 2 is the determination of the splicing mode(s). We have encountered all conventional splicing modes, including alternative donor (AD), alternative acceptor (AA), exon skipping (ES), intron retention (IN), and mutually exclusive exons. We have also found many complex modes of splicing (Fig. 6), many of which are made up of distinctly paired splice sites, indicating mechanisms involved in coupled splice site selection. Each complex mode has been further categorized into two types. In essence, this classification describes the distribution of alternative regions between alternative transcripts, which facilitates computational determination of specific splicing modes. If all regions are present in one transcript, but missing in the other, it is Type I. If the regions are divided into two mutually exclusive parts, each of which is present in one of the alternative transcript, it is Type II.
FIGURE 6.
Systematic characterization of alternative splicing modes used in MAASE.
To computationally deduce the splicing mode, we first concatenate all exons from each transcript to construct a super-sequence of all exonic regions (Fig. 5). Each transcript is then compared to this super-sequence to identify the alternative region(s) within the transcript. The alternative region is next compared to the gene model of all other transcripts in a pairwise manner in search of partner sequences. The chosen partner sequences determine whether the difference is due to alternative donor, acceptor, skipped or retained intron, or skipped or retained exon(s). After MAASE makes the initial classification, the classification must be manually inspected and confirmed by users. The splicing mode and the partner sequence used for comparison can be modified using pull-down menus. Once the manual inspection of the splicing mode is complete, users can then submit the entered information into the database and queue Step 3.
Step 3: Deposition of annotated data into MAASE
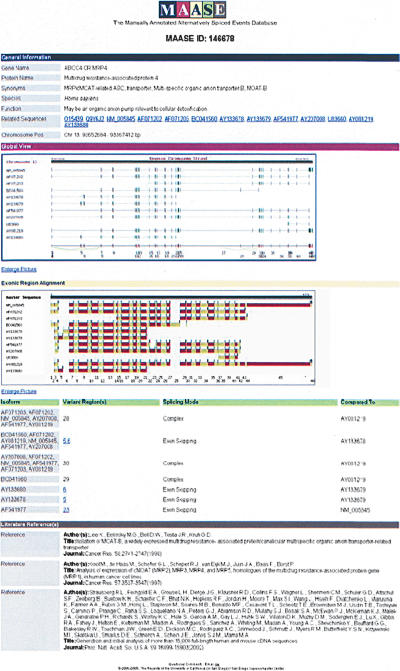
The last step is largely computational. First, all splicing-mode classifications are automatically verified by MAASE in Step 3. Manual intervention is occasionally needed if a splicing mode is misclassified. Users will be prompted to recheck the manually entered splicing mode to ensure the accuracy. After errors are corrected, all collected information is deposited in the database and the status “Complete” will show for the start ID on the Progress Page. After clicking on the hyperlink attached to the “Complete” status, a page summarizing all computationally and manually entered information is displayed (Fig. 7). All displayed information is organized and stored in the MAASE database.
FIGURE 7.
A gene entry in the database. This page has sections that are similar to those of the previous annotation steps: General Information, Global View, Alternative Splicing Event(s), and Literature References.
It should be emphasized that the page contains Web links throughout, allowing users to obtain more detailed information. For instance, within “Global View,” users have access to sequence information for each exon or intron, which is displayed in a separate window when individual regions are selected. Furthermore, under “Variant Region(s),” users can obtain detailed exon-exon junction sequence information at specific alternatively spliced junctions. In addition to the sequence information, MAASE provides two important features. One is the EST frequency associated with each junction, providing a rough estimate of the expression of that isoform. The EST frequency for a specific isoform corresponds to the percentage of transcripts containing the specific junction sequence in its UniGene cluster. The second feature is a tool to aid in oligonucleotide design for a particular splicing array strategy (see below for further details).
MAASE organization
Database schema
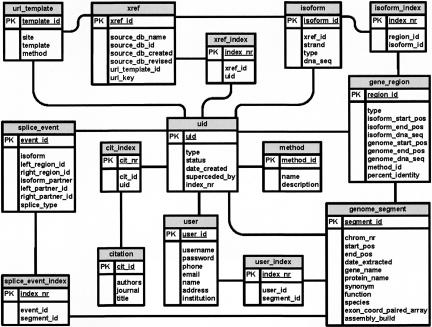
The MAASE database schema is star-like. The center of the star is the unique identifier [uid] table, which provides a central catalog of all entities in the database. Most tables are designed to capture important attributes of the biological units they represent. There are two main types of tables: (1) those that represent individual entities (i.e., gene locus, exon, intron, etc.) and (2) those that represent the relationships between entities (i.e., one-to-many, many-to-one, and many-to-many).
Tables for individual entities.
Each table contains the necessary information to define each biological entity (Fig. 8). For example, the table [genome_segment] contains information describing a gene locus, such as the gene name, protein name, functional information, species, and chromosome location information. The isoform entity is represented by two tables, [isoform] and [xref], which include the nucleotide sequences of individual isoforms and their original database source, respectively. The table [gene_region] stores the nucleotide sequences of each exon and intron and their genomic transcript positional coordinates. The [splice_event] table enumerates, for each splicing event, the specific transcript in which a particular splicing event is seen, the genomic positions, and the mode of splicing.
FIGURE 8.
MAASE database schema. For simplicity, all relationships from/to [uid] are not shown.
Tables for relating individual entities.
Cross-index tables are used to relate the individual entities to each other (Fig. 8). For example, the [xref_index] table is used to link each isoform sequence in [isoform] to its gene locus in [genomic_segment]; the [isoform_index] table links individual exon and intron sequences in [gene_region] to their respective isoform sequence in [isoform]; the [splice_event_index] table links individual splicing events in [splice_event] to each gene locus in [genome_segment]; and so forth.
Database updates.
The MAASE database can be updated with each new genomic assembly. During the updating process, each transcript is realigned to the new genomic assembly, resulting in new exon and intron transcript/genomic positional coordinates and, at times, new gene models. After the realignment of transcript sequences, the automatic/manual process of splicing mode(s) determination is repeated. Information from previous genomic assemblies is archived and available to users. The current human and mouse assembles used in MAASE are hg17 and mm5, respectively.
Data export from MAASE
The MAASE database currently has 1007 human and 1037 mouse genes. An up-to-date count of the number of genes and a count of alternative splicing events in various splicing modes can be found on the opening page under the “Database Content” section.
A search interface is provided to aid users to conveniently locate desired information within the database. The interface consists of a series of pull-down menus allowing users to specify (1) species (MAASE currently contains annotated information for mouse and human genes, but any number of species can be added); (2) query type (i.e., “Individual Entries,” “Alternatively Spliced Junctions,” “Alternative Exons,” etc.); (3) splicing mode; and (4) search mode (which allow users to specify genes of interest in various ways: gene name, protein name, keyword, NCBI accession number, Swiss-Prot ID, and MAASE ID). Once a specific search mode is chosen, search terms can be entered in the provided text box. After submitting the specified search criteria, a summary page of the retrieved gene entries is provided. At this step, the search can be further refined by excluding undesired entries. If the query type “Individual Entries” is chosen, MAASE provides the information page, one gene at a time as shown in Figure 7. For all other query types, MAASE asks for an e-mail address, and then automatically sends a text file containing the requested information.
Support for splicing array design
Users interested in using MAASE to aid in the design of splicing microarrays may use the query “Alternatively Spliced Junctions.” Querying for “Alternative Spliced Junctions” returns a text file of splicing information such as exon-exon junction sequences and splicing mode. To provide boundaries for individual junctions, sequences on the donor and acceptor sides are listed in two separate columns. The information in this text file can be coupled with specific design strategies for exon junction splicing arrays. The file provides sufficient sequence information surrounding each junction to design oligonucleotide probes with the desired length and melting temperature (Tm). Frequently, the exon junction-based platforms may also require specific sequence information from flanking constitutive regions and within alternative exonic regions. This additional sequence information can be individually queried from MAASE. Because of varying design strategies for exon junction-based arrays, it is difficult to provide the sequence information in a uniform export format.
We previously described the universal barcode array in which each alternative exonic sequence is interrogated by an oligonucleotide linked to a specific molecular barcode (or zipcode) (Yeakley et al. 2002). To couple with this array platform, the MAASE database is equipped with a specific oligonucleotide design algorithm to identify the best suited barcode from the barcode pool for each oligonucleotide corresponding to an alternative exonic sequence. When querying for the junction sequences for the barcode platform, users need to choose the query type “Alternative Spliced Junctions with Barcode,” which returns a text file of individual junction sequences, which are divided into those without barcode and those each linked to a specific barcode. The file can then be directly exported for oligonucleotide synthesis. In the future, additional features may be added to MAASE to support other splicing microarray platforms.
SUMMARY AND FUTURE DIRECTIONS
MAASE is both a database and an annotation system for alternative splicing events. The annotation system is a Web-based tool that combines manual and computational aspects to ensure both accuracy and efficiency during annotation. Once annotations are deposited into the database, detailed sequence information on alternative splicing can be conveniently retrieved for a variety of analytical and experimental purposes.
In the future, we plan to expand the database and further improve the annotation system by (1) carrying out large-scale annotation efforts, (2) creating a “quarantine” area for newly entered annotations to ensure accuracy before data deposition into the database, (3) integrating with other alternative splicing database efforts, and (4) linking microarray results and microarray data analysis tools to the database.
Acknowledgments
This work was supported by a grant from the National Cancer Institute (CA888351) to X-D.F. and M.G., and by the facilities of the National Biomedical Computational Resource (RR-08605) at the San Diego Supercomputer Center, UCSD. G.C.M was supported by a Ruth L. Kirschstein National Research Service Award NIH/NCI #T32 CA09523.
Article published online ahead of print. Article and publication date are at http://www.rnajournal.org/cgi/doi/10.1261/rna.2650905.
REFERENCES
- Baelde, H.J., Eikmans, M., van Vliet, A.I., Bergijk, E.C., de Heer, E., and Bruijn, J.A. 2004. Alternatively spliced isoforms of fibronectin in immune-mediated glomerulosclerosis: The role of TGFβ and IL-4. J. Pathol. 204: 248–257. [DOI] [PubMed] [Google Scholar]
- Beck, S., Penque, D., Garcia, S., Gomes, A., Farinha, C., Mata, L., Gulbenkian, S., Gil Ferreira, K., Duarte, A., Pacheco, P., et al. 1999. Cystic fibrosis patients with the 3272–26A→G mutation have mild disease, leaky alternative mRNA splicing, and CFTR protein at the cell membrane. Hum. Mutat. 14: 133–144. [DOI] [PubMed] [Google Scholar]
- Caceres, J.F. and Kornblihtt, A.R. 2002. Alternative splicing: Multiple control mechanisms and involvement in human disease. Trends Genet. 18: 186–193. [DOI] [PubMed] [Google Scholar]
- Clark, T.A., Sugnet, C.W., and Ares Jr., M., 2002. Genome-wide analysis of mRNA processing in yeast using splicing-specific microarrays. Science 296: 907–910. [DOI] [PubMed] [Google Scholar]
- Cooper, T.A. and Mattox, W. 1997. The regulation of splice site selection, and its role in human disease. Am. J. Hum. Genet. 61: 259–266. [DOI] [PMC free article] [PubMed] [Google Scholar]
- Croft, L., Schandorff, S., Clark, F., Burrage, K., Arctander, P., and Mattick, J.S. 2000. ISIS, the intron information system, reveals the high frequency of alternative splicing in the human genome. Nat. Genet. 24: 340–341. [DOI] [PubMed] [Google Scholar]
- Dralyuk, I., Brudno, M., Gelfand, M.S., Zorn, M., and Dubchak, I. 2000. ASDB: Database of alternatively spliced genes. Nucleic Acids Res. 28: 296–297. [DOI] [PMC free article] [PubMed] [Google Scholar]
- Dredge, B.K., Polydorides, A.D., and Darnell, R.B. 2001. The splice of life: Alternative splicing and neurological disease. Nat. Rev. Neurosci. 2: 43–50. [DOI] [PubMed] [Google Scholar]
- Florea, L., Hartzell, G., Zhang, Z., Rubin, G.M., and Miller, W. 1998. A computer program for aligning a cDNA sequence with a genomic DNA sequence. Genome Res. 8: 967–974. [DOI] [PMC free article] [PubMed] [Google Scholar]
- Garcia-Blanco, M.A., Baraniak, A.P., and Lasda, E.L. 2004. Alternative splicing in disease and therapy. Nat. Biotechnol. 22: 535–546. [DOI] [PubMed] [Google Scholar]
- Gasteiger, E., Gattiker, A., Hoogland, C., Ivanyi, I., Appel, R.D., and Bairoch, A. 2003. ExPASy: The proteomics server for in-depth protein knowledge and analysis. Nucleic Acids Res. 31: 3784–3788. [DOI] [PMC free article] [PubMed] [Google Scholar]
- Huang, Y.H., Chen, Y.T., Lai, J.J., Yang, S.T., and Yang, U.C. 2002. PALS db: Putative alternative splicing database. Nucleic Acids Res. 30: 186–190. [DOI] [PMC free article] [PubMed] [Google Scholar]
- Ji, H., Zhou, Q., Wen, F., Xia, H., Lu, X., and Li, Y. 2001. AsMamDB: An alternative splice database of mammals. Nucleic Acids Res. 29: 260–263. [DOI] [PMC free article] [PubMed] [Google Scholar]
- Jiang, H., Mankodi, A., Swanson, M.S., Moxley, R.T., and Thornton, C.A. 2004. Myotonic dystrophy type 1 is associated with nuclear foci of mutant RNA, sequestration of muscleblind proteins and deregulated alternative splicing in neurons. Hum. Mol. Genet. 13: 3079–3088. [DOI] [PubMed] [Google Scholar]
- Johnson, J.M., Castle, J., Garrett-Engele, P., Kan, Z., Loerch, P.M., Armour, C.D., Santos, R., Schadt, E.E., Stoughton, R., and Shoemaker, D.D. 2003. Genome-wide survey of human alternative pre-mRNA splicing with exon junction microarrays. Science 302: 2141–2144. [DOI] [PubMed] [Google Scholar]
- Karolchik, D., Baertsch, R., Diekhans, M., Furey, T.S., Hinrichs, A., Lu, Y.T., Roskin, K.M., Schwartz, M., Sugnet, C.W., Thomas, D.J., et al. 2003. The UCSC Genome Browser Database. Nucleic Acids Res. 31: 51–54. [DOI] [PMC free article] [PubMed] [Google Scholar]
- Kent, W.J. 2002. BLAT–The BLAST-like alignment tool. Genome Res. 12: 656–664. [DOI] [PMC free article] [PubMed] [Google Scholar]
- Lander, E.S., Linton, L.M., Birren, B., Nusbaum, C., Zody, M.C., Baldwin, J., Devon, K., Dewar, K., Doyle, M., FitzHugh, W., et al. 2001. Initial sequencing and analysis of the human genome. Nature 409: 860–921. [DOI] [PubMed] [Google Scholar]
- Lee, C., Atanelov, L., Modrek, B., and Xing, Y. 2003. ASAP: The Alternative Splicing Annotation Project. Nucleic Acids Res. 31: 101–105. [DOI] [PMC free article] [PubMed] [Google Scholar]
- Mankodi, A., Takahashi, M.P., Jiang, H., Beck, C.L., Bowers, W.J., Moxley, R.T., Cannon, S.C., and Thornton, C.A. 2002. Expanded CUG repeats trigger aberrant splicing of ClC-1 chloride channel pre-mRNA and hyperexcitability of skeletal muscle in myotonic dystrophy. Mol. Cell 10: 35–44. [DOI] [PubMed] [Google Scholar]
- Modrek, B., Resch, A., Grasso, C., and Lee, C. 2001. Genome-wide detection of alternative splicing in expressed sequences of human genes. Nucleic Acids Res. 29: 2850–2859. [DOI] [PMC free article] [PubMed] [Google Scholar]
- Pan, Q., Shai, O., Misquitta, C., Zhang, W., Saltzman, A.L., Mohammad, N., Babak, T., Siu, H., Hughes, T.R., Morris, Q.D., et al. 2004. Revealing global regulatory features of mammalian alternative splicing using a quantitative microarray platform. Mol. Cell 16: 929–941. [DOI] [PubMed] [Google Scholar]
- Pospisil, H., Herrmann, A., Bortfeldt, R.H., and Reich, J.G. 2004. EASED: Extended Alternatively Spliced EST Database. Nucleic Acids Res. 32 Database issue: D70–D74. [DOI] [PMC free article] [PubMed] [Google Scholar]
- Thabard, W., Barille, S., Collette, M., Harousseau, J.L., Rapp, M.J., Bataille, R., and Amiot, M. 1999. Myeloma cells release soluble interleukin-6Rα in relation to disease progression by two distinct mechanisms: Alternative splicing and proteolytic cleavage. Clin. Cancer Res. 5: 2693–2697. [PubMed] [Google Scholar]
- Thanaraj, T.A., Stamm, S., Clark, F., Riethoven, J.J., Le Texier, V., and Muilu, J. 2004. ASD: The Alternative Splicing Database. Nucleic Acids Res. 32 Database issue: D64–D69. [DOI] [PMC free article] [PubMed] [Google Scholar]
- Tomonaga, K., Kobayashi, T., Lee, B.J., Watanabe, M., Kamitani, W., and Ikuta, K. 2000. Identification of alternative splicing and negative splicing activity of a nonsegmented negative-strand RNA virus, Borna disease virus. Proc. Natl. Acad. Sci. 97: 12788–12793. [DOI] [PMC free article] [PubMed] [Google Scholar]
- Waterston, R.H., Lindblad-Toh, K., Birney, E., Rogers, J., Abril, J.F., Agarwal, P., Agarwala, R., Ainscough, R., Alexandersson, M., An, P., et al. 2002. Initial sequencing and comparative analysis of the mouse genome. Nature 420: 520–562. [DOI] [PubMed] [Google Scholar]
- Yeakley, J.M., Fan, J.B., Doucet, D., Luo, L., Wickham, E., Ye, Z., Chee, M.S., and Fu, X.D. 2002. Profiling alternative splicing on fiber-optic arrays. Nat. Biotechnol. 20: 353–358. [DOI] [PubMed] [Google Scholar]
- Zheng, C.L., Nair, T.M., Gribskov, M., Kwon, Y.S., Li, H.R., and Fu, X.D. 2004. A database designed to computationally aid an experimental approach to alternative splicing. Pac. Symp. Biocomput. 78–88. [DOI] [PubMed]


