

Abstract
Escherichia coli is a model laboratory bacterium, a species that is widely distributed in the environment, as well as a mutualist and pathogen in its human hosts. As such, E. coli represents an attractive organism to study how environment impacts microbial genome structure and function. Uropathogenic E. coli (UPEC) must adapt to life in several microbial communities in the human body, and has a complex life cycle in the bladder when it causes acute or recurrent urinary tract infection (UTI). Several studies designed to identify virulence factors have focused on genes that are uniquely represented in UPEC strains, whereas the role of genes that are common to all E. coli has received much less attention. Here we describe the complete 5,065,741-bp genome sequence of a UPEC strain recovered from a patient with an acute bladder infection and compare it with six other finished E. coli genome sequences. We searched 3,470 ortholog sets for genes that are under positive selection only in UPEC strains. Our maximum likelihood-based analysis yielded 29 genes involved in various aspects of cell surface structure, DNA metabolism, nutrient acquisition, and UTI. These results were validated by resequencing a subset of the 29 genes in a panel of 50 urinary, periurethral, and rectal E. coli isolates from patients with UTI. These studies outline a computational approach that may be broadly applicable for studying strain-specific adaptation and pathogenesis in other bacteria.
Keywords: uropathogenic Escherichia coli, ecogenomics
Although Escherichia coli is a resident of animal intestinal tracts, it is also well adapted to life in rivers, oceans, and soils and can be found living at −2°C in McMurdo Bay, Antarctica (1). Because it is easily cultured, many strain banks of natural isolates from diverse habitats, including infected patients, are available. The database of genetic and biochemical information for the human gut-derived K12 laboratory strain (MG1655) is massive and has been organized into extensively annotated transcriptional, signaling, and metabolic networks (e.g., ref. 2) that serve as a foundation for interpreting genome sequences from other strains. Finished genome sequences are now available for the K12 strain (3), a human uropathogen (CFT073) (4), two enterohemorrhagic strains (EDL933 and SAKAI) (5, 6), and two diarrhea-associated Shigella 2a strains (2457T and 301) (considered to be E. coli strains) (7, 8). Together, all of the genes identified in these sequences have provided an enticing glimpse of the E. coli pan-genome (4, 7, 9) and as such serve as a starting point for developing testable hypotheses about the mechanisms underlying the organism's adaptations to different habitats, including the evolution of its virulence.
Uropathogenic E. coli (UPEC) illustrates some distinctive features of this adaptability. UPEC emerges from the distal gut microbiota, is incorporated into the vaginal/periurethral microbiota, and then enters the bladder, where it attaches to and subsequently invades superficial facet (umbrella) cells of the urothelium (10, 11). Studies in a mouse model of human urinary tract infection (UTI) have shown that, once inside umbrella cells, UPEC rapidly proliferate to form intracellular bacterial communities (IBCs) (10, 12, 13) containing thousands of microbes (12). As an umbrella cell fills with UPEC, the growth rate and shape of the bacteria change to produce a slowly growing, tightly packed, intracellular biofilm comprised of coccoid-shaped organisms (12). Later, in response to environmental cues, UPEC detach from the IBC, become motile, exit the umbrella cell, and invade other urothelial cells as part of a process that can lead to persistent or recurrent UTI (12, 14). Nearly all UPEC, but few other E. coli, go through the IBC pathway in multiple inbred strains of mice (C. K. Garofalo, S. M. Martin, T.M.H., W. E. Stamm, J.I.G., and S.J.H., unpublished observations).
The genetic circuitry required for IBC development by UPEC is complex and not well understood. Several studies have focused on genetic material uniquely represented in UPEC strains in the search for determinants of virulence (e.g., refs. 15–18). The contribution of genes common to all E. coli to virulence has received much less attention (19). Recent results from a mouse model of UTI imply that genetic screens for these “common” genes are impractical due to numerical considerations (P. C. Seed, K. J. Wright, G. G. Anderson, and S.J.H., unpublished observations). One alternative approach for understanding strain-specific adaptations is sequence-based identification of genes that are under positive selection. Adaptation may occur via gain, loss, or modification of both coding and noncoding genetic material. Positive (adaptive) selection will act on any changes that contribute to fitness, increasing the frequency of those changes.
A number of methods are available for detecting positive selection in DNA sequences (20, 21), although many suffer from two problems that limit their utility: (i) selection may not act on all sites within a gene (site variation), and (ii) selection may not act continuously or on all bacterial lineages (branch variation). Branch variation is especially relevant for identifying strain-specific adaptations, because selection may act on genes only in those strains found in a new habitat. Recent work has begun to surmount both of these problems (22, 23): given enough sequences from related organisms, it is possible to detect positive selection occurring only in a portion of a gene in a subset of the sequences. In this report, we have used this comparative approach to understand the adaptations that E. coli has made to colonize and survive in the urinary tract. Using the newly sequenced genome of UTI89, a UPEC strain isolated from a patient with an acute bladder infection (14), we have identified coding sequences common to all E. coli but under positive selection only in UPEC strains. These results were validated by using a panel of clinical E. coli strains isolated from patients with UTI. Our computational method circumvents the technical difficulties that hamper in vivo genetic screens of UPEC in mice and may be broadly applicable to understanding strain-specific adaptation and pathogenesis in other bacteria.
Results and Discussion
UTI89 contains a 5,065,741-bp chromosome and a 114,230-bp plasmid (pUTI89). The chromosome has a GC content of 50.6%, 5,066 predicted protein-coding genes, 88 tRNA genes, and 22 rRNA genes. These values are similar to other sequenced E. coli strains (Table 3, which is published as supporting information on the PNAS web site). pUTI89 has a GC content of 51.0% and 145 predicted genes. The UTI89 genome contains four large pathogenicity islands (PAIs) similar to previously characterized PAIs. Other notable features include 10 putative pilus operons and ORFs encoding several toxins (two enterotoxins, a hemolysin, and cytotoxic necrotizing factor). A more detailed description of the PAIs, the genes that produce adhesive organelles, and the plasmid can be found in Supporting Text, which is published as supporting information on the PNAS web site.
A functional categorization of the predicted proteome of UTI89 using Clusters of Orthologous Groups (COG) is shown in Fig. 4, which is published as supporting information on the PNAS web site, and a metabolic reconstruction based on the Kyoto Encyclopedia of Genes and Genomes (KEGG) is deposited at http://hultgren.wustl.edu/UTI89 (for similar reconstructions of the other E. coli genomes, see www.genome.jp/kegg).
The number of shared and novel genes was calculated (Supporting Text and ref. 9) for all subsets of the seven E. coli genomes, and an exponential curve was fit to the data to predict the number of shared and new genes that would be contributed by additional genome sequences. The size of the E. coli core genome (genes shared among all E. coli) is predicted to be 2,865. Like the pan-genomes of Group A Streptococcus and Group B Streptococcus (9), the pan-genome of E. coli is open: the number of new genes contributed by each new E. coli genome is predicted to be 441 genes, which is substantially higher than the 27 and 33 genes predicted to be added with each new Group A and B Streptococcus genome (9).
Identifying Genes Under Selection in UPEC Strains.
To identify genes under positive selection in UPEC strains, we performed comparisons between all seven fully sequenced E. coli genomes using the scheme outlined in Fig. 1A. Identification of positive selection using the paml program requires an aligned set of related sequences (orthologs) and knowledge of their phylogenetic relationships. Reciprocal best blast hits in the seven genomes were assumed to represent orthologous sequences and were aligned by using clustalw. The phylogenetic relationship between sequences can consist of vertical components (direct mother-to-daughter transmission) and horizontal components (all other DNA transfers, including gene conversion, recombination, and lateral transfer). In E. coli, a given nucleotide difference is 10–50 times more likely to have been caused by recombination or gene conversion (horizontal relationships) than by mutation (vertical) (24, 25). Therefore, accounting for horizontal relationships is crucial for inferring an accurate phylogeny (26–28) for subsequent use in detecting selection (29, 30). These relationships can be assessed by using methods to detect recombination, ideally with at least two methods that differ in their underlying theory to maximize accuracy (26, 31). After accounting for recombination, vertical relationships can then be inferred with standard phylogenetic tree-building software.
Fig. 1.

Overview of the analysis and specification of foreground branches. (A) Analysis scheme. Size of each dataset (boxes) is indicated in parentheses. Programs used are indicated next to the arrows. See text for more details about how datasets were generated. (B and C) Hypothetical phylogenetic tree to indicate branch specification. UPEC strains are boxed. Evidence for positive selection was evaluated in specific lineages (termed foreground branches). B shows the sets of UPEC-specific foreground branches used: (i) UTI89 only (green), (ii) CFT073 only (red), (iii) UPEC leaves only (green + red), (iv) common UPEC branch only (cyan), (v) all UPEC (green + red + cyan). C shows that when the common UPEC branch was not present due to the tree topology, only three sets of UPEC foreground branches were used (green, red, and green + red).
We identified 3,470 ortholog sets with at least four members (the minimum number needed for subsequent analysis), representing 68.5% of all UTI89 genes. The aligned ortholog sets were tested for evidence of recombination by using the programs geneconv and reticulate. Of the 3,470 ortholog sets, 443 (12.8%) showed evidence of recombination using both programs. geneconv also predicts breakpoints where recombination has occurred. These breakpoints define subsegments (fragments) of each ortholog. Adjacent fragments, despite being in the same ortholog, have different evolutionary histories due to recombination (26). A total of 2,227 fragment sets were created from the 443 ortholog sets with evidence of recombination. The phylip software package was then used to infer maximum parsimony trees from the 3,027 ortholog sets that showed no evidence of recombination and from the 2,227 fragment sets.
Positive selection was identified with the program paml. Using a maximum likelihood algorithm, paml assigns likelihood scores to different hypotheses (models) for selection. If a model incorporating positive selection has a higher likelihood score than a null model without positive selection, this constitutes evidence for positive selection. The null model is referred to as M1a, and the selection model as M2a. Comparison of M1a and M2a tests whether a gene is under selection in all of the sequenced E. coli strains. A third model (bsA) is based on the hypothesis that positive selection occurs only in certain branches/lineages: comparing the likelihoods of bsA and M1a tests whether a gene is under positive selection in a specific lineage, such as UPEC strains. In the bsA model, the branches hypothesized to have positive selection must be specified and are referred to as “foreground branches” (Fig. 1 B and C).
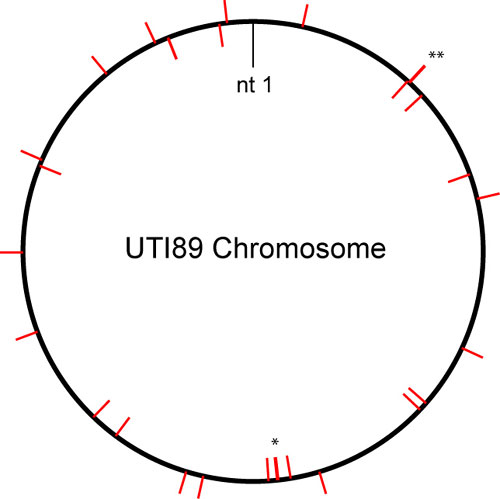
Using the aligned ortholog and fragment sets and their corresponding phylogenetic trees, likelihood scores were assigned for the M1a, M2a, and bsA models. Ortholog and fragment sets that showed evidence for positive selection in UPEC branches (bsA versus M1a) but not in all E. coli (M2a versus M1a) were then inspected individually. Table 1 lists the resulting 29 genes designated as being under positive selection in UPEC (UPEC-selected genes, USG). Except for three genes in one iron acquisition locus (see below), the USG were distributed throughout the UTI89 chromosome (Fig. 5, which is published as supporting information on the PNAS web site). Sample data and output files are included in Dataset 1, which is published as supporting information on the PNAS web site.
Table 1.
Positively selected genes in UPEC strains
| Name (Systematic) | P value | dn/ds | COG | Annotation |
|---|---|---|---|---|
| cedA (UTI89_C1924) | 1.75E-04 | 795.84 | — | Cell division regulatory protein |
| yhgA (UTI89_C3912) | 1.41E-06 | 323.80 | — | Hypothetical protein |
| yidQ (UTI89_C4239) | 1.58E-05 | 999.00 | — | Hypothetical protein |
| (UTI89_C4862) | 1.13E-09 | 822.62 | — | Hypothetical protein |
| fdnG (UTI89_C1689) | 2.24E-04 | 999.00 | C | α subunit of formate dehydrogenase N |
| ygcR (UTI89_C3134) | 1.55E-04 | 999.00 | C | Putative transport protein |
| cycA (UTI89_C4817) | 5.44E-05 | 275.05 | E | Serine/alanine/glycine APC transporter |
| argl (UTI89_C4860) | 1.09E-05 | 450.08 | E | Ornithine carbamoyltransferase chain I |
| yjjN (UTI89_C5064) | 2.22E-05 | 570.01 | E | Hypothetical zinc-type alcohol dehydrogenase-like protein |
| fruA (UTI89_C2442) | 1.69E-06 | 202.74 | G | PTS system, fructose-specific IIBC component |
| agal (UTI89_C3572) | 2.33E-04 | 999.00 | G | Putative galactosamine-6-phosphate isomerase |
| yicM (UTI89_C4218) | 6.60E-05 | 397.37 | G | Putative transport protein |
| yjiL (UTI89_C5044) | 2.37E-05 | 999.00 | I | Hypothetical protein |
| yjbN (UTI89_C4617) | 7.27E-09 | 191.93 | J | Hypothetical protein |
| topB (UTI89_C1958) | 1.17E-26 | 106.44 | L | DNA topoisomerase III |
| xseA (UTI89_C2827) | 1.22E-08 | 218.52 | L | Exodeoxyribonuclease VII large subunit |
| recC (UTI89_C3223) | 1.11E-04 | 316.28 | L | Exodeoxyribonuclease V γ chain |
| fepE (UTI89_C0589) | 1.65E-04 | 123.61 | M | Ferric enterobactin transport protein |
| cutE (UTI89_C0655) | 9.50E-08 | 999.00 | M | Apolipoprotein N-acyltransferase |
| ompF (UTI89_C1001) | 8.26E-05 | 999.00 | M | Outer membrane protein F |
| ompC (UTI89_C2497) | 2.42E-11 | 999.00 | M | Outer membrane protein 1b (1b;c) |
| yfaL (UTI89_C2514) | 1.04E-10 | 387.75 | M | Hypothetical protein |
| amiA (UTI89_C2768) | 9.89E-06 | 999.00 | M | Probable N-acetylmuramoyl-l-alanine amidase |
| fhuA (UTI89_C0166) | 6.68E-16 | 998.92 | P | Ferrichrome-iron receptor |
| entD (UTI89_C0583) | 4.68E-06 | 360.74 | Q | 4′-phosphopantetheinyl transferase |
| entF (UTI89_C0588) | 1.90E-11 | 999.00 | Q | Enterobactin synthetase component F |
| yoji (UTI89_C2491) | 2.18E-04 | 999.00 | Q | Hypothetical ABC transporter ATP-binding protein |
| ycdT (UTI89_C1088) | 4.77E-07 | 223.42 | T | Hypothetical protein |
| yegO (UTI89_C2351) | 2.33E-07 | 578.56 | V | Hypothetical protein |
The P value shown is the smallest P value for a test of selection in any UPEC foreground branch (see Fig. 1 B and C). Ratio of nonsynonymous to synonomous mutation rate (dn/ds) measures the strength of selection, where values >1 indicate positive selection, and larger values indicate stronger selection. COG category abbreviations are used; full category names are given in Fig. 3. “−” indicates that no COG category was assigned. Boldface highlights members of COG categories that are significantly enriched in the positively selected genes (see Fig. 3).
To validate our methods, we compared the USG with other selected genes. We hypothesized that strains which occupy distinct habitats (addresses) and exploit distinct niches (professions) will have undergone selection for correspondingly distinct adaptations. Thus, strains that cause different diseases in different organs should differ in the set of genes under positive selection. Using the same methods, we identified 17 genes under positive selection in enterohemorrhagic E. coli (EHEC) and 48 genes in Shigella. The sets of genes under selection in UPEC, EHEC, and Shigella were distinct, with two exceptions, thus validating our hypothesis. The exceptions were: UTI89_C2497 (ompC, outer membrane protein C), which is under selection in UPEC and Shigella (see below); and UTI89_C5128 (mukF), which is under selection in UPEC and EHEC. Because ompC showed stronger evidence for selection in UPEC than in Shigella, it was included in the 29 USG; mukF was excluded because there was stronger evidence for positive selection in EHEC.
With few (five to six) sequences, detection of positive selection by the paml program is “reliable” but “conservative” (32–34). Increased accuracy and power are most easily gained with more sequences (33). Therefore, to further validate our methods, we analyzed additional sequence data collected from nonlaboratory E. coli strains for three USG and three control housekeeping genes. A panel of clinical E. coli strains was collected from otherwise healthy college-aged women with recurrent UTI who were enrolled in a prospective clinical trial (T.M.H. and W. E. Stamm, unpublished data). Strains were isolated from urine samples obtained during symptomatic infections, as well as from perirectal and periurethral swabs (n = 39 urine isolates, seven periurethral isolates, and one fecal isolate from 35 UTI patients plus three fecal isolates from healthy volunteers). PCR amplicons from the ferrienterobactin permease (fepE), ompC, and N-acetylmuramyl-l-alanine amidase (amiA) USG were resequenced in these 50 strains. As controls, three housekeeping genes that are commonly used for multilocus sequence typing were also sequenced: adenylate kinase (adk), malate dehydrogenase (mdh), and isocitrate dehydrogenase (icd). Distinct sequences were analyzed by using the alignment, recombination, and likelihood estimation procedures described above. As shown in Fig. 2, Table 2, and Table 4, which is published as supporting information on the PNAS web site, amiA and fepE showed evidence for positive selection in branches that included 35 of 39 (90%) and 32 of 39 (82%) urine isolates, respectively, and excluded three of the four fecal isolates. ompC was under positive selection in a smaller subset of UPEC strains (8 of 39 urine strains; 0 fecal isolates), with weaker evidence that it was under selection in all of the strains (see below). This directly mirrors the analysis of ompC in the seven genomes, where the gene showed evidence of positive selection in one of the two UPEC strains and weaker evidence of selection in all of the strains. No evidence for positive selection was found in any branch for the adenylate kinase (adk), malate dehydrogenase (mdh), and isocitrate dehydrogenase (icd) genes, further confirming the results we obtained using the seven fully sequenced E. coli genomes.
Fig. 2.

amiA, fepE, and ompC are under selection in clinical UPEC isolates. Phylogenetic trees of unique sequences for each gene are shown. Red branches/labels indicate foreground branches that show evidence for positive selection (see Table 2 and text). Red numbers to the right of the tree indicate the number of urine and fecal isolates represented by the red (foreground) labels in the phylogenetic tree. Black numbers to the right of the tree indicate the number of urine and fecal isolates represented by black labels in the phylogenetic tree. The sites of isolation of strains represented by sequence labels are summarized in Table 4. Scale bar for phylogenetic trees is shown at the bottom right.
Table 2.
Analysis of resequenced genes
| Gene | P value | dn/ds | Base pairs sequenced |
|---|---|---|---|
| fepE (UTI89_C0589) | 3.94E-02 | 86.96 | 375 |
| ompC (UTI89_C2497) | 1.29E-07 | 999.00 | 756 |
| amiA (UTI89_C2768) | 5.48E-03 | 7.95 | 279 |
| adk (UTI89_C0502) | 1.00E+00 | NA | 501 |
| mdh (UTI89_C3667) | 1.00E+00 | NA | 435 |
| icd (UTI89_C1266) | 4.46E-01 | NA | 666 |
P value and dn/ds values from the analysis of resequenced clinical strains are shown. Number of base pairs sequenced and analyzed is shown in the last column. A dn/ds value of N/A means that no evidence for positive selection was found.
Functional Analysis.
To gain additional insights into the evolutionary pressures acting on UPEC strains, we analyzed the functional features of the 29 USG. Two COG categories were significantly enriched (P < 0.05, binomial test) among the USG compared with the entire set of genes in the UTI89 genome: (i) M, cell wall/membrane biogenesis; and (ii) Q, secondary metabolites biosynthesis, transport, and catabolism (Fig. 3). A third COG category (L, replication, recombination, and repair) was also enriched but with borderline significance (P = 0.0527).
Fig. 3.

UPEC-selected genes are enriched for genes in two COG functional categories. COG category codes are indicated on the y axis. The fraction of genes in each COG category is shown on the x axis. Black bars indicate genes under positive selection in UPEC strains (n = 29). Open bars are for all genes annotated in UTI89 (n = 5,066). COG categories that are significantly enriched (P < 0.05, binomial test) in the set of UPEC-selected genes relative to all UTI89 genes are indicated by an asterisk. COG category codes are as follows: U, intracellular trafficking and secretion; G, carbohydrate transport and metabolism; I, lipid transport and metabolism; R, general function prediction only; D, cell cycle control, mitosis and meiosis; H, coenzyme transport and metabolism; B, chromatin structure and dynamics; P, inorganic ion transport and metabolism; W, extracellular structures; O, posttranslational modification, protein turnover, chaperones; J, translation; A, RNA processing and modification; L, replication, recombination and repair; C, energy production and conversion; M, cell wall/membrane biogenesis; Q, secondary metabolites biosynthesis, transport and catabolism; Z, cytoskeleton; V, defense mechanisms; Y, nuclear structure; E, amino acid transport and metabolism; K, transcription; N, cell motility; T, signal transduction mechanisms; F, nucleotide transport and metabolism; and S, function unknown.
UPEC often have high mutation rates compared with other E. coli strains (up to 5 × 10⁻⁷ per nucleotide per generation, a value that is 100- to 1,000-fold higher than for wild-type strains) (24, 35). Notably, a generally high mutation rate would conservatively bias our analysis (see Supporting Text for further details). Elevated mutation rate confers a fitness advantage to UPEC strains in a mouse UTI model: mutator strains persist longer in bladder and kidney than wild-type strains, and serial passage increases the virulence of mutator strains over that of wild-type (36). The strains tested were mutS mutants that are defective in initial recognition of mispaired DNA bases (36). Little is known about the mechanistic basis of elevated mutation rates in UPEC and its significance in the context of the drastic changes in population size (P. C. Seed, K. J. Wright, G. G. Anderson, and S.J.H., unpublished observations) and growth rate (12) that occur during IBC formation. Intriguingly, UTI89_C2827 (xseA, the large subunit of exodeoxyribonuclease VII) and UTI89_C3223 (recC, a subunit of the RecBCD helicase/nuclease) are among the genes identified as being under positive selection in UPEC. Both gene products have roles in DNA repair: exodeoxyribonuclease VII is one of four presumably redundant methyl-directed mismatch repair nucleases acting downstream of MutS (37, 38); and over- or underexpression of the RecBCD complex impairs double-stranded DNA break repair and homologous recombination (39).
Positive selection, exerted through immune pressure, acts on surface/membrane structures in many pathogens (e.g., ref. 40). Moreover, surface structures are encoded by a number of key virulence factors (41). The product of the UPEC-selected gene UTI89_C0589 (fepE) regulates LPS O-antigen chain length (42). LPS and O-antigen are important in many bacterial infections for stimulation of and protection from the host immune system (e.g., refs. 43–45). Altering O-antigen chain length can abolish these LPS activities (42) and interfere with the function of other surface molecules such as type III secretion systems (43). Another selected gene, UTI89_C2514 (yfaL), codes for a putative adhesin that affects biofilm formation (46), a feature of mature IBCs thought to play a key role in their ability to subvert innate immune responses and to resist antibiotic treatment so that they can persist within their host (13).
Two other genes in the cell wall/membrane biogenesis COG, UTI89_C1001 (ompF) and UTI89_C2497 (ompC), encode general outer membrane porins. During growth in vitro, OmpC and OmpF are the most abundant proteins in the E. coli outer membrane (47). ompC is one of the 50 most highly expressed genes during UPEC infection of the mouse urinary tract, whereas ompF is one of the 50 most up-regulated genes when UPEC are grown in urine (48). The high levels of expression of these two proteins may contribute to their immunogenicity, which may explain why ompC shows weak evidence of positive selection in all E. coli. ompC and ompF are coordinately regulated by the EnvZ/OmpR and CpxA/CpxR two-component systems that balance the uptake of nutrients versus toxins: OmpC has a smaller pore size than OmpF (47) and is up-regulated by the CpxA/CpxR envelope stress response system. Up-regulation of ompC in vivo would be beneficial in environments where small molecule toxins are abundant (49). As noted above, our analysis indicated that ompC is also under strong positive selection in Shigella, which, like UPEC, invades epithelial cells. Interestingly, an ompC mutant of Shigella is unable to spread from cell to cell (50), suggesting that ompC may also play an important role in the recurrent cycles of urothelial cell invasion by UPEC in the IBC pathway.
One other gene in the cell wall/membrane biogenesis COG, UTI89_C2768 (N-acetylmuramyl-l-alanine amidase, amiA), plays a role in septal cleavage during cell division (51). UPEC dramatically alters its growth rate and cell shape in IBCs (12). Modulation of growth rate and cell shape should logically require alterations in replication, chromosome segregation, and cell division. Interestingly, UTI89_C1924 (cedA), a cell division regulatory protein with no COG classification, is also present among the UPEC-selected genes. Overexpression of CedA allows cell division in the face of overinitiation of DNA replication (52). Furthermore, UTI89_C1958 (DNA topoisomerase III, topB), is under selection in UPEC strains. topB is capable of acting as the cellular decatenase during DNA replication (53). Thus, genes involved in several processes essential for modulating growth rate are under positive selection in UPEC and may help explain the observed changes in growth rate and cell shape that occur during the lifecycle of IBCs.
Iron limitation is a component of host defense against infection, especially on mucosal surfaces (54). Iron acquisition genes are important contributors to UPEC virulence (17, 48, 55). Three of these genes are under positive selection in UPEC strains. UTI89_C0166 (fhuA) is a ferrichrome–iron receptor. UTI89_C0583 [enterochelin synthase, component D (entD)] and UTI89_C0588 [enterochelin synthase, component F (entF)] have roles in synthesis of enterochelin (enterobactin) (56), which is responsible for iron scavenging. Both entD and entF are located near fepE: as noted above, with the exception of this ent/fep locus, there does not appear to be any bias in the distribution of the 29 USG in the UTI89 chromosome. Two of these selected genes, entF and fhuA, are up-regulated 2- to 5-fold during in vivo infection of mouse bladders (48). Interestingly, no iron acquisition genes were detected as being under positive selection in EHEC or Shigella strains. In addition, UTI89_C1339 (sitA, a putative iron transport protein) was under selection in all E. coli.
Prospectus.
We have presented a computational pipeline for identifying genes under positive selection in microbial strains that uses multiple genome sequences. Recombination is a large potential problem for tests of positive selection (29), especially in bacteria (28). Therefore, we have incorporated tests for recombination into our analysis. Our method has identified genes and cellular processes known to play an important role in E. coli urinary tract virulence (e.g., iron acquisition) and highlighted specific genes that may elucidate poorly understood aspects of UPEC biology (e.g., elevated mutation rate and changes in bacterial morphology). Large strain databases of pathogenic bacteria represent attractive future targets for this kind of comparative analysis. In particular, the strain panel of clinical UTI isolates we used for validation represents a promising resource for understanding UPEC microevolution through multiple recurrent infections.
Future development of this analysis pipeline should include noncoding sequences and genes present exclusively in UPEC strains. Currently, coding sequences are far better understood than noncoding, allowing us to leverage knowledge of the genetic code to increase the power for detection of selection. Incorporation of sequence-based methods for detecting selection in intergenic sequences, such as phylogenetic footprinting (57) or detection of mutation rate heterogeneity (58), will provide additional perspectives on subspecies (strain) evolution. In addition, genes present exclusively in UPEC strains are widely accepted to play a role in urinary tract virulence. We did not analyze these genes (which total >2,000; ref. 4 and Table 5, which is published as supporting information on the PNAS web site), because not enough sequences are available from different strains. Furthermore, additional sequences combined with lineage-specific detection of positive selection will allow us to differentiate genes under positive selection in all UPEC strains from those under selection in only a subset of strains; this, in turn, may provide further insight into prevailing mechanisms of infection. Genome sequencing of additional UPEC and non-UPEC strains is therefore of continuing importance in understanding the biology of E. coli in general and its strain-specific adaptations in particular.
Materials and Methods
Details of the methods used for genome sequencing and annotation, estimating the sizes of the E. coli core and pan-genomes, defining reciprocal best blast hits, aligning sequences, and inferring phylogenetic trees may be found in the Supporting Text, as well as Fig. 6 and Table 6, which are published as supporting information on the PNAS web site.
Genome Sequences and Programs.
Genome sequences were downloaded from the National Center for Biotechnology Information (NCBI) RefSeq repository (ftp://ftp.ncbi.nih.gov/genomes/Bacteria) as of March 15, 2005. Data management and analysis were done with the genome-tools package (59) and ad hoc perl scripts. blast programs, version #2, were from NCBI. Other programs used included (i) clustalw (for alignments, ref. 60); (ii) geneconv (61) and reticulate (27) (to infer recombination); (iii) phylip (to infer phylogenetic trees, ref. 62); and (iv) paml (to detect selection, ref. 63).
Detection of Recombination.
Both geneconv and reticulate were run on the aligned nucleotide sequences: geneconv was run by using the “/r” (silent sites only) option; reticulate was run with the “treat sites with more than two characters as sites with more than two characters” option, and P values were calculated from 10,000 randomizations of the data. If the P values reported by both programs were <0.05, the aligned sequences were fragmented at recombination breakpoints identified by geneconv (using the endpoints of all reported fragments). These fragments were then treated independently to infer phylogenetic trees and detect selection.
Detection of Selection.
The codeml program from the paml package (Version 3.14b) was used for all calculations. The following models were run for each set of genes or gene fragments (if recombination was detected): site models M1a and M2a and branch-site model A for each set of foreground branches. Options set in the control file followed those in the lysozyme example directory of the paml distribution package.
A likelihood ratio test was used to compare model M2a with M1a, and branch-site model A with model M1a. The significance cutoff was set at 1/3,470 (the reciprocal of the number of genes tested).
Supplementary Material
Acknowledgments
We thank Justin Fay for suggestions and comments on the text. This work was supported by National Institutes of Health Grants P50-ARO49475, T32HG000045, DK64540, and DK51406.
Abbreviations
- UPEC
uropathogenic Escherichia coli
- UTI
urinary tract infection
- IBC
intracellular bacterial community
- USG
UPEC-selected genes
- COG
clusters of orthologous groups
- EHEC
enterohemorrhagic E. coli.
Footnotes
Conflict of interest statement: No conflicts declared.
References
- 1.McFeters G. A., Barry J. P., Howington J. P. Water Res. 1993;27:645–650. doi: 10.1016/0043-1354(93)90174-g. [DOI] [PubMed] [Google Scholar]
- 2.Keseler I. M., Collado-Vides J., Gama-Castro S., Ingraham J., Paley S., Paulsen I. T., Peralta-Gil M., Karp P. D. Nucleic Acids Res. 2005;33:D334–D337. doi: 10.1093/nar/gki108. [DOI] [PMC free article] [PubMed] [Google Scholar]
- 3.Blattner F. R., Plunkett G., 3rd, Bloch C. A., Perna N. T., Burland V., Riley M., Collado-Vides J., Glasner J. D., Rode C. K., Mayhew G. F., et al. Science. 1997;277:1453–1474. doi: 10.1126/science.277.5331.1453. [DOI] [PubMed] [Google Scholar]
- 4.Welch R. A., Burland V., Plunkett G., 3rd, Redford P., Roesch P., Rasko D., Buckles E. L., Liou S. R., Boutin A., Hackett J., et al. Proc. Natl. Acad. Sci. USA. 2002;99:17020–17024. doi: 10.1073/pnas.252529799. [DOI] [PMC free article] [PubMed] [Google Scholar]
- 5.Perna N. T., Plunkett G., 3rd, Burland V., Mau B., Glasner J. D., Rose D. J., Mayhew G. F., Evans P. S., Gregor J., Kirkpatrick H. A., et al. Nature. 2001;409:529–533. doi: 10.1038/35054089. [DOI] [PubMed] [Google Scholar]
- 6.Hayashi T., Makino K., Ohnishi M., Kurokawa K., Ishii K., Yokoyama K., Han C. G., Ohtsubo E., Nakayama K., Murata T., et al. DNA Res. 2001;8:11–22. doi: 10.1093/dnares/8.1.11. [DOI] [PubMed] [Google Scholar]
- 7.Wei J., Goldberg M. B., Burland V., Venkatesan M. M., Deng W., Fournier G., Mayhew G. F., Plunkett G., 3rd, Rose D. J., Darling A., et al. Infect. Immun. 2003;71:2775–2786. doi: 10.1128/IAI.71.5.2775-2786.2003. [DOI] [PMC free article] [PubMed] [Google Scholar]
- 8.Jin Q., Yuan Z., Xu J., Wang Y., Shen Y., Lu W., Wang J., Liu H., Yang J., Yang F., et al. Nucleic Acids Res. 2002;30:4432–4441. doi: 10.1093/nar/gkf566. [DOI] [PMC free article] [PubMed] [Google Scholar]
- 9.Tettelin H., Masignani V., Cieslewicz M. J., Donati C., Medini D., Ward N. L., Angiuoli S. V., Crabtree J., Jones A. L., Durkin A. S., et al. Proc. Natl. Acad. Sci. USA. 2005;102:13950–13955. doi: 10.1073/pnas.0506758102. [DOI] [PMC free article] [PubMed] [Google Scholar]
- 10.Mulvey M. A., Lopez-Boado Y. S., Wilson C. L., Roth R., Parks W. C., Heuser J., Hultgren S. J. Science. 1998;282:1494–1497. doi: 10.1126/science.282.5393.1494. [DOI] [PubMed] [Google Scholar]
- 11.Martinez J. J., Mulvey M. A., Schilling J. D., Pinkner J. S., Hultgren S. J. EMBO J. 2000;19:2803–2812. doi: 10.1093/emboj/19.12.2803. [DOI] [PMC free article] [PubMed] [Google Scholar]
- 12.Justice S. S., Hung C., Theriot J. A., Fletcher D. A., Anderson G. G., Footer M. J., Hultgren S. J. Proc. Natl. Acad. Sci. USA. 2004;101:1333–1338. doi: 10.1073/pnas.0308125100. [DOI] [PMC free article] [PubMed] [Google Scholar]
- 13.Anderson G. G., Palermo J. J., Schilling J. D., Roth R., Heuser J., Hultgren S. J. Science. 2003;301:105–107. doi: 10.1126/science.1084550. [DOI] [PubMed] [Google Scholar]
- 14.Mulvey M. A., Schilling J. D., Hultgren S. J. Infect. Immun. 2001;69:4572–4579. doi: 10.1128/IAI.69.7.4572-4579.2001. [DOI] [PMC free article] [PubMed] [Google Scholar]
- 15.Zhang L., Foxman B., Manning S. D., Tallman P., Marrs C. F. Infect. Immun. 2000;68:2009–2015. doi: 10.1128/iai.68.4.2009-2015.2000. [DOI] [PMC free article] [PubMed] [Google Scholar]
- 16.Guyer D. M., Kao J. S., Mobley H. L. Infect. Immun. 1998;66:4411–4417. doi: 10.1128/iai.66.9.4411-4417.1998. [DOI] [PMC free article] [PubMed] [Google Scholar]
- 17.Sannes M. R., Kuskowski M. A., Owens K., Gajewski A., Johnson J. R. J. Infect. Dis. 2004;190:2121–2128. doi: 10.1086/425984. [DOI] [PubMed] [Google Scholar]
- 18.Srinivasan U., Foxman B., Marrs C. F. J. Clin. Microbiol. 2003;41:285–289. doi: 10.1128/JCM.41.1.285-289.2003. [DOI] [PMC free article] [PubMed] [Google Scholar]
- 19.Sokurenko E. V., Chesnokova V., Dykhuizen D. E., Ofek I., Wu X. R., Krogfelt K. A., Struve C., Schembri M. A., Hasty D. L. Proc. Natl. Acad. Sci. USA. 1998;95:8922–8926. doi: 10.1073/pnas.95.15.8922. [DOI] [PMC free article] [PubMed] [Google Scholar]
- 20.Kreitman M. Annu. Rev. Genom. Hum. Genet. 2000;1:539–559. doi: 10.1146/annurev.genom.1.1.539. [DOI] [PubMed] [Google Scholar]
- 21.Fay J. C., Wu C. I. Annu. Rev. Genom. Hum. Genet. 2003;4:213–235. doi: 10.1146/annurev.genom.4.020303.162528. [DOI] [PubMed] [Google Scholar]
- 22.Yang Z., Nielsen R. Mol. Biol. Evol. 2002;19:908–917. doi: 10.1093/oxfordjournals.molbev.a004148. [DOI] [PubMed] [Google Scholar]
- 23.Suzuki Y., Nei M. Mol. Biol. Evol. 2001;18:2179–2185. doi: 10.1093/oxfordjournals.molbev.a003764. [DOI] [PubMed] [Google Scholar]
- 24.Guttman D. S., Dykhuizen D. E. Science. 1994;266:1380–1383. doi: 10.1126/science.7973728. [DOI] [PubMed] [Google Scholar]
- 25.Feil E. J., Maiden M. C., Achtman M., Spratt B. G. Mol. Biol. Evol. 1999;16:1496–1502. doi: 10.1093/oxfordjournals.molbev.a026061. [DOI] [PubMed] [Google Scholar]
- 26.Wiuf C., Christensen T., Hein J. Mol. Biol. Evol. 2001;18:1929–1939. doi: 10.1093/oxfordjournals.molbev.a003733. [DOI] [PubMed] [Google Scholar]
- 27.Jakobsen I. B., Easteal S. Comput. Appl. Biosci. 1996;12:291–295. doi: 10.1093/bioinformatics/12.4.291. [DOI] [PubMed] [Google Scholar]
- 28.Feil E. J., Spratt B. G. Annu. Rev. Microbiol. 2001;55:561–590. doi: 10.1146/annurev.micro.55.1.561. [DOI] [PubMed] [Google Scholar]
- 29.Anisimova M., Nielsen R., Yang Z. Genetics. 2003;164:1229–1236. doi: 10.1093/genetics/164.3.1229. [DOI] [PMC free article] [PubMed] [Google Scholar]
- 30.Suzuki Y., Nei M. Mol. Biol. Evol. 2004;21:914–921. doi: 10.1093/molbev/msh098. [DOI] [PubMed] [Google Scholar]
- 31.Posada D. Mol. Biol. Evol. 2002;19:708–717. doi: 10.1093/oxfordjournals.molbev.a004129. [DOI] [PubMed] [Google Scholar]
- 32.Wong W. S., Yang Z., Goldman N., Nielsen R. Genetics. 2004;168:1041–1051. doi: 10.1534/genetics.104.031153. [DOI] [PMC free article] [PubMed] [Google Scholar]
- 33.Anisimova M., Bielawski J. P., Yang Z. Mol. Biol. Evol. 2002;19:950–958. doi: 10.1093/oxfordjournals.molbev.a004152. [DOI] [PubMed] [Google Scholar]
- 34.Anisimova M., Bielawski J. P., Yang Z. Mol. Biol. Evol. 2001;18:1585–1592. doi: 10.1093/oxfordjournals.molbev.a003945. [DOI] [PubMed] [Google Scholar]
- 35.Denamur E., Bonacorsi S., Giraud A., Duriez P., Hilali F., Amorin C., Bingen E., Andremont A., Picard B., Taddei F., et al. J. Bacteriol. 2002;184:605–609. doi: 10.1128/JB.184.2.605-609.2002. [DOI] [PMC free article] [PubMed] [Google Scholar]
- 36.Labat F., Pradillon O., Garry L., Peuchmaur M., Fantin B., Denamur E. FEMS Immunol. Med. Microbiol. 2005;44:317–321. doi: 10.1016/j.femsim.2005.01.003. [DOI] [PubMed] [Google Scholar]
- 37.Viswanathan M., Burdett V., Baitinger C., Modrich P., Lovett S. T. J. Biol. Chem. 2001;276:31053–31058. doi: 10.1074/jbc.M105481200. [DOI] [PubMed] [Google Scholar]
- 38.Burdett V., Baitinger C., Viswanathan M., Lovett S. T., Modrich P. Proc. Natl. Acad. Sci. USA. 2001;98:6765–6770. doi: 10.1073/pnas.121183298. [DOI] [PMC free article] [PubMed] [Google Scholar]
- 39.Dermic D., Halupecki E., Zahradka D., Petranovic M. Res. Microbiol. 2005;156:304–311. doi: 10.1016/j.resmic.2004.10.005. [DOI] [PubMed] [Google Scholar]
- 40.Fitzpatrick D. A., Creevey C. J., McInerney J. O. J. Mol. Evol. 2005;61:90–98. doi: 10.1007/s00239-004-0290-6. [DOI] [PubMed] [Google Scholar]
- 41.Finlay B. B., Falkow S. Microbiol Mol. Biol. Rev. 1997;61:136–169. doi: 10.1128/mmbr.61.2.136-169.1997. [DOI] [PMC free article] [PubMed] [Google Scholar]
- 42.Murray G. L., Attridge S. R., Morona R. Mol. Microbiol. 2003;47:1395–1406. doi: 10.1046/j.1365-2958.2003.03383.x. [DOI] [PubMed] [Google Scholar]
- 43.West N. P., Sansonetti P., Mounier J., Exley R. M., Parsot C., Guadagnini S., Prevost M. C., Prochnicka-Chalufour A., Delepierre M., Tanguy M., et al. Science. 2005;307:1313–1317. doi: 10.1126/science.1108472. [DOI] [PubMed] [Google Scholar]
- 44.Svanborg C., Godaly G., Hedlund M. Curr. Opin. Microbiol. 1999;2:99–105. doi: 10.1016/s1369-5274(99)80017-4. [DOI] [PubMed] [Google Scholar]
- 45.Pece S., Giuliani G., Di Leo A., Fumarola D., Antonaci S., Jirillo E. Recent Prog. Med. 1997;88:237–241. [PubMed] [Google Scholar]
- 46.Roux A., Beloin C., Ghigo J. M. J. Bacteriol. 2005;187:1001–1013. doi: 10.1128/JB.187.3.1001-1013.2005. [DOI] [PMC free article] [PubMed] [Google Scholar]
- 47.Nikaido H. In: Escherichia coli and Salmonella typhimurium: Cellular and Molecular Biology. NeidHardt F. C., Curtiss R., Ingraham J. L., Lin E. C. C., Low K. B., Magasanik B., Reznikoff W. S., Riley M., Schaecter M., Umbarger H. E., editors. Washington, DC: Am. Soc. Microbiol.; 1996. pp. 29–47. [Google Scholar]
- 48.Snyder J. A., Haugen B. J., Buckles E. L., Lockatell C. V., Johnson D. E., Donnenberg M. S., Welch R. A., Mobley H. L. Infect. Immun. 2004;72:6373–6381. doi: 10.1128/IAI.72.11.6373-6381.2004. [DOI] [PMC free article] [PubMed] [Google Scholar]
- 49.Batchelor E., Walthers D., Kenney L. J., Goulian M. J. Bacteriol. 2005;187:5723–5731. doi: 10.1128/JB.187.16.5723-5731.2005. [DOI] [PMC free article] [PubMed] [Google Scholar]
- 50.Bernardini M. L., Sanna M. G., Fontaine A., Sansonetti P. J. Infect. Immun. 1993;61:3625–3635. doi: 10.1128/iai.61.9.3625-3635.1993. [DOI] [PMC free article] [PubMed] [Google Scholar]
- 51.Heidrich C., Templin M. F., Ursinus A., Merdanovic M., Berger J., Schwarz H., de Pedro M. A., Holtje J. V. Mol. Microbiol. 2001;41:167–178. doi: 10.1046/j.1365-2958.2001.02499.x. [DOI] [PubMed] [Google Scholar]
- 52.Katayama T., Takata M., Sekimizu K. Mol. Microbiol. 1997;26:687–697. doi: 10.1046/j.1365-2958.1997.5941967.x. [DOI] [PubMed] [Google Scholar]
- 53.Nurse P., Levine C., Hassing H., Marians K. J. J. Biol. Chem. 2003;278:8653–8660. doi: 10.1074/jbc.M211211200. [DOI] [PubMed] [Google Scholar]
- 54.Weinberg E. D. Microbiol. Rev. 1978;42:45–66. doi: 10.1128/mr.42.1.45-66.1978. [DOI] [PMC free article] [PubMed] [Google Scholar]
- 55.Janke B., Dobrindt U., Hacker J., Blum-Oehler G. FEMS Microbiol. Lett. 2001;199:61–66. doi: 10.1111/j.1574-6968.2001.tb10651.x. [DOI] [PubMed] [Google Scholar]
- 56.Woodrow G. C., Young I. G., Gibson F. Biochim. Biophys. Acta. 1979;582:145–153. doi: 10.1016/0304-4165(79)90297-6. [DOI] [PubMed] [Google Scholar]
- 57.Zhang Z., Gerstein M. J. Biol. 2003;2:11.1–11.4. doi: 10.1186/1475-4924-2-11. [DOI] [PMC free article] [PubMed] [Google Scholar]
- 58.Wagner G. P., Fried C., Prohaska S. J., Stadler P. F. Mol. Biol. Evol. 2004;21:2116–2121. doi: 10.1093/molbev/msh221. [DOI] [PubMed] [Google Scholar]
- 59.Lee W., Chen S. L. BioTechniques. 2002;33:1334–1341. doi: 10.2144/02336bc04. [DOI] [PubMed] [Google Scholar]
- 60.Thompson J. D., Higgins D. G., Gibson T. J. Nucleic Acids Res. 1994;22:4673–4680. doi: 10.1093/nar/22.22.4673. [DOI] [PMC free article] [PubMed] [Google Scholar]
- 61.Sawyer S. Mol. Biol. Evol. 1989;6:526–538. doi: 10.1093/oxfordjournals.molbev.a040567. [DOI] [PubMed] [Google Scholar]
- 62.Felsenstein J. Cladistics. 1989;5:164–166. [Google Scholar]
- 63.Yang Z. Comput. Appl. Biosci. 1997;13:555–556. doi: 10.1093/bioinformatics/13.5.555. [DOI] [PubMed] [Google Scholar]
Associated Data
This section collects any data citations, data availability statements, or supplementary materials included in this article.