

Abstract
Inferring the origin, population structure, and demographic history of a species is a major objective of population genetics. Although many organisms have been analyzed, the genetic structures of subdivided populations are not well understood. Here we analyze Drosophila ananassae, a highly substructured, cosmopolitan, and human-commensal species distributed in the tropical, subtropical, and mildly temperate regions of the world. We adopt a multilocus approach (with 10 neutral loci) using 16 population samples covering almost the entire species range (Asia, Australia, and America). Analyzed with our recently developed Bayesian method, 5 populations in Southeast Asia are found to be central, while the other 11 are peripheral. These 5 central populations were sampled from localities that belonged to a single landmass (“Sundaland”) during the late Pleistocene (∼18,000 years ago), when sea level was ∼120 m below the present level. The inferred migration routes of D. ananassae out of Sundaland seem to parallel those of humans in this region. Strong evidence for a population size expansion is seen particularly in the ancestral populations.
PATTERNS of genetic variation within and between populations contain information about the origin, population structure, and demography of a species. To understand population differentiation and the forces influencing it, a useful approach is to analyze DNA sequence variation at multiple loci. This is motivated by the notion that population structure and demography affect the entire genome in a similar way, whereas other evolutionary forces (including selection) leave footprints at individual genes (Fu and Li 1999; Avise 2000). This approach has been used for several species, including humans (Frisse et al. 2001; Takahata et al. 2001), Drosophila (Schlötterer et al. 1997; Glinka et al. 2003), and the house mouse (Boissinot and Boursot 1997).
To varying degrees, genetic differentiation exists in every species. It influences the estimation of population genetic parameters and complicates the analysis of molecular variation. However, with simplified assumptions, considerable progress in modeling population subdivision has been made in recent years (e.g., Wakeley 2001). Using these methods, it is now possible to distinguish central (ancestral) from peripheral (derived) populations without applying phylogenetic methods (Vogl et al. 2003).
Drosophila ananassae is one of the very few Drosophila species with a cosmopolitan distribution and is present in most of the tropical, subtropical, and mildly temperate regions of the world (Tobari 1993). It lives in close association with humans throughout the entire species range (Dobzhansky 1970), being most abundant in South and Southeast (SE) Asia, including some southern islands of Japan, Polynesia, Australasian regions, and America (Futch 1966; Bock and Wheeler 1972; McEvey et al. 1987). This species has likely originated in SE Asia and subsequently dispersed to other parts of the world, possibly through human activity (Dobzhansky and Dreyfus 1943). Previous population genetic studies using DNA sequence polymorphism provided evidence for significant genetic structure in this species (Stephan et al. 1998). On the basis of these analyses, D. ananassae appears to be an excellent organism for analyzing population subdivision.
Here we adopt a multilocus approach using 16 populations covering almost the entire species range to infer the population structure of D. ananassae. Analyzing putatively neutral nuclear DNA sequence polymorphisms from 10 independent loci, we are able to distinguish between central and peripheral populations. We confirm the SE Asian origin of D. ananassae and delimit its ancestral species range to a region that was a well-connected single landmass (Sundaland) until the late Pleistocene [∼18,000 years ago (18 KYA)], when sea level was lower than today by ∼120 m. In addition, we study the demographic history of D. ananassae. While the central subpopulations deviate most clearly from the neutral, constant-size equilibrium model, the population as a whole appears to be expanding.
MATERIALS AND METHODS
Population samples and marker fragment identification:
We have sampled 160 isofemale lines from 16 locations in Asia, Australia, and America covering almost the entire species range of D. ananassae (Table 1). The abbreviated names of the sampling locations (as given in Table 1) are used throughout this article. Since information on genomic DNA is limited in D. ananassae and D. melanogaster is a closely related species with a completely known genome sequence, we used genomic information of the latter species to identify our marker fragments. We chose introns from random genes located in the normal- to high-recombination regions of the X chromosome of D. melanogaster and tested for amplification in D. ananassae. PCR primers were designed in exons flanking these introns. For each sequenced fragment, the DNA sequences of the flanking exons were aligned with those of the corresponding fragment of D. melanogaster. A fragment was used for further study if (i) exon parts at both ends were homologous to D. melanogaster, (ii) total length of the intron flanked by exons was 300–600 bp long, and (iii) at least five SNPs were present in a set of five sequences of a randomly chosen population sample. Nine fragments (termed L2–L10; see online supplementary Table 1 at http://www.genetics.org/supplemental/) of these specifications and a part of intron 1 of the Om(1D) gene (L1) located in the normal recombination region of the X chromosome of D. ananassae (Stephan et al. 1998) were used, bringing the total number of marker loci to 10. In a previous report, a subset of these data consisting of nine loci (L1–L9) and seven populations (BBS, BOG, CH, DAR, KATH, MAN, and PUR) was already published (Vogl et al. 2003).
TABLE 1.
Details of the population samples ofD. ananassae used in this study
| Sampling location | Coordinates (latitude, longitude) |
Country of origin |
Abbreviated sampling location |
No. of isofemale lines analyzed |
Yr of collection |
|---|---|---|---|---|---|
| Sao Paulo | 23:34 S, 46:38 W | Brazil | SAO | 6 | 1994 |
| Rio de Janeiro | 22:27 S, 42:43 W | Brazil | RIO | 7 | 2002 |
| Chennai | 13:00 N, 80:10 E | India | CH | 11 | 2000 |
| Kathmandu | 27:49 N, 85:21 E | Nepal | KATH | 11 | 2000 |
| Puri | 19:48 N, 85:52 E | India | PUR | 13 | 2000 |
| Bhubaneswar | 20:15 N, 85:52 E | India | BBS | 12 | 2000 |
| Mandalay | 22:00 N, 96:08 E | Myanmar | MAN | 10 | 1994 |
| Chiang Mai | 18:45 N, 98:58 E | Thailand | CNX | 10 | 2002 |
| Bangkok | 13:50 N, 100:29 E | Thailand | BKK | 10 | 2002 |
| Kuala Lumpur | 03:08 N, 101:42 E | Malaysia | KL | 10 | 2002 |
| Bogor, Java | 06:09 S, 106:51 E | Indonesia | BOG | 11 | 2001 |
| Kota Kinabalu, Borneo | 05:56 N, 116:03 E | Malaysia | KK | 10 | 2002 |
| Manila | 14:37 N, 121:00 E | Philippines | MNL | 10 | 2002 |
| Cebu | 10:18 N, 123:54 E | Philippines | CEB | 10 | 2002 |
| Kumejima, Okinawa | 26:21 N, 127:46 E | Japan | KMJ | 10 | 2000 |
| Darwin and Kakadu | 12:25 S, 130:50 E | Australia | DAR | 9 | 1995 |
DNA sequencing:
DNA was extracted from a single male from each isofemale line employing the PUREGENE DNA isolation kit (Gentra Systems, Minneapolis, MN). Details of the primer sequences and the PCR conditions are available from the authors on request. PCR products were purified with EXOSAP-IT (United States Biochemical, Cleveland, OH) and both strands were sequenced according to the protocol of the DYEnamic ET Terminator cycle sequencing kit (Amersham Biosciences, Buckinghamshire, UK) on an automated DNA sequencer (MegaBACE 1000; Amersham Biosciences). Sequences were edited with SeqMan and aligned with MegAlign (DNAStar, Madison, WI). Manual alignments were used when necessary. Insertion-deletion polymorphisms are not considered in our analysis and thus were removed from the sequences. Homologous fragments of all 10 loci were also sequenced from a single laboratory strain of D. pallidosa, a sibling species of D. ananassae, for estimating divergence. The DNA sequences reported in this article can be found in GenBank under accession nos. AY708657, AY710266.
Summary statistics of DNA sequence variation, neutrality tests, and linkage disequilibrium:
For each locus and population, we calculated the number of segregating sites, the number of haplotypes, and two summary statistics of intrapopulational nucleotide diversity: θw (Watterson 1975), based on the number of segregating sites in the sample, and π (Nei 1987), the average number of pairwise differences per site. Assuming the standard neutral model of a random-mating population of constant size, both summary statistics estimate the population mutation parameter θ = 3Neμ (for X-linked loci), where Ne is the effective population size and μ the mutation rate per generation per site. Divergence (κ) between D. ananassae and its sibling species D. pallidosa was estimated for each locus and averaged over loci for each population. The program DnaSP, version 3.50 (Rozas and Rozas 1999), was used to estimate these parameters; all values are summarized in the online supplementary Table 2 (http://www.genetics.org/supplemental/).
TABLE 2.
DNA variation and summary statistics
| Mean nucleotide diversity |
Multilocus linkage disequilibrium |
Multilocus HKA test |
Multilocus Tajima's D test
|
Multilocus Fu and Li's D test
|
|||||||||||||||
|---|---|---|---|---|---|---|---|---|---|---|---|---|---|---|---|---|---|---|---|
| Mean D
|
Variance D
|
Mean D
|
Variance D
|
||||||||||||||||
| Pop. | π | θw | Div.: κ |
IA | P | X2 | P | Obs. | Sim. | % higher | Obs. | Sim. | % higher | Obs. | Sim. | % higher | Obs. | Sim. | % higher |
| SAO | 0.0027 | 0.0030 | 0.0142 | 0.8867 | 0.04* | 4.868 | 0.676 | −0.419 | −0.036 | 84.64 | 0.874 | 0.926 | 53.20 | 0.305 | −0.064 | 22.05 | 0.717 | 1.076 | 75.93 |
| RIO | 0.0024 | 0.0025 | 0.0146 | −0.2113 | 0.73 | 5.232 | 0.632 | −0.116 | −0.029 | 58.63 | 0.975 | 0.944 | 44.59 | −0.047 | −0.056 | 50.27 | 1.235 | 1.142 | 38.63 |
| CH | 0.0062 | 0.0065 | 0.0147 | 1.0562 | 0.001* | 9.121 | 0.426 | −0.188 | −0.065 | 65.59 | 1.160 | 0.878 | 20.97 | −0.509 | −0.079 | 90.06 | 1.302 | 1.017 | 23.12 |
| KATH | 0.0063 | 0.0075 | 0.0140 | 0.4747 | 0.047* | 2.874 | 0.969 | −0.657 | −0.061 | 97.77* | 1.264 | 0.890 | 14.75 | −0.505 | −0.077 | 89.90 | 1.250 | 1.017 | 26.67 |
| PUR | 0.0057 | 0.0068 | 0.0147 | 0.1745 | 0.17 | 5.992 | 0.741 | −0.510 | −0.061 | 93.22 | 0.426 | 0.877 | 91.24 | −0.298 | −0.070 | 76.05 | 0.794 | 1.014 | 66.50 |
| BBS | 0.0074 | 0.0074 | 0.0147 | 0.3139 | 0.08 | 5.138 | 0.822 | 0.020 | −0.061 | 38.86 | 0.856 | 0.878 | 48.15 | 0.129 | −0.071 | 26.65 | 1.065 | 1.010 | 40.26 |
| MAN | 0.0062 | 0.0076 | 0.0150 | 0.4431 | 0.07 | 8.226 | 0.512 | −0.398 | −0.054 | 87.37 | 0.758 | 0.884 | 60.82 | −0.480 | −0.073 | 89.16 | 1.533 | 1.009 | 10.16 |
| CNX | 0.0070 | 0.0071 | 0.0139 | 1.1784 | 0.001* | 3.251 | 0.953 | −0.334 | −0.055 | 81.71 | 0.786 | 0.886 | 57.56 | −0.029 | −0.073 | 45.69 | 1.501 | 1.031 | 13.12 |
| BKK | 0.0108 | 0.0118 | 0.0142 | 0.3837 | 0.38 | 4.653 | 0.863 | −0.572 | −0.057 | 96.26* | 0.204 | 0.863 | 99.51* | −0.552 | −0.077 | 92.65 | 0.323 | 0.991 | 97.92* |
| KL | 0.0094 | 0.0107 | 0.0147 | −0.0833 | 0.64 | 4.174 | 0.900 | −0.676 | −0.063 | 98.25* | 0.544 | 0.857 | 80.83 | −0.928 | −0.079 | 99.41* | 0.811 | 0.986 | 63.90 |
| BOG | 0.0113 | 0.0138 | 0.0161 | −0.0930 | 0.69 | 2.482 | 0.981 | −0.878 | −0.071 | 99.75* | 0.231 | 0.841 | 98.78* | −0.823 | −0.092 | 98.68* | 0.499 | 0.977 | 90.30 |
| KK | 0.0124 | 0.0135 | 0.0156 | −0.2527 | 0.97 | 1.961 | 0.992 | −0.446 | −0.065 | 90.65 | 0.664 | 0.839 | 66.59 | −0.167 | −0.089 | 60.34 | 1.340 | 0.984 | 14.83 |
| MNL | 0.0114 | 0.0133 | 0.0153 | −0.0413 | 0.57 | 4.499 | 0.876 | −0.590 | −0.060 | 96.67* | 0.401 | 0.844 | 91.93 | −0.744 | −0.084 | 97.88* | 1.055 | 0.977 | 37.72 |
| CEB | 0.0112 | 0.0118 | 0.0150 | 0.5482 | 0.01* | 1.997 | 0.992 | −0.274 | −0.065 | 75.78 | 0.332 | 0.853 | 95.72* | 0.011 | −0.084 | 38.99 | 0.702 | 0.977 | 74.35 |
| KMJ | 0.0059 | 0.0046 | 0.0134 | −0.0136 | 0.50 | 8.097 | 0.524 | 0.115 | −0.054 | 29.05 | 1.324 | 0.885 | 11.53 | 0.170 | −0.0752 | 4.08 | 0.891 | 1.035 | 60.07 |
| DAR | 0.0098 | 0.0099 | 0.0161 | 0.1653 | 0.24 | 7.221 | 0.614 | −0.192 | −0.060 | 66.71 | 0.298 | 0.866 | 97.73* | 0.064 | −0.087 | 32.88 | 0.669 | 0.999 | 79.22 |
Pop., population; Div., divergence; IA, index of association; P, probability; X2, HKA test statistic; Obs., observed; Sim., simulated; % higher, percentage of simulated values higher than the observed ones; *, a statistically significant result.
To test the standard neutral equilibrium model, we calculated Tajima's D-statistic (Tajima 1989) and Fu and Li's D-statistic (Fu and Li 1993) for each locus and population separately. Tajima's D-statistic considers the normalized difference between the estimates of π and θw. Under the standard neutral model, Tajima's D is roughly equal to zero. So any deviation from zero would indicate a skew in the allele frequency spectrum. Fu and Li's D test is based on the difference between the total number of polymorphic sites and the number of derived singletons (polymorphisms appearing only once in the sample).
In addition, we employed the multilocus versions of the Hudson-Kreitman-Aguadé (HKA) and Tajima's D and Fu and Li's D tests (Hudson et al. 1987; Tajima 1989; Fu and Li 1993). These three tests were done using the program HKA, kindly provided by J. Hey (http://lifesci.rutgers.edu/heylab), in which the test statistics are compared with the distributions generated from 10,000 coalescent simulations (Kliman et al. 2000; see also Frisse et al. 2001).
The index of association (IA), a measure of linkage disequilibrium for multiple loci (Brown et al. 1980; Haubold et al. 1998), was estimated by pairwise comparison of haplotypes using each population separately. It essentially tests to what extent individuals that are identical (or different) at one locus are more likely to be identical (or different) at the other loci. To examine whether an observation deviates significantly from the hypothesis of no linkage disequilibrium among loci, the observed value was compared to the results of 10,000 randomized data sets. The program MultiLocus, version 1.3 (Agapow and Burt 2001), was used for both estimation and randomization.
Distinguishing the central from peripheral populations and inferring population structure:
We used a coalescence-based Bayesian approach implemented through a Markov chain Monte Carlo (MCMC) integration method to distinguish central from more peripheral populations of D. ananassae (Vogl et al. 2003). This novel method evaluates for each population the degree of differentiation (Θp) from a reconstructed migrant pool. The reconstruction of the migrant pool is based on the assumption of a large number of demes between which migrants are exchanged according the island model (Wright 1969). Wakeley (2001) has shown that in such a model the coalescent can be partitioned into a “scattering phase” (in which coalescences within demes occur on a relatively fast time scale) and into a slower “collecting phase” (in which the coalescences between islands occur). The migrant pool is reconstructed on the basis of the slow dynamics (see Appendix in Vogl et al. 2003). The parameter Θp for each population (henceforth called migration-drift parameter) takes small values (close to zero) if the population shows little differentiation from the migrant pool and large values (close to one) if differentiation is strong.
We also applied an individual-based analysis of population structure using a clustering algorithm implemented in the program Structure (Pritchard et al. 2000). Our data set consisted of the haplotype frequencies for each of the 10 loci. We performed 10–20 runs for each K value. A burn-in period of 50,000 generations and MCMC simulations of 100,000 iterations were used. We ran the program assuming the no-admixture model with values of K ranging from 2 to 10. Highest posterior probabilities with consistent and meaningful genetic clusters in relation to the geographic locations of the populations were obtained with K = 7. To confirm the results obtained with Structure, we followed an FST-based approach (Weir and Cockerham 1984). Since it has been suggested that genetic distances measured by FST generate reliable tree topologies (Cavalli-Sforza and Feldman 2003), FST estimates between pairs of populations were used as genetic distances to obtain an unrooted neighbor-joining (NJ) population tree (Saitou and Nei 1987), employing the program MEGA version 2 (Kumar et al. 2001). To determine the strength of support for the internal branches, 1000 bootstrap trees were generated using the BioNJ computer program (Gascuel 1997).
RESULTS
DNA polymorphism, divergence, and linkage disequilibrium:
Combining all 10 loci, we sequenced 4070 bp per individual and ∼651 kb in total (160 lines). The total length of individual loci ranges from 371 to 487 bp. We found 529 SNPs, of which 219 were recorded only once in the sample. As only two variants were detected at each polymorphic site, our data fit the infinite-site mutation model (Kimura 1969). The number of haplotypes at individual loci varies from 23 to 101. The number of segregating sites per locus is lowest in the two Brazilian populations (<3) and highest in SE Asia and Australia (>11). In India, Nepal, Myanmar, northern Thailand, and Japan, an intermediate number of segregating sites wasfound (varying from <7 to 9). In five of the SE Asian populations (BOG, BKK, KL, KK, and MNL), almost every sequenced individual X chromosome represents a separate haplotype for most of the highly polymorphic loci. In DAR and CEB (geographically close to the five SE Asian locations mentioned above), the number of segregating sites is relatively high, but not the number of haplotypes (5–6 vs. >7 in the five SE Asian populations). In CNX, some high-frequency haplotypes that are rare or entirely absent in other populations were observed. Mean nucleotide diversity π varies from 0.0024 (RIO) to 0.0124 (KK; Table 2). The two Brazilian populations have the lowest, whereas samples from the six SE Asian localities (BKK, KL, BOG, KK, MNL, and CEB) and DAR show the highest levels of nucleotide diversity (ranging from 0.0094 to 0.0124). The samples from India, Nepal, Myanmar, northern Thailand, and Japan have intermediate levels of diversity (0.0059 in KMJ to 0.0074 in BBS). Nucleotide diversity measured by θw shows exactly the same pattern, but the values are somewhat higher than the corresponding π values (except for those in RIO and BBS). The means of π and θw over all populations are 0.0079 and 0.0089, respectively.
Over all 10 loci, there were only 12 fixed nucleotide differences between D. ananassae and its sibling species D. pallidosa. Per-site divergence averaged over all loci and populations was found to be very low (1.48%), with no remarkable variation among samples (Table 2). Mean divergence is less than half of the value (3.2%) previously reported for Om(1D) (Stephan et al. 1998).
As shown in Table 2, the multilocus linkage disequilibrium (IA) values for the five SE Asian populations (BKK, KL, BOG, KK, and MNL) are close to zero and not statistically significant. For 9 of the other 11 populations, IA values are high, and for 5 populations (SAO, CH, KATH, CNX, and CEB), the values are statistically significant.
Distinguishing central from peripheral populations and inferring population structure:
To distinguish central from more peripheral populations, we followed the method of Vogl et al. (2003)(see materials and methods). The mean migration-drift parameter (Θp) takes much lower values for the five SE Asian populations (BKK, KL, BOG, KK, and MNL) than for the rest of the populations (Figure 1). RIO has the highest value of Θp, followed by SAO, KMJ, and CNX. The Indian populations have intermediate values. DAR has an intermediate value as well, although it is in close geographic proximity to these five SE Asian populations. Similarly, CEB and CNX have relatively high values of Θp, despite being geographically close to the five SE Asian populations with very low values of Θp. This is consistent with our previous analysis of a subset of the present data (nine loci, seven populations) where BOG had the lowest Θp value (Vogl et al. 2003).
Figure 1.—

Histogram of the mean Θp values of 16 population samples. The populations are ordered from west to east. The abbreviations of the sampling locations are explained in Table 1.
Using the program Structure, seven different genetic clusters could be identified. There are six distinct, almost homogeneous clusters distributed across specific, well-separated geographic locations (Figure 2). The two Brazilian samples form a separate cluster. The Indian samples (PUR, BBS, and CH) with KATH and MAN form another. However, ∼30% of the ancestry of MAN is shared with the homogeneous KMJ cluster. DAR also forms a distinct, nearly homogeneous cluster. CNX and CEB form two distinct clusters. While CNX was found to be totally homogeneous, CEB shows some heterogeneity. In contrast to these subpopulations with (nearly) homogeneous clusters, individuals from the five SE Asian localities (BKK, KL, BOG, KK, and MNL) were found to consist of a mixture of all six clusters, thus representing a pool of diverse genetic ancestries. Another (seventh) cluster was found in these five populations at a high proportion. This cluster, unlike the other six, did not contribute >50% to any of the populations and was also found in small proportions in all three Indian samples, CEB, and DAR. The frequency of this cluster seems to decline with distance from SE Asia (Figure 2).
Figure 2.—
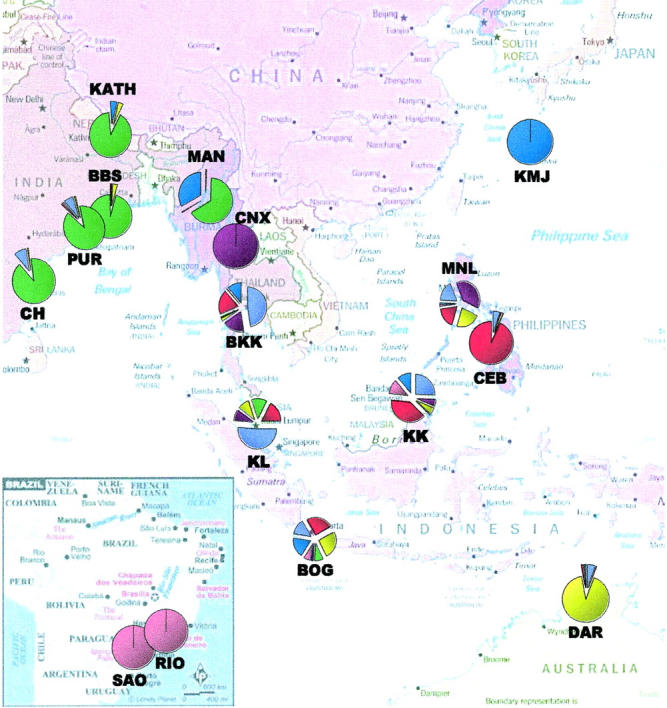
Pie chart of combined genetic ancestries of all individuals sampled in each population, as obtained from Structure (Pritchard et al. 2000). The seven different colors correspond to seven different genetic clusters.
A similar clustering was observed in the NJ population tree analysis (Figure 3). The Indian populations (PUR, BBS, and CH), along with KATH and MAN, seem to have a close genetic affinity with DAR from Australia. However, most of the internal branches of the NJ tree have little bootstrap support except for the SAO-RIO separation from the rest of the samples (97.7%), suggesting that the two Brazilian populations are significantly differentiated from the others. Interestingly, the population tree has a typical star-like topology with long external and short internal branches (Figure 3). The most interesting feature of the population tree is that the five SE Asian samples show high levels of genetic similarity among each other. The highest FST value was 0.049 between BOG and KK, which is roughly similar to the FST estimates between the two geographically closest populations in the present study, BBS and PUR (FST = 0.044).
Figure 3.—
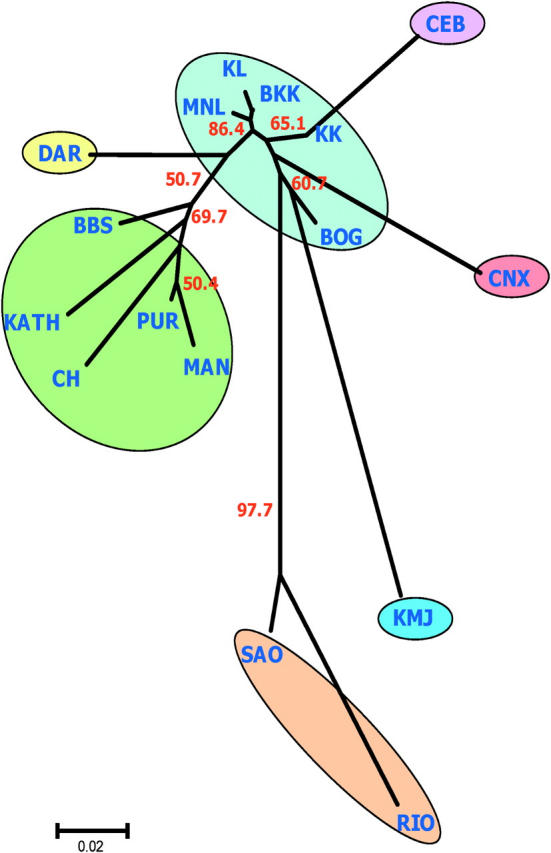
Unrooted neighbor-joining (NJ) population tree describing genetic relationships among populations. Bootstrap percentages (number in red) based on 1000 bootstrap runs are shown when the support for the internal nodes is >50%. Each colored circle represents a cluster congruent with the Structure analysis in Figure 2. Color coding is consistent with the pie diagram of Figure 2.
Neutrality tests:
We tested our data for compatibility with the neutral equilibrium model. The HKA test was used to determine whether the levels of intraspecific polymorphism and interspecific divergence at our set of fragments are consistent with the equilibrium model (Hudson et al. 1987). A multilocus version of the original HKA test was applied to all 10 loci. No significant departure from the equilibrium model was detected in any of the populations (Table 2). Thus, there appears to be no evidence for the action of past selection at these loci.
Tajima's D-statistic has been shown to be sensitive to the demographic history (Tajima 1989) and utilized in previous population genetic studies to test the neutral equilibrium model in humans and D. melanogaster (Frisse et al. 2001; Glinka et al. 2003). Except for a few cases, the single-locus Tajima's D-values are negative but not statistically significant (supplementary Table 2). In all samples except BBS and KMJ, negative mean D-values were obtained (Table 2). In KATH, BKK, KL, BOG, and MNL, observed mean values are significantly different from the equilibrium expectation, suggesting that these populations do not fit the neutral equilibrium model. Similarly, the observed variances of Tajima's D across the 10 loci are lower than the expectation under neutrality for the majority of the samples (Table 2). Very similar results were observed for the single-locus Fu and Li's D test as most of the D-values are negative but very few show a statistically significant departure from the equilibrium expectation (data not shown). The mean Fu and Li's D-values across all 10 loci (Table 2) in 11 populations (except SAO, BBSR, DAR, CEB, and KMJ) were negative but statistically significant in only 3 (KL, BOG, and MNL), suggesting an excess of singletons in most of the populations. The observed variances across loci were not consistent among populations; a significantly lower variance was observed in BKK.
DISCUSSION
Patterns of polymorphism and divergence:
The levels of nucleotide diversity, the number and frequency of haplotypes, and the amount of linkage disequilibrium vary widely among the 16 populations analyzed. In comparison to previous studies of two neutral loci [Om(1D) and forked], with samples from India, Nepal, Myanmar, and Brazil (Stephan 1989; Stephan and Langley 1989; Stephan et al. 1998), the present analysis finds generally lower estimates of nucleotide diversity. It is possible that our approach of identifying DNA fragments with conserved D. melanogaster primers contributed to this bias.
The six SE Asian samples (BKK, KL, BOG, KK, MNL, and CEB) show the highest levels of nucleotide diversity. Furthermore, a very low level of linkage disequilibrium was found in these populations (except CEB), whereas relatively high values were observed in many of the other 10 populations. High levels of diversity and low amounts of linkage disequilibrium are characteristic features of ancestral populations, whereas low levels of diversity and high amounts of linkage disequilibrium are expected in recently established populations (Jorde et al. 2001).
In contrast to polymorphism, divergence between D. ananassae populations and its sibling species D. pallidosa is remarkably constant across loci (and relatively low). The latter observation is consistent with the notions that (i) the separation of these two species has been a recent event in the speciation history of the melanogaster group (Bock and Wheeler 1972) and (ii) no apparent postmating isolation has developed between these two species as hybrids and their progenies can be produced in the laboratory (Doi et al. 2001). As in the case of polymorphism, the fact that the estimates of divergence are lower than those in a previous study (Stephan et al. 1998) may be attributable to our experimental approach using conserved D. melanogaster primers (see above).
Sundaland—the center of the ancestral D. ananassae population:
Similar to previous observations with different molecular markers (Johnson 1971; Stephan 1989; Stephan and Langley 1989; Stephan et al. 1998), the present results suggest that populations of D. ananassae are highly structured. Seven different genetic clusters were identified. While 11 subpopulations correspond to six distinct clusters (Figure 2), 5 samples from SE Asia (BKK, KL, BOG, KK, and MNL) do not correspond to any of these clusters. Instead, these 5 subpopulations are mixtures of all seven clusters and also genetically close to each other (Figures 2 and 3). Furthermore, the migration-drift parameter (Θp) has by far the lowest values in these five samples, indicating that these populations are likely part of the ancestral species range of D. ananassae. This is consistent with the results that these 5 samples have the highest nucleotide diversity, highest number of haplotypes, and low levels of linkage disequilibrium. In contrast, the other 11 samples are clearly peripheral. Our previous analysis of a subset of the present data (Vogl et al. 2003) was not able to delimit the ancestral range of D. ananassae because too few locations in SE Asia were sampled. Of the present 5 ancestral samples, BOG was the only one analyzed by Vogl et al. (2003). On the basis of an extensive sampling in SE Asia, the present study provides a much clearer picture of the evolutionary history of this species.
Although presently isolated by sea, these five populations were part of a single large landmass (Sundaland) comprising the lands on the Sunda Shelf (Johnson 1964; Vane-Wright 1990; Figure 4). During most of the glaciation periods in the late Pleistocene ∼18 KYA (Shackleton 2000), this landmass was above the sea when sea level was ∼120 m below the present level. Although the landmass of the northern Philippines (MNL) was not part of Sundaland, it was connected to Sundaland via Greater Palawan (Figure 4). Similarly, Greater Mindanao in the southern Philippines was connected to Sundaland through Greater Sulu. Biogeographic studies show that the Philippines were mainly colonized from Borneo through the Palawan or the Sulu Archipelago (Heaney 1985; De Jong 1996). Also, the flora and fauna from Sundaland were found to be dispersed within the Philippines during the Pleistocene when sea level fluctuations provided the most recent opportunity for a simplified overland faunal exchange throughout SE Asia (Dickinson 1991). Thus, these five subpopulations apparently belonged to a single large population in the recent past representing the ancestral population of D. ananassae.
Figure 4.—
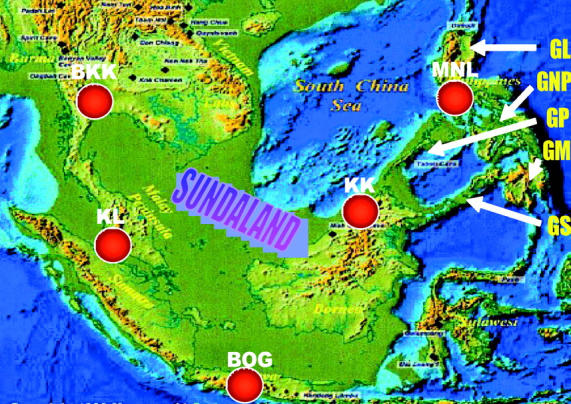
SE Asia during the height of the last Ice Age some 18 KYA. The map shows the maximum extent of dry land exposed by the lowering of the sea level in and around Sundaland. Red dots correspond to the location of the five sampling sites of the ancestral D. ananassae populations. GL, Greater Luzon; GNP, Greater Negros-Panay; GP, Greater Palawan; GM, Greater Mindanao; GS, Greater Sulu.
On the basis of several analyses summarized in Figures 1–3, the other 11 subpopulations were found to be peripheral and derivatives of Sundaland. Our results can therefore be used to reconstruct the migration routes out of Sundaland. Since a portion of the Brazilian ancestry is distributed in some Sundaland samples (KK and BOG; Figure 2), it appears that Brazil may have been colonized by flies from SE Asia. Similarly, KMJ is genetically close to BOG. The five Indian subcontinental populations form a single genetic cluster and are peripheral, suggesting an initial colonization with a large number of individuals and/or multiple colonizations. The latter seems more plausible for the three Indian samples because of the presence of the seventh cluster in these populations. Furthermore, it is known that Papua New Guinea was joined with Australia, forming a single landmass (called Sahul Land) at the same time when Sundaland existed. During this time, the distances between neighboring islands were probably reduced to 30–90 km (Klein 1989). It has been suggested that Papua New Guinea was colonized by cosmopolitan D. ananassae directly from Indonesia (Tobari 1993). In fact, the portion of DAR ancestry present in BOG and the presence of the seventh cluster in Australia might have been due to direct immigration from Sundaland.
Most interesting is the sample from Cebu (CEB), a small island located in the center of the Philippine Archipelago. During the late Pleistocene, Cebu was an almost-isolated part of Greater Negros-Panay (Figure 4). Since KK is genetically close to CEB, it is plausible that the colonization of CEB occurred from Borneo through one of the two land routes (see above), such as through Greater Sulu via Greater Mindanao. This is further supported by the fact that MNL is genetically more distant from CEB than is KK and by the presence of the seventh cluster. Since Cebu was only loosely connected to Greater Negros-Panay, this might have led to a relative genetic endemism of CEB.
The sample from CNX is comparatively less variable (Table 2), clearly peripheral (Figure 1), and characterized by several high-frequency haplotypes. Northern Thailand has a typical monsoon climate with marked seasonal temperature variations, causing population shrinkage in winter and reemergence in summer. Such population bottlenecks are expected to increase linkage disequilibrium (Reich et al. 2001) and to greatly reduce polymorphism. Furthermore, CNX does not share genetic ancestry with its geographically close population, MAN. It is possible that high mountains (bordering Thailand and Myanmar) might be geographical barriers to gene flow between these two populations.
Genetic differentiation was found to correlate significantly with geographic distance when all populations were considered (r = 0.75, P < 0.0001). When the two Brazilian samples were excluded, the correlations are still positive and statistically significant (r = 0.34, P < 0.003). This indicates the important role of gene flow after D. ananassae moved out of Sundaland. As expected on the basis of a model of radial migration from a center, the correlation becomes much tighter when only comparisons between peripheral populations and a central population (KK) are considered (r = 0.66, P < 0.03). Thus a recent divergence of the Sundaland populations and migration out of Sundaland with possible gene flow between populations may be a reasonable explanation for this observed isolation-by-distance effect. Correlations of genetic differentiation and geographic distance, even over short distances, are commonly observed in many other organisms including Arabidopsis, humans, and D. melanogaster (Sharbel et al. 2000; Cavalli-Sforza and Feldman 2003; Kennington et al. 2003).
Evidence for population size expansion:
Since it is unlikely that natural selection has substantially affected DNA sequence variation in recent history in any of the fragments and populations analyzed here, the observed departure from the neutral equilibrium model in some populations is more appropriately explained by migration and demographic processes such as past events of population expansion and/or bottlenecks (Slatkin and Hudson 1991; Fay and Wu 1999). Surprisingly, four of the five SE Asian populations (BKK, BOG, KL, and MNL) that are considered ancestral and central (see above) do not fit a constant-population size model with respect to the mean and/or the variance of Tajima's D. Negative values of D indicate an excess of rare variants relative to the standard neutral model, suggesting population growth (Tajima 1989). Similarly, the mean Fu and Li's D-values were negative in all five populations and statistically significant for BOG, KL, and MNL, suggesting a significant excess of singletons. A population size expansion of an ancestral population was also observed recently in D. melanogaster (Glinka et al. 2003). In contrast, in humans and D. simulans the ancestral African populations analyzed seem to fit the neutral equilibrium model although negative Tajima's D-values were found at individual loci (Hamblin and Veuille 1999; Pluzhnikov et al. 2002).
Of the 11 more peripheral populations, only KATH shows a significantly negative value of Tajima's D. However, the observed variance is higher than expected under the standard neutral model. Under a model of simple population growth, the variance of Tajima's D is expected to be lower (as observed in most of the central populations). Thus, it is likely that a more complex demographic model (including migration) may explain the data for KATH. Since the Tajima's D-values of most of the other peripheral populations are negative (with a lower variance), it appears that the D. ananassae population as a whole is expanding. This is further supported by the predominantly short internal and long external branches in the population tree (Figure 3). Our observation that not all peripheral populations show strongly negative values of Tajima's D may be due to the fact that several confounding processes occur simultaneously. For example, population subdivision, admixture, and bottlenecks (including founder events) would cause an excess of alleles of intermediate frequency leading to higher Tajima's D-values. On the other hand, population expansion would produce an excess of rare alleles and hence lower Tajima's D-values. Thus, in combination, these effects may influence each other. Similarly, levels of linkage disequilibrium are expected to be low under a model of population growth but high in the presence of population subdivision and admixture (Pritchard and Przeworski 2001). However, unlike in the ancestral populations, the mean Fu and Li's D-values were not significant in any of the peripheral populations although negative values were generally seen. Thus, the observed high proportion of rare alleles in the peripheral populations of D. ananassae provides evidence for old bottleneck events in the process of foundation of these populations (Simonsen et al. 1995) out of Sundaland followed by expansion. Taken together, our observations reflect a signature of a species-wide demographic expansion in D. ananassae, modulated by other population-specific demographic processes (e.g., old bottlenecks in the peripheral population and simple expansion events in the central populations).
Parallel evolutionary history with humans:
Since D. ananassae is frequently found in domestic habitats and lives in close association with humans (Dobzhansky 1970), further insights into the evolutionary history of this species might be gained in the context of human evolution. The first entry of modern humans into Asia occurred between 40 and 60 KYA (Cavalli-Sforza and Feldman 2003) and was followed by a northward (reaching China, Japan, and eventually America) and southward (through Malaysia and Indonesia, reaching Polynesia) migration that coincided with the receding glaciers in that area (Jin and Su 2000; Stringer 2000). The first humans probably arrived in the Americas ∼11–12 KYA (Dillehay 2003). Furthermore, mainland SE Asian humans served as a pool of genetic (Roberts-Thomson et al. 1996; Ballinger et al. 2000; Su et al. 2000) and dentition pattern (Turner 1987) diversity among SE Asian, Polynesian, and Australasian humans. Thus, the pattern of human diversity and migration in these regions seems parallel to those inferred for D. ananassae. Even though there are no historical data to evaluate the distribution of D. ananassae when it initially came in contact with humans, parallels in population history indicate that D. ananassae might have become associated with modern humans after the latter settled in mainland SE Asia and that both moved out of SE Asia simultaneously. Extensive trading of commercial goods by humans over the sea route between SE Asia and India was common practice during the recent past. Also, in agreement with Huxley's hypothesis (Huxley 1870), recent genetic data (Redd and Stoneking 1999; Redd et al. 2002) support human gene flow between the Indian subcontinent and Australia. This may explain the close genetic affinity of Indian and Australian D. ananassae (Figure 3). The observations fit the notion that D. ananassae accomplished its present cosmopolitan or quasi-cosmopolitan distribution with man's aid (Tobari 1993). Geographic subdivision (Agostini et al. 1997) and parallel evolutionary history (Cavalli-Sforza and Feldman 2003) are common in several human parasites and commensals.
Acknowledgments
We are thankful to C. Vogl for help in data analyses and to all members of the Evolutionary Biology group at the Ludwig-Maximilians University (LMU), Munich, for providing valuable input and discussion. Special thanks go to T. Städler, S. Mousset, M. Veuille, and two anonymous reviewers for critical comments and suggestions that helped improve the manuscript greatly; to D. De Lorenzo for sharing the primer sequences; and to J. F. Baines for collaboration. T. Feldmaier-Fuchs provided excellent technical support. M. Matsuda and J. R. David kindly provided several fly stocks used in this study. U. Arunyawat, S. G. Tan, and M. Sanchez helped during the fieldwork in Thailand, Malaysia, and the Philippines, respectively. This work was financially supported by the Deutsche Forschungsgemeinschaft (Ste 325/4) and the LMU Munich.
References
- Agapow, P.-M., and A. Burt, 2001. Indices of multilocus linkage disequilibrium. Mol. Ecol. Notes 1: 101–102. [Google Scholar]
- Agostini, H. T., R. Yanagihara, V. Davis, C. F. Ryschkewitsch and G. L. Stoner, 1997. Asian genotypes of JC virus in Native Americans and in a Pacific Island population: markers of viral evolution and human migration. Proc. Natl. Acad. Sci. USA 94: 14542–14546. [DOI] [PMC free article] [PubMed] [Google Scholar]
- Avise, J. C., 2000 Phylogeography. Harvard University Press, Cambridge, MA.
- Ballinger, S. W., T. G. Schurr, A. Torroni, Y. Y. Gan, J. A. Hodge et al., 2000. Southeast Asian mitochondrial DNA analysis reveals genetic continuity of ancient Mongoloid migrations. Genetics 130: 139–152. [DOI] [PMC free article] [PubMed] [Google Scholar]
- Bock, I. R., and M. R. Wheeler, 1972. The Drosophila melanogaster species group. Univ. Texas Publ. 7213: 1–102. [Google Scholar]
- Boissinot, S., and P. Boursot, 1997. Discordant phylogeographic patterns between the Y chromosome and mitochondrial DNA in the house mouse: Selection on the Y chromosome? Genetics 146: 1019–1034. [DOI] [PMC free article] [PubMed] [Google Scholar]
- Brown, A. H. D., M. W. Feldman and E. Nevo, 1980. Multilocus structure of natural populations of Hordeum spontaneum. Genetics 96: 523–536. [DOI] [PMC free article] [PubMed] [Google Scholar]
- Cavalli-Sforza, L., and M. W. Feldman, 2003. The application of molecular genetic approaches to the study of human evolution. Nat. Genet. 33(Suppl.): 266–275. [DOI] [PubMed] [Google Scholar]
- De Jong, R., 1996. The continental Asian element in the fauna of the Philippines as exemplified by Coladenia Moore, 1881 (Lepidoptera: Hesperiidae). Cladistics 12: 323–348. [DOI] [PubMed] [Google Scholar]
- Dickinson, E. C., 1991 Biogeography of Philippines birds, pp. 24–46 in The Birds of the Philippines, edited by E. C. Dickinison, R. S. Kennedy and K. C. Parkes. British Ornithologists' Union, Tring, UK.
- Dillehay, T., 2003. Tracking the first Americans. Nature 425: 23–24. [DOI] [PubMed] [Google Scholar]
- Dobzhansky, T., 1970 Genetics of the Evolutionary Process. Columbia University Press, New York.
- Dobzhansky, T., and A. Dreyfus, 1943. Chromosomal aberrations in Brazilian Drosophila ananassae. Proc. Natl. Acad. Sci. USA 29: 301–305. [DOI] [PMC free article] [PubMed] [Google Scholar]
- Doi, M., M. Matsuda, M. Tomaru, H. Matsubayashi and Y. Oguma, 2001. A locus for female discrimination behavior causing sexual isolation in Drosophila. Proc. Natl. Acad. Sci. USA 98: 6714–6719. [DOI] [PMC free article] [PubMed] [Google Scholar]
- Fay, J. C., and C.-I Wu, 1999. A human population bottleneck can account for the discordance between patterns of mitochondrial versus nuclear DNA variation. Mol. Biol. Evol. 16: 1003–1005. [DOI] [PubMed] [Google Scholar]
- Frisse, L. R., R. Hudson, A. Bartoszewicz, J. D. Wall, J. Donfack et al., 2001. Gene conversion and different population histories may explain the contrast between polymorphism and linkage disequilibrium levels. Am. J. Hum. Genet. 69: 831–843. [DOI] [PMC free article] [PubMed] [Google Scholar]
- Fu, Y.-X., and W. H. Li, 1993. Statistical tests of neutrality of mutations. Genetics 133: 693–709. [DOI] [PMC free article] [PubMed] [Google Scholar]
- Fu, Y.-X., and W. H. Li, 1999. Coalescing into the 21st century: an overview and prospects of coalescent theory. Theor. Popul. Biol. 56: 1–10. [DOI] [PubMed] [Google Scholar]
- Futch, D. G., 1966. A study of speciation in South Pacific populations of Drosophila ananassae. Univ. Texas Publ. 6615: 79–120. [Google Scholar]
- Gascuel, O., 1997. BIONJ: an improved version of the NJ algorithm based on a simple model of sequence data. Mol. Biol. Evol. 14: 685–695. [DOI] [PubMed] [Google Scholar]
- Glinka, S., L. Ometto, S. Mousset, W. Stephan and D. De Lorenzo, 2003. Demography and natural selection have shaped genetic variation in Drosophila melanogaster: a multilocus approach. Genetics 165: 1269–1278. [DOI] [PMC free article] [PubMed] [Google Scholar]
- Hamblin, M. T., and M. Veuille, 1999. Population structure among African and derived populations of Drosophila simulans: evidence for ancient subdivision and recent admixture. Genetics 153: 305–317. [DOI] [PMC free article] [PubMed] [Google Scholar]
- Haubold, B., M. Travisano, P. B. Rainey and R. R. Hudson, 1998. Detecting linkage disequilibrium in bacterial populations. Genetics 150: 1341–1348. [DOI] [PMC free article] [PubMed] [Google Scholar]
- Heaney, L. R., 1985. Zoogeographic evidence for middle and late Pleistocene land bridges to the Philippines islands. Mod. Quat. Res. Southeast Asia 9: 127–165. [Google Scholar]
- Hudson, R. R., M. Kreitman and M. Aguadé, 1987. A test of neutral molecular evolution based on nucleotide data. Genetics 116: 153–159. [DOI] [PMC free article] [PubMed] [Google Scholar]
- Huxley, T. H., 1870. On the geographical distribution of the chief modifications of mankind. Ethnol. Soc. J. Lond. 2: 404–412. [Google Scholar]
- Jin, L., and B. Su, 2000. Natives or immigrants: modern human origin in East Asia. Nat. Rev. Genet. 1: 126–133. [DOI] [PubMed] [Google Scholar]
- Johnson, D. S., 1964. A question of nomenclature. Malay. Nat. J. 18: 68–69. [Google Scholar]
- Johnson, F. M., 1971. Isozyme polymorphisms in Drosophila ananassae: genetic diversity among isolated populations in the South Pacific. Genetics 68: 77–95. [DOI] [PMC free article] [PubMed] [Google Scholar]
- Jorde, L. B., W. S. Watkins and M. J. Bamshad, 2001. Population genomics: a bridge from evolutionary history to genetic medicine. Hum. Mol. Genet. 10: 2199–2207. [DOI] [PubMed] [Google Scholar]
- Kennington, W. J., J. Gockel and L. Partridge, 2003. Testing for asymmetrical gene flow in a Drosophila melanogaster body-size cline. Genetics 165: 667–673. [DOI] [PMC free article] [PubMed] [Google Scholar]
- Kimura, M., 1969. The number of heterozygous nucleotide sites maintained in a finite population due to steady flux of mutations. Genetics 61: 893–903. [DOI] [PMC free article] [PubMed] [Google Scholar]
- Klein, R. G., 1989 The Human Career: Human Biological and Cultural Origins. University of Chicago Press, Chicago.
- Kliman, R. M., P. Andolfatto, J. A. Coyne, F. Depaulis, M. Kreitman et al., 2000. The population genetics of the origin and divergence of the Drosophila simulans complex species. Genetics 156: 1913–1931. [DOI] [PMC free article] [PubMed] [Google Scholar]
- Kumar, S., K. Tamura, I. B. Jakobsen and M. Nei, 2001. MEGA2: molecular evolutionary genetics analysis software. Bioinformatics 17: 1244–1245. [DOI] [PubMed] [Google Scholar]
- McEvey, S. F., J. R. David and L. Tsacas, 1987. The Drosophila ananassae complex with description of a new species from French Polynesia Drosophilidae. Ann. Soc. Entomol. 23: 377–385. [Google Scholar]
- Nei, M., 1987 Molecular Evolutionary Genetics. Columbia University Press, New York.
- Pluzhnikov, A., A. Di Rienzo and R. R. Hudson, 2002. Inferences about human demography based on multilocus analyses of noncoding sequences. Genetics 161: 1209–1218. [DOI] [PMC free article] [PubMed] [Google Scholar]
- Pritchard, J. K., and M. Przeworski, 2001. Linkage disequilibrium in humans: models and data. Am. J. Hum. Genet. 68: 1–14. [DOI] [PMC free article] [PubMed] [Google Scholar]
- Pritchard, J. K., M. Stephens and P. Donnelly, 2000. Inference of population structure using multilocus genotype data. Genetics 155: 945–959. [DOI] [PMC free article] [PubMed] [Google Scholar]
- Redd, A. J., and M. Stoneking, 1999. Peopling of Sahul: mitochondrial DNA variation in Australian aboriginal and Papua New Guinean populations. Am. J. Hum. Genet. 65: 808–828. [DOI] [PMC free article] [PubMed] [Google Scholar]
- Redd, A. J., J. Roberts-Thomson, T. Karafet, M. Bamshad, L. B. Jorde et al., 2002. Gene flow from the Indian subcontinent to Australia: evidence from the Y Chromosome. Curr. Biol. 12: 673–677. [DOI] [PubMed] [Google Scholar]
- Reich, D. E., M. Cargill, S. Bolk, J. Ireland, P.C. Sabeti et al., 2001. Linkage disequilibrium in the human genome. Nature 411: 199–204. [DOI] [PubMed] [Google Scholar]
- Roberts-Thomson, J. M., J. J. Martinson, J. T. Norwich, R. M. Harding, J. B. Clegg et al., 1996. An ancient common origin of aboriginal Australians and New Guinea highlanders is supported by alpha-globin haplotype analysis. Am. J. Hum. Genet. 58: 1017–1024. [PMC free article] [PubMed] [Google Scholar]
- Rozas, J., and R. Rozas, 1999. DnaSP version 3: an integrated program for molecular population genetics and molecular evolution analysis. Bioinformatics 15: 174–175. [DOI] [PubMed] [Google Scholar]
- Saitou, N., and M. Nei, 1987. The neighbor-joining method: a new method for reconstructing phylogenetic trees. Mol. Biol. Evol. 4: 406–425. [DOI] [PubMed] [Google Scholar]
- Schlötterer, C., C. Vogl and D. Tautz, 1997. Polymorphism and locus-specific effects on polymorphism at microsatellite loci in natural Drosophila melanogaster populations. Genetics 146: 309–320. [DOI] [PMC free article] [PubMed] [Google Scholar]
- Shackleton, N. J., 2000. The 100,000 year ice-age cycle identified and found to lag temperature, carbon dioxide and orbital eccentricity. Science 289: 1897–1902. [DOI] [PubMed] [Google Scholar]
- Sharbel, T. F., B. Haubold and T. Mitchell-Olds, 2000. Genetic isolation by distance in Arabidopsis thaliana: biogeography and postglacial colonization of Europe. Mol. Ecol. 9: 2109–2118. [DOI] [PubMed] [Google Scholar]
- Simonsen, K. L., G. A. Churchill and C. F. Aquadro, 1995. Properties of statistical tests of neutrality for DNA polymorphism data. Genetics 129: 413–429. [DOI] [PMC free article] [PubMed] [Google Scholar]
- Slatkin, M., and R. R. Hudson, 1991. Pairwise comparisons of mitochondrial DNA sequences in stable and exponentially growing populations. Genetics 129: 555–562. [DOI] [PMC free article] [PubMed] [Google Scholar]
- Stephan, W., 1989. Molecular genetic variation in the centromeric region of the X chromosome in three Drosophila ananassae populations. II. The Om(1D) locus. Mol. Biol. Evol. 6: 624–635. [DOI] [PubMed] [Google Scholar]
- Stephan, W., and C. H. Langley, 1989. Molecular genetic variation in the centromeric region of the X chromosome in three Drosophila ananassae populations. I. Contrasts between the vermilion and forked loci. Genetics 121: 89–99. [DOI] [PMC free article] [PubMed] [Google Scholar]
- Stephan, W., L. Xing, D. A. Kirby and J. M. Braverman, 1998. A test of the background selection hypothesis based on nucleotide data from Drosophila ananassae. Proc. Natl. Acad. Sci. USA 95: 5649–5654. [DOI] [PMC free article] [PubMed] [Google Scholar]
- Stringer, C., 2000. Coasting out of Africa. Nature 405: 24–27. [DOI] [PubMed] [Google Scholar]
- Su, B., L. Jin, P. Underhill, J. Martinson, N. Saha et al., 2000. Polynesian origins: insights from the Y chromosome. Proc. Natl. Acad. Sci. USA 97: 8225–8228. [DOI] [PMC free article] [PubMed] [Google Scholar]
- Tajima, F., 1989. Statistical method for testing the neutral mutation hypothesis by DNA polymorphism data. Genetics 123: 585–595. [DOI] [PMC free article] [PubMed] [Google Scholar]
- Takahata, N., S.-H. Lee and Y. Satta, 2001. Testing multiregionality of modern human origins. Mol. Biol. Evol. 18: 172–183. [DOI] [PubMed] [Google Scholar]
- Tobari, Y. N., 1993 Drosophila ananassae: Genetical and Biological Aspects. Japan Scientific Societies Press, Tokyo.
- Turner, C. G., 1987. Late Pleistocene and Holocene population history of East Asia based on dental variations. Am. J. Physiol. Anthropol. 73: 305–321. [DOI] [PubMed] [Google Scholar]
- Vane-Wright, R. I., 1990 The Philippines—key to the biogeography of Wallacea, pp. 19–34 in Insects and the Rain Forests of South East Asia (Wallacea), edited by W. J. Knight and J. D. Holloway. Royal Entomological Society, London.
- Vogl, C., A. Das, M. Beaumont, S. Mohanty and W. Stephan, 2003. Population subdivision and molecular sequence variation: theory and analysis of Drosophila ananassae data. Genetics 165: 1385–1395. [DOI] [PMC free article] [PubMed] [Google Scholar]
- Wakeley, J., 2001. The coalescent in an island model of population subdivision with variation among demes. Theor. Popul. Biol. 59: 133–144. [DOI] [PubMed] [Google Scholar]
- Watterson, G. A., 1975. On the number of segregating sites in genetical models without recombination. Theor. Popul. Biol. 7: 256–276. [DOI] [PubMed] [Google Scholar]
- Weir, B. S., and C. C. Cockerham, 1984. Estimating F-statistics for the analysis of population structure. Evolution 38: 1358–1370. [DOI] [PubMed] [Google Scholar]
- Wright, S., 1969 Evolution and the Genetics of Populations. II. The Theory of Gene Frequencies. University of Chicago Press, Chicago.