

Abstract
MAP kinases homologous to Saccharomyces cerevisiae Fus3p/Kss1p have been identified in plant pathogenic fungi and are required for pathogenicity and sexual reproduction. To better understand the role of MAP kinase signaling in Neurospora crassa, and to identify downstream target genes of the pathway, we isolated, cloned, and disrupted the FUS3 homolog mak-2. Ste12p is a transcription factor target of Fus3p that activates genes of the mating pathway in yeast, and we also characterized the N. crassa STE12 homolog pp-1. The mak-2 and pp-1 mutants have reduced growth rate, produce short aerial hyphae, and fail to develop protoperithecia. In addition, ascospores carrying null mutations of either gene are inviable. Subtractive cloning was used to isolate genes having reduced expression in the mak-2 mutant. Expression of some of these genes is protoperithecia specific and three of them are part of a gene cluster potentially involved in the production of a polyketide secondary metabolite. Microarray analysis was used to extend the analysis of gene expression in mak-2 and pp-1 mutants. The role of the MAP kinase pathway in both sexual and asexual development as well as secondary metabolism is consistent with the dual regulation of the mating process and pathogencity observed in fungal pathogens.
A family of serine/threonine protein kinases, known as the mitogen-activated protein (MAP) kinases, is involved in extracellular signal perception during growth and differentiation processes in eukaryotic organisms. In the unicellular yeast, Saccharomyces cerevisiae, five MAP kinase signal transduction pathways that regulate mating, filamentation, cell integrity, the response to high osmolarity, and ascospore formation have been characterized (Gustin et al. 1998). Fus3p MAP kinase controls the transduction of the pheromone signal in haploid cells, while Kss1p regulates nitrogen starvation-induced filamentous growth in diploid cells (Gustin et al. 1998; Breitkreutz and Tyers 2002). Homologs of FUS3/KSS1 have been characterized in several pathogenic filamentous ascomycetes and play key roles in infection structure (appressorium) formation and host colonization (Xu 2000). For example, in Magnaporthe grisea, the Pmk1p MAP kinase is required for production of female reproductive structures, appressorium development, and host colonization (Xu and Hamer 1996).
The homologs of the S. cerevisiae transcription factor Ste12p, which is regulated by Fus3p and Kss1p, were also characterized in M. grisea, Aspergillus nidulans , and several other fungi (Liu et al. 1994; Chang et al. 2000, 2001; Vallim et al. 2000; Young et al. 2000; Borneman et al. 2001; Park et al. 2002). In A. nidulans, steA is required for sexual development (Vallim et al. 2000). In M. grisea, MST12 was shown to function downstream of PMK1 in the regulation of host penetration and invasive growth, but was not required for appressorium formation (Park et al. 2002). Interestingly, MST12 was not required for female sexual fertility (Park et al. 2002), providing a dramatic example of divergence in the role of MST12 in M. grisea compared to the A. nidulans counterpart. Neurospora crassa is a well-characterized model organism ideally suited to examining the role of MAP kinase function in mating behavior and development. Studies of the heterotrimeric G-proteins in N. crassa reveal a role in aerial hyphae formation and asexual sporulation (Kays and Borkovich 2004) and additional roles in protoperithecium function (Kim and Borkovich 2004). Because N. crassa is more closely related to M. grisea than is A. nidulans, determining the role of the ortholog of MST12/steA in N. crassa is of interest for understanding the evolutionary steps leading to the functional difference between MST12 and steA.
We characterized N. crassa homologs of S. cerevisiae FUS3/KSS1and STE12 genes, called mak-2 (mitogen activated kinase-2) and pp-1 (protoperithecium-1), respectively. Both genes are essential for protoperithecia formation and contribute to maintaining normal filamentous growth and development of aerial hyphae. Several downstream targets genes of the MAP kinase pathway, which were called mak-2 kinase-regulated genes (mkr), were isolated and studied. A gene encoding a polyketide synthase and three mkr genes were found to be clustered and coregulated during protoperithecia and fruiting body formation. This finding suggests the possibility that genes involved in plant pathogenesis may have been coopted from the mating process by adaptation of this MAP kinase pathway involved in regulating both morphogenesis and secondary metabolism.
MATERIALS AND METHODS
Strains, culture conditions, and fungal transformation:
N. crassa strains 74-OR23-1VA (FGSC 2489), 74-ORS6a (FGSC 4200), and cr-1 mutant (FGSC 4345) were obtained from the Fungal Genetics Stock Center (FGSC, Kansas City, KS). Vogel's minimal (VM) medium and synthetic crossing (SC) medium were prepared as described (Davis and De Serres 1970). For RNA extraction, conidia were collected in sterile water from flasks with VM solid medium after 7 days of incubation at 34° and filtered through Miracloth (Calbiochem, La Jolla, CA). Cultures were inoculated with 106 conidia/ml and grown in flasks at 34° at 250 rpm. Mycelia were harvested by filtration onto filter paper in a Bücher funnel. Mycelia from cellophane overlays on VM and SC plates were collected after 7 days of incubation at 34° or 25°, respectively.
For microarray experiments, to reduce the variation arising from an individual growth experiment, mycelia were harvested from 12 independent SC plates (a pair of plates inoculated on each of 6 successive days) for total RNA extraction. RNA from cultures harvested each day were isolated separately and combined in equal amounts for labeling prior to microarray hybridization.
Growth rate was measured on race tubes with VM solid medium (Davis and DeSerres 1970). The experiment was repeated three times and the average growth rates were calculated. Crosses were performed on SC medium, and random ascospores were picked and germinated as described previously (Perkins and Raju 1986). To examine the effect of cAMP on production of aerial hyphae, 2 mm cAMP (Sigma, St. Louis) was added to standing VM liquid cultures as described previously (Kays et al. 2000; Ivey et al. 2002). To test for conidiation in submerged liquid cultures, conidia were inoculated at a concentration of 1 × 10⁶ conidia/ml into 50 ml of SC medium, SC with 2% peptone, VM, and VM with 2% peptone and grown as described above.
N. crassa was transformed by electroporation of conidia on the basis of a published protocol (Margolin et al. 1997). The transformed conidia were then mixed with 45 ml of the regeneration agar [VM with 3% sorbose, 0.05% glucose, 0.05% fructose (FGS) as carbon source, 1M sorbitol, 1.5% agar] at 55°, poured onto VM FGS (Davis and De Serres 1970) agar plates with an appropriate concentration of selective agent, and incubated at 34°.
Nucleic acid manipulations:
All nucleic acid manipulations were performed using standard methods (Sambrook and Russell 1989). Genomic DNA was isolated from N. crassa mycelia as described (Vollmer and Yanofsky 1986). RNA isolation and Northern blot analyses were carried out as described (Sachs and Yanofsky 1991). Northern blot hybridizations were performed according to the manufacturer's protocol (Zeta-Probe Blotting Manual, Bio-Rad Laboratories, Hercules, CA). Probe labeling was performed using the Rediprime II system labeling kit from Amersham Pharmacia Biotech (Piscataway, NJ). A phosphorimager (Fuji BAS-1800 II) was used to quantitate signals on blots for comparison to microarray results. To analyze the expression pattern of the polyketide synthase gene (NCU02918.1) (Galagan et al. 2003), reverse-transcription-polymerase chain reaction (RT-PCR) was used. First-strand cDNA was generated from the total RNA using a first-strand cDNA synthesis kit (Amersham Pharmacia Biotech). The double-stranded cDNA was then amplified by PCR with the specific primers PDL21 (Table 1) and PDL22 to produce the 661-bp PCR fragment specific to NCU02918.1. N. crassa actin (NCU04173.1) specific primers, actin1 and actin3, were used to amplify actin cDNA as a control.
TABLE 1 .
Primers, strains, and plasmids used in the study
| Primers | Sequences |
|---|---|
| PDL21 | 5′-GTCGATGTCGTCCTCAACTTTGCCAAC-3′ |
| PDL22 | 5′-GGTCCATCGATACCATTGACAGCCAAC-3′ |
| actin1 | 5′-GTCGTACTCCTGCTTGGAGATCCACAT-3′ |
| actin3 | 5′-CTCAGTCCAAGCGTGGTATCCTTACTC-3′ |
| MTH-1 | 5′-GTCGAATTCAGCAGCGCACAAAGAGGC-3′ |
| MTH-2 | 5′-ACACGGATCCTCATAATCTCCTGGTAG-3′ |
| STE-1 | 5′-TCAACGATGACGAACTTGC-3′ |
| STE-2 | 5′-ACGCTTGTGCTGTGCTAGG-3′ |
| STH-1 | 5′-CTTGAATTCTATTCTTCGCAGCATGCC-3′ |
| STH-2 | 5′-ACTGGATCCCGTTTCGCATCATCTCGC-3′ |
| MAK1 | 5′-TTCCTCGAGTCCCGAATAGTTGCTTGC-3′ |
| T7 | 5′-GTAATACGACTCACTATAGGGC-3′ |
| PDL37 | 5′-CAAGCAACTTTTCGGGAC-3′ |
| PDL38 | 5′-ATCGGTAGACACTTCACC-3′ |
| STE3 | 5′-TCCAGACTTTGAGCATGC-3′ |
| STE3KO | 5′-TAATGCAAGTCCGATTCG-3′ |
| STEK4 | 5′-TGGCACAGATATGTGAGCAGTTCTG-3′ |
| CTRP2 | 5′-CGCACCAAGTTATCGTGCACCAAGC-3′ |
| STE11 | 5′-ACCGCAATCGTTTCGTGC-3′ |
| STE14 | 5′-AGCGTGGAACTATAGTAAG-3′ |
| SE1 | 5′-TAGTCCGAATTCAAGCAAGAGCACA-3′ |
| SE2 | 5′-CTCTTGCTTGAATTCGGACTA-3′ |
| Strains | Genotype/comment |
| 74-OR23-1VA | Wild-type strain, mat A (FGSC 2489) |
| 74-ORS6a | Wild-type strain, mat a (FGSC 4200) |
| PBM5 | Δmak-2 a, constructed in 74-ORS6a |
| PBMP5-1 | Δmak-2 A, F1 progeny of PBM5 cross with 74-OR23-1VA (FGSC 9353) |
| PBM7 | Δmak-2 a, constructed in 74-ORS6a |
| PBM49 | Δmak-2 a, constructed in 74-ORS6a |
| DL14 | Δpp-1 A, constructed in 74-OR23-1VA (FGSC 9352) |
| FGSC 4345 | cr-1, mat a |
| Plasmids | Comment |
| pBP-KOMAK2 | mak-2 gene replacement plasmid |
| pBP-KOSTE12 | pp-1 gene replacement plasmid |
| pDL3 | mak-2 gene complementation plasmid |
| pBP15 | pBluescript SK− vector with an hph cassette in the EcoRV site |
| pBP26 | pCB1004 with a 2.5-kb BglII fragment of cosmid G14H8 in the BamHI site |
| pBP27 | pCB1532 with an EcoRI-HindIII hph cassette |
| pBP30 | pCB1004 with a 2-kb XhoI upstream flanking region of mak-2 |
| pMB1 | pCB1004 with a 7.5-kb BamHI fragment of cosmid G14H8 in the BamHI site |
| pMB2 | pCB1004 with a 2.2-kb BamHI downstream flanking region of mak-2 |
Four cosmids containing the mak-2 gene were identified: G13A3, G14H8, X1E10, and X15B5. To subclone the mak-2 gene, cosmids G14H8 and X15B5 were digested with selected restriction enzymes and subjected to Southern analysis. Three DNA fragments that gave a positive signal when probed with PMK1 cDNA were isolated and cloned into the vector, pCB1004 (Sweigard et al. 1997): a 2.5-kb BglII-BglII (pBP26), a 7.5-kb BamHI-BamHI (pMB1), and a 2.2-kb BamHI-BamHI (pMB2). These clones were used as template DNA to sequence the mak-2 locus. The coding region of the mak-2 gene was PCR amplified from N. crassa cDNA with primers MTH-1 and MTH-2 and then sequenced to verify its integrity.
A cDNA clone (NCW10A9) containing a region of homology to the A. nidulans SteA protein was identified by sequence alignment (Nelson et al. 1997). A portion of this cDNA was amplified by PCR with STE-1 and STE-2 primers and used as a probe to screen the N. crassa pMOCosX cosmid library (Orbach 1994). Four cosmids were identified in the screen: X17D4, X3B2, G21F5, and G21G11. The complete sequence of the gene was determined and we named the gene pp-1 (protoperithecia-1) because the phenotype of the corresponding mutant strain resembled the previously described pp mutant phenotype (Perkins et al. 2001). The coding region of the pp-1 gene was PCR amplified from N. crassa cDNA with primers STH-1 and STH-2 and then sequenced to compare with the genomic sequence to verify predicted intron locations.
A mak-2 gene replacement vector pBP-KOMAK2 was constructed in the pCB1532 vector (Sweigard et al. 1997). First, an EcoRI-HindIII hph cassette was cloned into the EcoRI-HindIII polylinker sites of pCB1532 to create pBP27. Next, the 2.2-kb BamHI-BamHI fragment (from pMB2) containing the mak-2 downstream flanking region was ligated into the BamHI site of pBP27. The 2-kb XhoI-XhoI upstream flanking region of mak-2 was PCR amplified from plasmid pBP30 with T7 and MAK1 (containing an XhoI site) primers and ligated into the XhoI site to produce pBP-KOMAK2. Before transformation into N. crassa 74-ORS6a, pBP-KOMAK2 was linearized with NotI. Hygromycin-resistant transformants were isolated and screened by PCR using primers PDL37 and PDL38. Isolates of each mak-2 knockout mutant were purified to homokaryons by three rounds of conidial plating and then confirmed by Southern blot analysis. The mak-2 complementation vector was generated by cloning a 5.6-kb EcoRI-HindIII fragment from the cosmid G14H8 (−2212 to +3412 bp with respect to the predicted start codon of mak-2) into the corresponding restriction sites of pCB1532. The resulting plasmid pDL3 was used to transform conidia of the mak-2 strain with selection for sulfonylurea resistance (100 μg/ml chlorimuron ethyl). Then the sulfonylurea-resistant transformants were screened for the presence of the mak-2 coding region by PCR using PDL37 and PDL38 primers.
The pp-1 gene replacement plasmid pBP-KOSTE12 was constructed in pBluescript SK- vector (Stratagene, La Jolla, CA). First an HpaI-HpaI hph cassette from plasmid pCB1004 was cloned into the EcoRV site of pBluescript vector. The resulting plasmid was named pBP15. Next, a 1.7-kb pp-1 downstream flanking region was PCR amplified using STE3 and STE3KO primers and cloned into the TOPO vector (Invitrogen, Carlsbad, CA). The EcoRI fragment containing the downstream flanking region was cloned into the EcoRI site of pBP15. The 1.6-kb KpnI-HindIII upstream flanking region of pp-1 was obtained from cosmid X17D4 and cloned into the KpnI-HindIII site of pBP15 to create plasmid pBP-KOSTE12 plasmid. Before transformation into N. crassa, pBP-KOSTE12 was digested with NotI and KpnI enzymes to release the cloned DNA from the vector sequences. Hygromycin-resistant transformants were isolated and screened by PCR using primers STEK4 and CTRP2, and the deletion of pp-1 gene was confirmed by PCR with primers STE11 and STE14. Homokaryons for each pp-1 knockout mutant were obtained as described above for mak-2 mutants.
Subtractive cloning of mak-2-regulated genes:
To clone genes differentially expressed in the mak-2 mutant, a subtractive enrichment protocol described by Wang and Brown (1991) was followed. Both the wild-type (74-ORS6a) and mak-2-knockout (PBM5) strains were grown at 25° with constant illumination on SC plates overlaid with cellophane. After 6 days, protoperithecia were well developed in the wild-type strain. Mycelia of both strains were collected and used for isolation of total RNA. Next, poly(A)+ RNA was purified (PolyATtrack mRNA Isolation Systems, Promega, Madison, WI) from ∼1.5 mg of total RNA, and 1 μg of poly(A)+ RNA was used to synthesize cDNA (cDNA Synthesis Kit, Amersham Pharmacia Biotech, Piscataway, NJ). cDNAs were digested with RsaI to produce blunt-ended fragments. Fragments in the size range of 100–500 bp were purified from the agarose gel and ligated with double-stranded linkers SE1 and SE2. cDNA fragments were subsequently amplified by PCR with the single primer SE2. To isolate genes downregulated in the mak-2 mutant, biotin was incorporated into the cDNA from the mak-2-mutant strain and this biotinylated cDNA was used in excess to hybridize to cDNA from the wild-type strain. The common sequences present in the wild-type strain that hybridized with biotinylated cDNA of the mutant were subtracted by binding with streptavidin followed by phenol extraction. After two rounds of subtractive enrichment, the remaining cDNA fraction was cloned into the pBluscript SK− vector after EcoRI digest. A library of Escherichia coli transformants was used to prepare colony blots and hybridized with cDNA probes prepared from wild-type and mak-2-mutant RNA. Clones hybridizing with the wild-type cDNA but not with the mak-2-mutant cDNA were sequenced and gene expression was analyzed by Northern blotting.
Microarray hybridization and data analysis:
The microarray chips and hybridization conditions were identical to those described previously (Lewis et al. 2002 Xie et al. 2004). In brief, the microarray consisted of 3840 features composed of 1920 pairs of spots including 1764 ESTs. Additional control samples included plasmid DNA and PCR products for known N. crassa genes. The microarray represents 1335 unique genes or ∼13% of all predicted N. crassa genes (Lewis et al. 2002; Xie et al. 2004). The two-channel (Cy3 and Cy5) labeling system, which allows simultaneous comparison of gene expression patterns, was used (DeRisi et al. 1997). cDNA samples of wild type (74-OR23-1VA), Δpp-1 (DL14), or Δmak-2 (PBMP5-1) were generated by reverse transcription from 400 ng mRNA starting material. Reverse transcription and subsequent hybridization of the microarray followed the two-step protocol of the 3DNA Submicro EX expression array detection kit (Genisphere, Hatfield, PA) as described previously (Xie et al. 2004). Fluorescence images were acquired using an Affymatrix 426 array scanner (Affymatrix, Santa Clara, CA) and then imported into ScanAlyze (http://rana.lbl.gov/EisenSoftware.htm) to generate raw signal intensities for each spot. The N. crassa microarray data files are available at http://plpa2linux.tamu.edu/microarray.html.
Xie et al. (2004) compared three statistical approaches for the analysis of the effects of glucose on N. crassa gene expression using an identical microarray. That study indicated that Student's t-test for significance (Genespring, Silicon Genetics, Redwood City, CA), which determines whether the mean normalization value is significantly different from 1.0, is the most sensitive approach, as compared to MARAN (Engelen et al. 2003) and SAM (Tusher et al. 2001). Given the fact that, as expected, the relative differences between mutants and wild type in this study tend to involve fewer genes on the array and, also, tend to be exhibited as a lesser fold change difference than those in the glucose comparison, we used Genespring version 6.1 (Silicon Genetics) for this analysis. Furthermore, since we were interested not only in the difference in each mutant vs. wild type, but also in a direct comparison of the two mutant responses relative to the wild-type controls, the availability of the ANOVA and Welch t-test features to conduct these comparisons also justified the choice of Genespring 6.1.
Six or eight data points per gene (duplicate spots on each of three or four independent arrays per mutant studied) were taken. Prior to normalization, the background value for each spot was subtracted from the raw intensity value. The data were then normalized by the per spot and per chip intensity-dependent (Lowess) procedure using the default settings. Because measurements with higher control signal strength are relatively more precise than measurements with lower control signal strength, the cross-gene-error model in Genespring calculates a cutoff control intensity value for “reliable” data. Thus, the first filter we applied to the normalized data was based on this cutoff control signal strength. To consider only the genes reliable in both groups, the filter was applied to screen for genes with control signals above the cutoff value in two of two conditions (Δmak-2 vs. wild type and Δpp-1 vs. wild type). Next, to identify genes regulated by either mak-2 or pp-1 or by both, this list of reliable genes was filtered for genes with Student's t-test P-value <0.05 in one of two conditions. These t-tests were calculated with the Benjamin and Hochberg false discovery rate multiple-testing correction. The final filter applied to limit the number of regulated genes for further analysis was based on an arbitrary fold change (Signal/Control) of at least twofold (decrease or increase) in mRNA levels in either of the mutants relative to the wild type.
To compare the effect of the mak-2 and the pp-1 mutations on gene expression, we applied one-way analysis of variance (ANOVA) to genes that were regulated at least at twofold. The Benjamini and Hochberg false discovery rate multiple-testing correction was applied during this procedure. Since the distribution of values for genes whose expression decreased twofold or more were bounded between 0 and 0.5, we assumed that the variances were not equal for the comparison of these genes. Thus, the test of significance was actually the Welch t-test, a common nonparametric substitution made when the assumptions of ANOVA are not met. In contrast, for comparison of the genes whose expression increases at least twofold relative to wild type, the variances were calculated using the cross-gene-error model and on-chip replicates and a standard ANOVA was applied.
RESULTS
Cloning and sequence analysis of the mak-2 and pp-1 genes:
The mak-2 gene encoding the N. crassa homolog of yeast Fus3/Kss1 MAP kinases was identified on the basis of sequence similarity to the M. grisea PMK1 gene. The nucleotide sequence of the cloned DNA was determined and revealed an open reading frame (ORF) of 1278 bp that codes for a protein of 352 amino acids corresponding to NCU02393.1 (Galagan et al. 2003). The coding region of the mak-2 gene is interrupted by three introns. The presence of the introns was confirmed by sequencing the mak-2 cDNA fragment amplified from a N. crassa cDNA library by PCR with primers designed to amplify the entire coding sequence. The predicted amino acid sequence of the mak-2 protein demonstrated high identity to other fungal MAP kinases and contains 11 conserved protein kinase domains, as well as the TEY dual phosphorylation motif specific for this group of MAK kinases (Kultz 1998; Pandey et al. 2004).
To isolate the N. crassa pp-1 gene, a genomic cosmid library was screened with a PCR-amplified cDNA fragment that showed similarity to the A. nidulans steA gene (see materials and methods). The sequence of the identified ORF encodes a protein of 722 amino acids and is interrupted by three introns that correspond to NCU00340.1 (Galagan et al. 2003). The position of the predicted introns was confirmed by sequencing a PCR product obtained by using a cDNA library as template. The N. crassa pp-1 protein shows a high identity to orthologs from other fungi. Similar to A. nidulans SteAp and M. grisea Mst12p, the N-terminal part of the protein contains a conserved homeodomain and the C-terminal region contains two Cys2/His2 zinc finger motifs. The overall sequence identity to Ste12p orthologs from yeasts is low and the yeast proteins lack the zinc finger domain. Additionally, BLAST search against the Protein Data Bank (PDB) showed a conserved proline at amino acid position 101 of PP-1, which might be a potential MAP kinase-binding site (Obenauer et al. 2003) (supplementary Figure S1 at http://www.genetics.org/supplemental/).
Deletion of mak-2 and pp-1:
To determine the roles of the mak-2 and pp-1 genes we generated deletion mutants by homologous recombination. The disruption vectors were constructed by replacing the ORFs with a hygromycin-resistance marker (Figure 1, A and B). The mak-2 construct removes nucleotides starting 8 bp upstream of the mak-2 start codon to 278 bp downstream of the stop codon. The construct was transformed into the mat a strain 74-ORS6a and the correct integration confirmed by Southern hybridization (Figure 1C). We identified three mak-2-knockout strains: PBM5, PBM7, and PBM49. A 1.5-kb KpnI fragment overlapping the mak-2-coding region was used as a hybridization probe to verify the deletion. This probe identified a 7.5-kb BamHI fragment in the wild type that was absent in the Δmak-2 strains (Figure 1C, left). Likewise, the 1.5-kb KpnI band was absent because of the deletion of the KpnI site, leaving a 9.0-kb KpnI fragment in the Δmak-2 mutants. When the 1.4-kb hph gene was used as a probe, the predicted 7.5-kb BamHI and 9-kb KpnI fragments were observed in the Δmak-2 mutants (Figure 1C, right). The PBM5 strain was then backcrossed with 74-OR23-1VA, and a mak-2::hph mat A progeny was isolated and named PBMP5-1. The phenotypes of PBM5 and PBMP5-1 were indistinguishable.
Figure 1.—
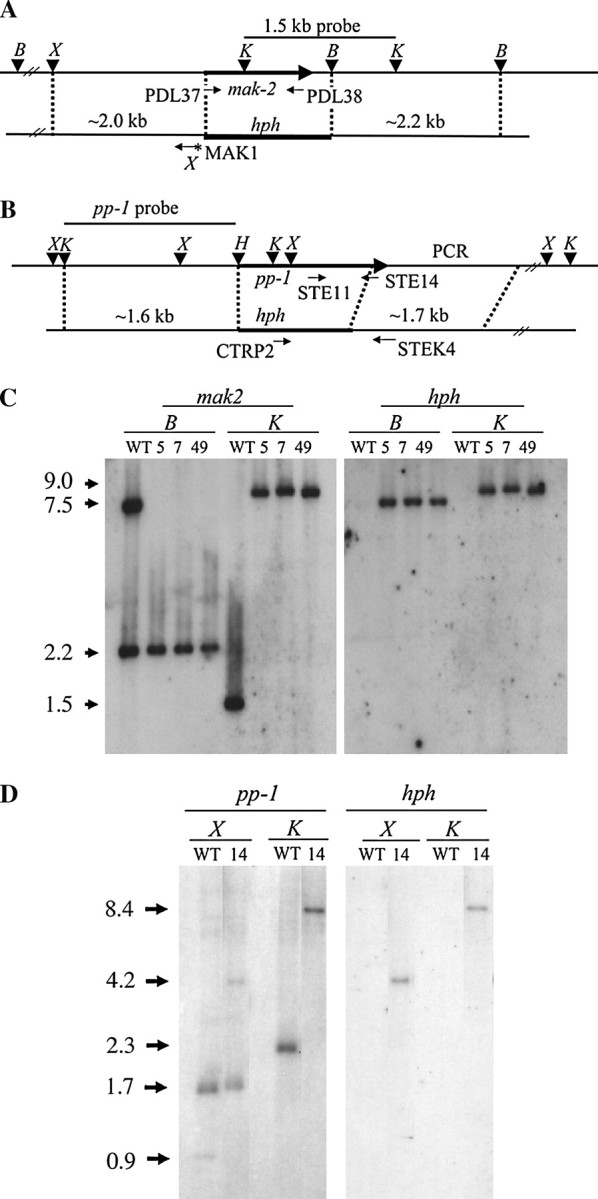
Construction of mak-2 and pp-1 gene replacement mutants. (A) Physical map of the mak-2 genomic region and gene replacement vector pBP-KOMAK2. The XhoI site introduced from primer MAK1 is indicated with an asterisk. PDL37 and PDL38 are primers used to screen Δmak-2 knockout mutants. The indicated 1.5-kb KpnI fragment was used as a hybridization probe for Southern blot analysis. The restriction sites are X, XhoI; K, KpnI; H, HindIII; B, BamHI. (B) Physical map of pp-1 genomic region and gene replacement vector pBP-KOSTE12. STE11, STE14, STEK4, and CTRP2 are primers used to screen Δpp-1 knockout mutants. (C) Southern analysis of Δmak-2 knockout mutant strains PBM5, PBM7, and PBM49. Genomic DNAs were digested with BamHI (B) or KpnI (K) yielding fragments of the indicated sizes (kb). (D) Southern analysis of the Δpp-1 knockout mutant strain DL14. Genomic DNAs were digested with XhoI (X) or KpnI (K) to yield fragments of the indicated sizes.
For pp-1, a deletion starting 4 bp upstream of the start codon and ending 82 bp upstream of the stop codon was generated (Figure 1B). A pp-1 knockout strain, DL14, was constructed in the 74-OR23-1VA background (Figure 1D). A 1.6-kb KpnI-HindIII upstream flanking region of pp-1 (Figure 1B) was used as a hybridization probe. The wild type produced the expected XhoI fragments (1.7 and 0.9 kb) and a 2.3-kb KpnI fragment, whereas in the knockout mutant, the 0.9 XhoI fragment was converted to a 4.2-kb XhoI fragment due to deletion of the XhoI site in the mutant and the 2.3-kb KpnI fragment was converted to an 8.4-kb fragment due to removal of a KpnI site by the deletion (Figure 1D, left). When the 1.4-kb hph gene was used was a probe, the knockout mutant showed a 4.2-kb XhoI band and a 8.4-kb KpnI band as expected (Figure 1D, right). We selected the PBMP5-1 and the DL14 isolate for further analysis.
Growth and development of Δmak-2 and Δpp-1 mutants:
Mycelial elongation rates for both the Δmak-2 and Δpp-1 strains were 25% of the wild-type controls (Figure 2A), and these observations were verified in race tube growth experiments (3.8 mm/hr vs. 1.0 mm/hr). Both Δmak-2 and Δpp-1 mutants never formed protoperithecia even after extended incubation time (Figure 2B), nor could they be fertilized to form perithecia (Figure 2C). The inability to form protoperithecia accounts for the complete female sterility of the mutants. However, the conidia of both Δmak-2 and Δpp-1 mutants were able to fertilize protoperithecia formed by the wild type. Protoperithecia from those crosses developed into mature perithecia with asci containing eight black ascospores. However, only about half of the isolated ascospores from the crosses were viable, and the vast majority of the ascospores that germinated developed into colonies displaying wild-type growth and sensitivity to hygromycin. The poor recovery of hygromycin-resistant progeny (<0.1%) indicates that Δmak-2 and Δpp-1 cause ascospore lethality. As mentioned above, a rare hygromycin-resistant progeny was obtained for the mak-2 mutant and this isolate was designated PBMP5-1. PBMP5-1 displayed all the phenotypes of the original mutant strain. To further demonstrate that all of the phenotypes of PBMP5-1 are due to mutation of mak-2, we complemented the mutant phenotype by transformation of PBMP5-1 (data not shown).
Figure 2.—
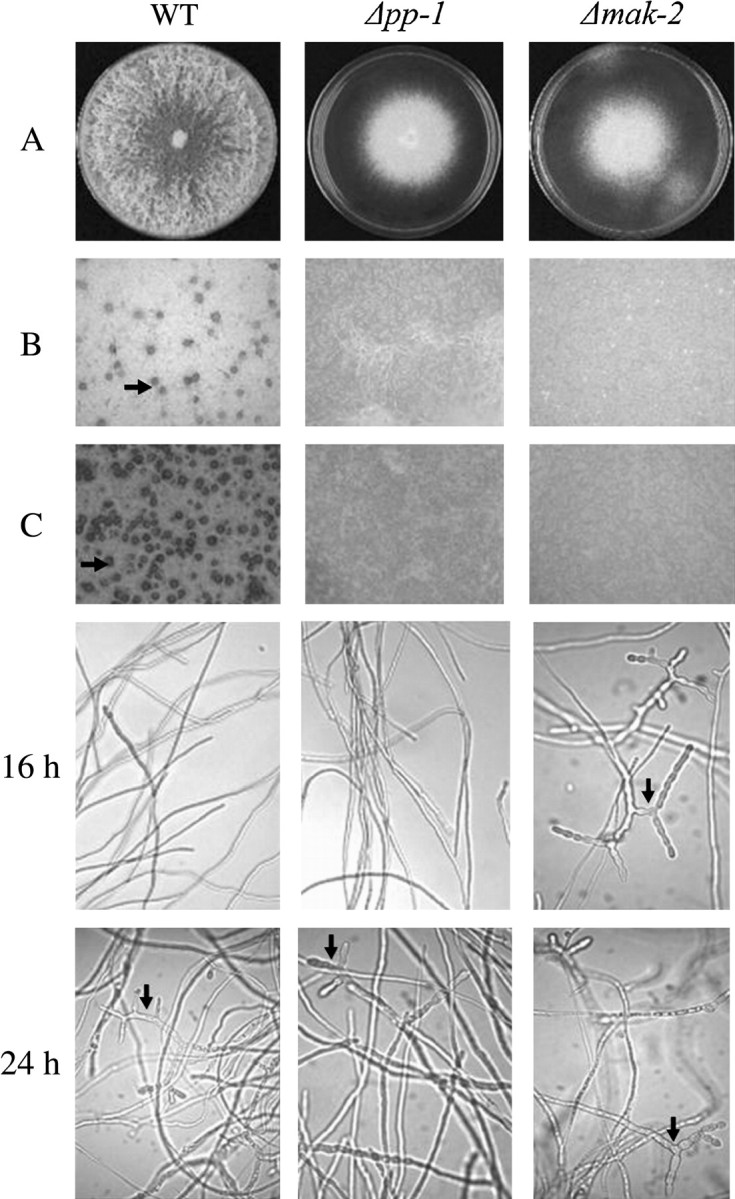
Phenotypes of wild-type (WT), Δpp-1, and Δmak-2 isolates. (A) Colony growth on VM plates after 4 days at 34°. (B) Protoperithecia (arrow) formation on SC plates after 7 days at 25°. No protoperithecia were observed in the mutants. (C) Perithecia (arrow) development on SC plates after 7 days growth that were fertilized with WT (74-ORS6a) conidia overnight. No perithecia were observed in the mutants. Conidiation phenotype of WT (74-OR23-1VA), Δpp-1, and Δmak-2 strains in SC liquid medium. The cultures were grown at 34° with constant agitation at 250 rpm. At 16 hr of incubation, conidiophores were observed in the mak-2 mutant (arrow) but not in the pp-1 mutant or wild-type cultures. By 24 hr, conidiophore formation was observed in all strains (arrows), but was predominant for the mak-2 mutant.
When grown on solid medium, both mutants produced abundant conidiophores similar in morphology to wild type, but they were produced very close to the surface due to the lack of normal aerial hyphae (Figures 2A and 3). The phenotype of reduced aerial hyphae is similar to that of the adenylate cyclase mutant cr-1 (Ivey et al. 2002; Kays et al. 2000; Yang et al. 2002); therefore, we examined the effect of cAMP on aerial growth in standing liquid cultures. cAMP restored aerial hyphae production to the cr-1 mutant but not Δmak-2 or Δpp-1 (Figure 3). The cr-1 mutant also produces conidia prematurely in liquid cultures. We noted that when grown in SC liquid medium, the Δmak-2-mutant cultures tended to produce carotenoid pigmentation associated with conidiation after 16 hr of incubation. Under the same conditions, the wild-type strain and the Δpp-1 mutant began to conidiate ∼ 24 hr after inoculation (Figure 2). These observations suggest that there is a moderate derepression of conidiation in the mak-2 mutant.
Figure 3.—

Aerial growth of strains with and without 2 mm cAMP for wild-type, Δpp-1, Δmak-2, and cr-1 mutants. Aerial development of the cr-1, but not pp-1 or mak-2 mutants, was rescued by cAMP.
Isolation of genes with mak-2-dependent expression:
In yeast, the Fus3p/Kss1p MAP kinase cascade regulates a number of genes involved in mating and invasive growth. In an attempt to isolate genes regulated by the putative mak-2 kinase we performed subtractive enrichment (see materials and methods). Because two major phenotypes of the Δmak-2 mutant, reduced aerial hyphae and female sterility, can be easily detected on SC solid medium, both the wild-type strain and the Δmak-2 mutant were grown on SC plates for 5 days at room temperature until the protoperithecia were formed in the wild type. After two rounds of subtractive enrichment, 46 cDNA fragments detected only in cDNA isolated from the wild-type strain were identified. Sequence analysis revealed that these correspond to six mkr genes (Table 2). The expression of mkr genes was analyzed in wild-type, Δmak-2, and Δpp-1 mutants under different growth conditions by Northern hybridization. Three of these genes mkr-2 (NCU02923.1), mkr-3 (NCU02930.1), and mkr-6 (NCU02918.1) are expressed preferentially in the wild-type strain grown on SC plates, conditions that induce protoperithecia development (Figure 4A). These three genes were found clustered on chromosome I (Figure 5). Analysis of the genomic sequence surrounding the mkr-2, -3, and -6 genes revealed the presence of a paralog of mkr-6 as well as an ORF encoding a putative polyketide synthase (pks) (NCU02918.1). The expression of the pks gene was most highly expressed in cultures grown on SC solid medium producing protoperithecia, or perithecia fertilized with conidia of opposite mating type, and this expression was dependent on mak-2 and pp-1 (Figure 4B).
TABLE 2 .
Summary ofmkr genes obtained from subtractive enrichment
| Gene | NCU no.a | Contigb | Expression patternc | BLAST match (organism), e-value |
|---|---|---|---|---|
| mkr1 | NCU08907.1 | 3.557 | Unspecific | Related to blastomyces yeast phase-specific protein (Ajellomyces dermatitidis), 2e-10 |
| mkr2 | NCU02923.1 | 3.152 | Protoperithecia specific | Putative short chain dehydrogenase (S. probe), 3e-12 |
| mkr3 | NCU02930.1 | 3.152 | Protoperithecia specific | Putative pyridoxal reductase (S. probe), 7e-67 |
| mkr4 | NCU06597.1 | 3.382 | Unspecific | Unknown |
| mkr5 | NCU07449.1 | 3.434 | Aerial hyphae specific | Unknown |
| mkr6 | NCU02919.1 | 3.152 | Protoperithecia specific | C terminus similar to binA gene product (A. nidulans), 5e-16 |
ORF ID numbers assigned by the Broad Institute (Galagan et al. 2003).
Contig ID of assembly three of the N. crassa genome (Galagan et al. 2003).
Based on Northern analysis (Figure 4A; data not shown).
Figure 4.—

Expression patterns of the pks/mkr gene cluster in the WT, Δpp1 mutant, and Δmak-2 mutant. Strains were grown on SC solid medium for 7 days at 25° (SC solid), and then fertilized with 74-ORS6a conidia for 24 hr at 25° (24 hr fertilized), on VM solid medium for 7 days at 34° (VM solid), in SC liquid medium for 24 hr with 250 rpm shaking at 34° (SC liquid), in VM liquid medium for 24 hr with 250 rpm shaking at 34°. RNA was extracted from harvested cultures and from conidia. (A) Northern hybridization analysis. RNA blots were hybridized in succession with probes for mkr-3, mkr-5, mkr-6, and mkr-2. The blots were then hybridized with a rDNA probe to check the relative amount of RNA in each sample. (B) RT-PCR analysis of pks gene expression. PCR was performed with genomic DNA as a positive control (P) and no template as a negative control (N). The ΛDNA-BstEII digest ladder (New England Biolabs) was used to estimate the size of the PCR products (M). A 661-bp pks fragment (indicated by the arrow) was amplified with the gene-specific primers PDL21 and PDL22 using the first-strand cDNA as a template (top). The same cDNA samples were also used for RT-PCT with a primer pair specific for the actin gene, which was used as a control (bottom). The arrows indicate the PCR products amplified from gDNA (980 bp) and cDNA (917 bp).
Figure 5.—

Relative positions of genes in the pks/mkr gene cluster in N. crassa and an orthologous cluster in M. grisea. Arrows indicate the orientations of mkr genes. The distances between the ORFs are indicated.
Expression of the mkr-5 (NCU07449.1) gene was detected only in the wild-type strain grown on solid medium (Figure 4A), a condition that produces aerial hyphae and conidia. Since mkr-5 was not detected in isolated conidia, we conclude that mkr-5 expression is limited to aerial hyphae and not expressed in hyphae submerged in liquid culture. Furthermore, mkr-5 was expressed at equally high levels in wild type and the aconidial fl mutant strain, supporting the view that it is expressed in aerial hyphae and not developmentally committed hyphae destined to form conidiophores. Interestingly, mkr-5 is the first example of a gene in N. crassa with an “aerial hyphae-specific” transcript. Expression of the mkr-1 and mkr-4 genes was only moderately reduced in the mak-2 mutant and varied from experiment to experiment (data not shown) and these genes were not characterized further.
Microarray analysis of gene expression in mak-2 and/or pp-1:
Seven microarray hybridizations were performed, four of which were replicates of the cDNA from the Δpp-1 mutant vs. the wild-type strain and three of which were replicates of the cDNA from the Δmak-2 mutant vs. the wild-type strain. The raw data were imported into GeneSpring version 6.1 to identify mak-2 and/or pp-1-regulated genes (see materials and methods). The cross-gene-error model identified 545.9 as the control strength cutoff intensity, which means that all genes with an average control signal less than this value were considered unreliable. As a result, 831 of 1920 (43.28%) individual pairs of features passed this filtering and were considered reliable. Among these reliable data, 280 of the 831 (34%) individual pairs of features displayed regulation by either mak-2 or pp-1 or by both (t-test P-value <0.05 in at least one of two conditions). To focus on the most highly regulated of these 280 individual pairs of features, 67 that showed at least a twofold change (36 increased and 31 decreased) in at least one of the two mutants relative to the wild-type strain were analyzed in greater detail.
These 67 ESTs represented 48 genes predicted from the N. crassa genome sequence and two ESTs (NM1H4 and NM5D2) that were ambiguous because the reported 5′- and 3′-end sequences for the cDNA clones represent different genes and these are likely to be chimeric (Table 3). On the basis of Northern blot analyses (data not shown), eight of the genes were removed from further consideration because their regulation was less than twofold. Genes were grouped into five classes on the basis of their microarray expression patterns (Tables 3 and 4). Class I included genes with expression significantly different from the wild type (t-test P-value <0.05) for both mutants and with at least a twofold change relative to wild type in at least one mutant. These 25 unique genes required both mak-2 and pp-1 for maximal expression. Only one gene was assigned to class II and required mak-2 but not pp-1 for its expression (Table 3). No genes that were unambiguously regulated by pp-1 but not mak-2 were identified. Genes that displayed elevated expression in the mutants were also detected (Table 4). In class III, 12 genes displayed expression levels that were significantly different from the wild type (t-test P-value < 0.05) in both mutants and also displayed at least a twofold increase in expression in at least one of the mutants. Class IV included two genes in which expression was elevated in the pp-1 mutant at least twofold but was unaffected or slightly downregulated in the mak-2 mutant. The two genes in class V showed the reciprocal expression pattern.
TABLE 3 .
Genes with reduced expression inmak-2 andpp-1 mutants in microarray and Northern blot experiments
| Average fold change |
|||||
|---|---|---|---|---|---|
| EST | Predicted ORF |
WT/Δpp-1 | WT/Δmak-2 | P-valuea | BLAST match, e-value |
| Class I | |||||
| NM6A4 | NCU04931 | 2.9 (2.3) | 2.8 (3.7) | 0.838 | Conserved hypothetical protein (N. crassa), 0.0 |
| NP6A12 | NCU04931 | 2.7 | 4.0 | 0.046 | Conserved hypothetical protein (N. crassa), 0.0 |
| NP2E11 | NCU05236 | 6.3 | 7.0 | 0.738 | Predicted protein (N. crassa), 1e-63 |
| NM3D7 | NCU05236 | 5.8 (33) | 8.3 (50) | 0.354 | Predicted protein (N. crassa), 1e-63 |
| NM1H4 (chimeric) |
NCU08812; NCU03500 |
4.4 (ND) | 5.9 (ND) | 0.592 | Conserved hypothetical protein (A. nidulans), 7e-56 Putative aminotransferase protein (Ralstonia), 5e-26 |
| SP4A5 | NCU07598 | 2.3 (ND) | 1.9 (ND) | 0.545 | Related to salicylate 1-monooxygenase (Emericella nidulans), 5e-55; related to cysteine desulfurase NFS1, 1e-38 |
| NM5F1 | NCU04416 | 2.0 (4.1) | 3.1 (3.3) | 0.368 | Conserved hypothetical protein (N. crassa), 0.0 |
| NM5D2 (chimeric) |
NCU07166; NCU04533 |
6.1 (ND) | 4.7 (ND) | 0.299 | DNA-dependent RNA polymerase I (S. cerevisiae), 1e-16; Ca-dependent cell adhesion molecule-1 (Dictyostelium), 9e-11 |
| NM7F7 | NCU02988 | 6.7 (7.6) | 3.9 (9.9) | 0.298 | Related to ubiquinone/menaquinone biosynthesis methlytransferase (COG2226.1, UbiE), 3e-05 |
| NM8A5 | NCU02259 | 6.1 (7.4) | 3.4 (6.7) | 0.294 | Related to LST7 amino acid permease Golgi transport protein (S. cerevisiae), 2e-09 |
| NM5C5 | NCU04603 | 4.6 (6.9) | 3.1 (12) | 0.294 | Riboflavin aldehyde-forming enzyme (Agaricus), 2e-08 |
| W10D8 | NCU07222 | 5.8 (16) | 3.8 (14) | 0.291 | Conserved hypothetical protein (M. grisea), 2e-38 |
| NM3H7 | NCU08691 | 6.6 (6.3) | 3.9 (10) | 0.291 | Conserved hypothetical protein (M. grisea), 3e-50 |
| NM4G7 | NCU01724 | 7.4 (3.8) | 5.0 (4.9) | 0.165 | Related to Na+/H+-exchange protein (S. cerevisiae), 2e-66 |
| NM8A11 | NCU02532 | 4.2 (ND) | 2.7 (ND) | 0.165 | Probable ubiquitin-activating enzyme (N. crassa), 0.0 |
| SM3D2 | NCU02930 | 11.9c | 4.9c | 0.165 | mkr-3, pyridoxal reductase (S. pombe), 4e-67 |
| NM1A10 | NCU04088 | 7.4 (ND) | 4.1 (ND) | 0.165 | Cell wall surface anchor family protein (Streptococcus), 7e-10 |
| NM7F6 | NCU05521 | 3.1 (ND) | 2.2 (ND) | 0.165 | Pathogenicity protein (PATH531) mRNA (M. grisea), 9e-64 |
| SP4D12 | NCU05768 | 5.4 | 2.5 | 0.165 | poi-2 (N crassa), 0.0 |
| SM1B11 | NCU05768 | 7.9 | 3.3 | 0.165 | poi-2 (N crassa), 0.0 |
| NM1A11 | NCU05768 | 7.5 (7.3) | 6.0 (9.0) | 0.165 | poi-2 (N. crassa), 0.0 |
| NM1F7 | NCU05768 | 6.3 | 3.5 | 0.165 | poi-2 (N. crassa), 0.0 |
| SP4F9 | NCU05768 | 3.2 | 1.4 | 0.010 | poi-2 (N. crassa), 0.0 |
| NM4A9 | NCU05768 | 4.4 | 3.9 | 0.579 | poi-2 (N. crassa), 0.0 |
| NM1D7 | NCU07027 | 5.7 | 3.6 | 0.165 | Glycogen phosphorylase (A. fumigatus), 0.0 |
| NM1A6 | NCU07784 | 6.3 (8.0) | 2.7 (13) | 0.165 | Conserved hypothetical protein (M. grisea), e-115 |
| SP4C6 | NCU00515 | 2.1 (ND) | 1.5 (ND) | 0.124 | RING-finger-like domain (cd00162.2), 1e-07 |
| SC3G2 | NCU08487 | 2.6 (1.8) | 1.4 (1.3) | 0.124 | Conserved hypothetical protein (M. grisea), 6e-36 |
| NM2E10 | NCU08791 | 5.5 (1.6) | 3.8 (1.8) | 0.120 | Catalase-1 (N. crassa), 0.0 |
| SM2G3 | NCU08332 | 5.6 (1.7) | 4.0 (3.5) | 0.108 | Woronin body major protein (A. nidulans), 3e-48 |
| NP3E3 | NCU08055 | 2.8 (1.7) | 1.4 (1.3) | 0.046 | Basic-leucine zipper transcription factor (N. crassa), 0.0 |
| NC1H4 | NCU08055 | 2.9 | 1.3 | 0.046 | Basic-leucine zipper transcription factor (N. crassa), 0.0 |
| NP6D8 | NCU02109 | 2.3 (1.3) | 1.2 (0.6) | 0.046 | UTP-glucose-1-phosphate uridylyltransferase, 1e-49 |
| Class II | |||||
| SP1D12 | NCU05789 | 1.0b (1.1) | 4.0 (3.4) | 0.010 | 1,3-β-Glucanase (Streptomyces coelicolor), 2e-32 |
Values in parentheses represent ratio quantitated by phosphorimager analysis of Northern blots. ND, no signal detected in Northern blot analysis.
One-way ANOVA P-value in comparison between affects of mak-2 and pp-1.
t-test P-value that is not significantly different from 1.0 (not distinguishable from wild type).
See Figure 4 for Northern blot.
TABLE 4 .
Genes with elevated expression inpp-1 andmak-2 mutants in microarray and Northern blot experiments
| Average fold change |
|||||
|---|---|---|---|---|---|
| EST | Predicted ORF |
Δpp-1/WT | Δmak-2/WT | P-valuea | BLAST match (organism) e-value |
| Class III | |||||
| SM2B5 | NCU03171.1 | 1.9 (2.1) | 2.0 (2.0) | 0.949 | Sexual differentiation process protein isp4 (S. pombe), 0.0 |
| SP2A11 | NCU05079.1 | 1.8 (1.9) | 2.3 (2.3) | 0.381 | Similar to peptide transporter PTR2 (C. albicans), 6e-82 |
| CCG-2 1/2 | NCU08457.1 | 2.0 (2.9) | 2.0 (3.9) | 0.995 | Clock-controlled gene protein 2 (N. crassa), 0.0 |
| CCG-2 1/8 | NCU08457.1 | 1.9 | 2.1 | 0.331 | Clock-controlled gene protein 2 (N. crassa), 0.0 |
| CCG-2 1/4 | NCU08457.1 | 3.0 | 2.3 | 0.147 | Clock-controlled gene protein 2 (N. crassa), 0.0 |
| CCG-2 | NCU08457.1 | 2.7 | 1.8 | 0.034 | Clock-controlled gene protein 2 (N. crassa), 0.0 |
| CCG-2 | NCU08457.1 | 2.0 | 1.3 | 0.064 | Clock-controlled gene protein 2 (N. crassa), 0.0 |
| CCG-2 | NCU08457.1 | 2.5 | 1.2 | 0.010 | Clock-controlled gene protein 2 (N. crassa), 0.0 |
| SC2F11 | NCU07318.1 | 2.1 (ND) | 1.6 (ND) | 0.219 | Mannitol-1-phosphate dehydrogenase mtlD (A. niger), e-132 |
| W10D1 | NCU01065.1 | 3.5 (3.0) | 2.4 (3.6) | 0.090 | Ammonium transporter MEPa (A. nidulans), 0.0 |
| NP4C8 | NCU01297.1 | 2.2 (ND) | 1.8 (ND) | 0.073 | Predicted protein (N. crassa), 0.0 |
| NP4E6 | NCU06358.1 | 2.0 (1.0) | 2.9 (3.9) | 0.010 | Sugar transporter Mst-1 (A. nidulans), e-113 |
| NP4B12 | NCU07523.1 | 2.1 (ND) | 1.5 (ND) | 0.036 | Probable glucan 1,3-β-glucosidase (Blumeria graminis), 0.0 |
| W07E6 | NCU03530.1 | 2.4 (ND) | 1.5 (ND) | 0.009 | Related to chitinase 3 precursor protein (N. crassa), 6e-44 |
| W06B10 | NCU09345.1 | 2.5 (3.1) | 1.3 (2.1) | 0.010 | Thiamine biosynthesis protein NMT-1 (N. crassa), 0.0 |
| NMT-1 | NCU09345.1 | 2.1 | 1.1 | 0.004 | Thiamine biosynthesis protein NMT-1 (N. crassa), 0.0 |
| W06E6 | NCU06380.1 | 1.6 (ND) | 3.6 (ND) | 0.010 | Contain a ZIP Zinc transporter domain (pfam0235), 2e-39 |
| NM1C4 | NCU02500.1 | 1.6 | 2.8 | 0.034 | Clock-controlled pheromone precursor (N. crassa), e-160 |
| NC1H2 | NCU02500.1 | 1.5 | 4.2 | 0.002 | Clock-controlled pheromone precursor (N. crassa), e-160 |
| CCG-4 | NCU02500.1 | 1.1 (2.8) | 2.7 (8.4) | 0.004 | Clock-controlled pheromone precursor (N. crassa), e-160 |
| Class IV | |||||
| W13G8 | NCU06249.1 | 2.0 (ND) | 1.2 (ND) | 0.010 | Related to ser/thr-protein kinase (S. cerevisae), 1e-76 |
| NP4A9 | NCU05888.1 | 2.1 (ND) | 0.7 (ND) | 0.001 | Coenzyme F420-dependent N5, N10-methylene tetrahydromethanopterin reductase (Azotobacter), e-126 |
| Class V | |||||
| NM3H1 | NCU08870.1 | 1.5 (ND) | 2.4 (ND) | 0.147 | Conserved hypothetical protein (M. grisea), 4e-18 |
| NM3H4 | NCU02793.1 | 1.4 (ND) | 4.4 (ND) | 5.74E-04 | Conserved hypothetical protein (M. grisea), e-143 |
Values in parentheses represent ratio quantitated by phosphorimager analysis of Northern blots. Values in italics indicate t-test P-values that are not significantly different from 1.0 (not distinguishable from wild type). ND, no signal detected in Northern blot analysis.
Nonparametric one-way ANOVA (Welch t-test) P-value in comparison between affects of mak-2 and pp-1.
ANOVA was applied to determine if the difference in regulation by mak-2 and pp-1 was significant (Tables 3 and 4). In most cases, genes in class I showed no significant differential regulation (P-value >0.05) while the observed differential regulation displayed by the class IV and V genes were supported (P-value <0.05). About half of the genes in class III also showed significant differential regulation (P-value <0.05). Thus, the ANOVA analysis was consistent with the classification of gene expression assigned on the basis of expression ratios in conjunction with the t-test P-values. In addition, although mak-2 and pp-1 are both involved in repressing the expression of the class III genes, the magnitude of the regulatory effect of mak-2 or pp-1 differed significantly for some of the genes (Table 3).
Several genes were represented by more than one cDNA and in most cases displayed consistent results (Tables 3 and 4). Additionally, mkr-3 was present on the microarray and was assigned as a class I gene as expected from Northern blot analysis. Northern blot analysis of representative genes was performed and expression ratios based on phosphoimager analysis were consistent with the microarray results (Tables 3 and 4).
DISCUSSION
Here we have isolated and characterized two genes regulating the mating pathway of N. crassa. The mak-2 gene contains an open reading frame encoding a protein with 92.4% identity to Pmk1p, the ortholog of S. cerevisiae Fus3p. PP-1 shares 64.8% identity with Mst12p of M. grisea, particularly in the homeodomain in the N-terminal region (amino acids 60–204) and two conserved C2/H2-Zn2+ finger domains in the C-terminal region (amino acids 595–615, 621–643) (Park et al. 2002). It is unknown if each of the two putative DNA-binding domains contributes to unique roles of the protein. It will be of interest to test the phenotypes of point mutations that independently eliminate the function of each DNA-binding domain. A conserved proline in the homeodomain region at amino acid position 101 of PP-1 fits the consensus for a MAP kinase-binding site, suggesting a possible interaction between MAK-2 and PP-1.
The nrc-1 gene, encoding a homolog of the yeast Ste11 MAPKK kinase, has been characterized (Kothe and Free 1998). The nrc-1 null mutants displayed an abnormal morphology of the hyphae resembling the budding growth observed during conidiophore development. This suggests that the derepressed conidiation observed in mak-2 mutants might be extreme in the nrc-1 mutant. In addition, nrc-1 mutants are female sterile and as a male parent produce “flattened” inviable ascospores (Kothe and Free 1998). These common phenotypes suggest that nrc-1, mak-2, and pp-1 are part of the same MAP kinase-signaling cascade with nrc-1 acting upstream of mak-2 and pp-1 in regulating sexual and asexual development. The more severe phenotypes of mutations further upstream in the MAP kinase cascade indicate the occurrence of regulatory branch points at each step in the pathway. An additional phenotype for nrc-1, mak-2, and pp-1 is a defect in hyphal fusion (Pandey et al. 2004), further suggesting a pathway involving these three regulatory genes.
mak-2 and pp-1 affect growth and development:
The mak-2 and pp-1 mutants have reduced growth rate on solid medium. Reduced growth rate was also reported for the corresponding MAP kinase mutants in other fungi, including bmp1 in Botrytis cinerea, chk1 in Cochliobolus heterostrophus, fmk1 in Fusarium oxysporum, and ubc3 in Ustilago maydis (Lev et al. 1999; Mayorga and Gold 1999; Zheng et al. 2000; Di Pietro et al. 2001). However, reduced growth rate was not noted for other fungal species, such as M. grisea, Colletotrichum lagenarium, and Claviceps purpurea (Xu and Hamer 1996; Takano et al. 2000; Mey et al. 2002). Interestingly, the function of most ste12 homologs in other filamentous fungi, such as MST12 in M. grisea, cph1 in Candida albicans, cls12 in Candida lusitaniae, steA in A. nidulans, stlA in Penicillium marneffei, and ste12 a and steα in Cryptococcus neoformans, was not required for vegetative growth but was restricted to sexual development and processes involved in pathogenicity (Liu et al. 1994; Chang et al. 2000, 2001; Vallim et al. 2000; Young et al. 2000; Borneman et al. 2001; Park et al. 2002). Thus, the influence of this conserved MAP kinase-signaling pathway on vegetative growth is a species-specific phenomenon.
Functional differences of this MAP kinase pathway also exist in filamentous fungi with respect to asexual sporulation. The fus3/kss1 and ste12 homologs were found to be dispensable for conidiation in M. grisea (PMK1, MST12), C. purpurea (cpmk1), B. cinereus (bmp1), F. oxysporum (fmk1), A. nidulans (steA), and P. marneffei (stlA) (Xu and Hamer 1996; Vallim et al. 2000; Zheng et al. 2000; Borneman et al. 2001; Di Pietro et al. 2001; Mey et al. 2002; Park et al. 2002). However, chk1-deletion mutants of C. heterostrophus have poorly developed aerial hyphae and fail to produce conidia (Lev et al. 1999). Similarly, conidiation is “significantly reduced” in C. lagenarium cmk1-deletion mutants (Takano et al. 2000). Interestingly, N. crassa mak-2 and pp-1 null mutants have stunted aerial hyphae, but produce a yield of conidia similar to that of the wild type. These observations indicate that the activities of the mak-2 and pp-1 genes are essential for development of aerial hyphae and inhibitory to conidial morphogenesis. Additionally, since the derepression of conidiation in mak-2 mutants was more severe than that in the pp-1 mutant (but less severe than that in adenylate cyclase (cr-1) mutants (Ivey et al. 2002)), it is likely that MAK-2 negatively regulates conidial development through factors in addition to PP-1.
mak-2- and pp-1-regulated genes:
We used subtractive enrichment cloning and microarray analysis to identify genes that are regulated by mak-2 and pp-1 (mkr genes) to learn how this pathway regulates sexual and asexual development and to identify other processes regulated by this pathway, such as production of secondary metabolites. Because the major phenotypes observed in the mutants were an absence of protoperithecia and aerial hyphae, we expected to identify genes whose expression is specific to these tissue types.
Most genes requiring mak-2 for their expression also required pp-1, supporting the view that activation of genes by the MAK-2 kinase pathway involves PP-1. These class I genes represent a variety of cellular functions but, as expected, include genes expressed during protoperithecia formation. These include poi-2, a gene identified as abundantly expressed in perithecia-containing cultures (Nelson et al. 1997), and the mkr-3 gene identified by subtractive enrichment in this study.
The class III genes appear to be downregulated by mak-2 and pp-1. However, class IV and V genes were repressed by either MAK-2 or PP-1 but not by both, potentially indicating the existence of other factors in the MAK-2 kinase pathway for its repression function. This hypothesis might explain the observation that the depression of conidiation in the mak-2 mutant is more severe than that in the pp-1 mutant in submerged culture.
Several other N. crassa mutants that show similar or overlapping phenotypes with mak-2 and pp-1 mutants have been described (Perkins et al. 2001). It is possible that some of these genes are components that are involved in the mak-2 pathway in N. crassa. For example, asm-1 (ascospore maturation-1, NCU01414.1) is a regulatory gene that plays a key role in sexual development and contributes to asexual development as well (Aramayo and Metzenberg 1996; Aramayo et al. 1996). Deletion mutants of asm-1 show phenotypes including stunted aerial hyphae, slow conidial germination, absence of protoperithecia, and ascospore lethality. The ASM-1 protein contains a potential MAP kinase-binding motif (amino acid 289) and several potential serine/threonine phosphorylation sites (data not shown). ASM-1 could be another downstream target of MAK-2.
MAP kinase and the cAMP-signaling pathways:
The N. crassa cr-1 gene encodes adenylate cyclase, which regulates the intracellular cyclic AMP (cAMP) level and is the first key component in the PKA pathway in N. crassa (Ivey et al. 2002). The cr-1 null mutants share phenotypes with mak-2 and pp-1, including slow growth, lack of aerial hyphae, and dense premature conidiation (Kays et al. 2000; Ivey et al. 2002; Yang et al. 2002), suggesting the potential for cross talk between the cAMP and MAP kinase-signaling pathways. Different patterns of cross talk between the MAP kinase and the PKA-signaling pathways have been discovered in several fungi (Lengeler et al. 2000). However, since the cr-1 mutants can form protoperithecia and produce viable ascospores after crossing, it is obvious that any cross talk affects only asexual development. Additionally, the vegetative growth defects of cr-1 null mutants are more severe than those observed for mak-2 and pp-1, and exogenous cAMP does not restore the mak-2 and pp-1 aerial hyphae defects as it does for cr-1 mutants. This indicates that the PKA pathway may act upstream of the MAP kinase pathway to regulate production of aerial hyphae and inhibit premature conidiophore development (Figure 6). Furthermore, three Gα proteins and one Gβ protein, GNA-1, GNA-2, GNA-3, and GNB-1, have been identified in N. crassa and shown to be positive regulators of adenylate cyclase (Kays et al. 2000; Ivey et al. 2002; Yang et al. 2002). Mutations in these G proteins cause defects in vegetative growth, aerial hyphae formation, conidiation, and female fertility, which are partially shared with the mak-2 and pp-1 mutants. These G proteins may be indirect regulators of asexual development through their affects on cAMP levels. Additionally, the gna-1 and cr-1 double mutants have more severe defects in vegetative and aerial hyphae growth than the single mutants, and, unlike the cr-1 mutant, the gna-1 and gna-1; cr-1 double mutants are refractory to rescue by exogenous cAMP (Ivey et al. 2002). This indicates that in addition to the known role of gna-1 in regulating the PKA pathway, the G proteins also regulate asexual development through another pathway, which might also involve the mak-2 MAP kinase pathway. Furthermore, G proteins also play critical roles in female fertility (Kays et al. 2000; Ivey et al. 2002; Yang et al. 2002), although the defects are less severe than those for mak-2 or pp-1 mutants. Conceivably, these G proteins might have a direct influence on the mak-2 MAP kinase pathway's role in sexual development, analogous to that of GPA1 in the S. cerevisiae FUS3 MAP kinase pathway (Gustin et al. 1998). Thus, there are several ways in which the MAP kinase pathway may regulate development by acting downstream of cAMP and G-protein signaling (Figure 6).
Figure 6.—

Model for MAP kinase pathway regulation of gene expression and development. (A) The cAMP-signaling pathway may regulate the mak-2-related MAP kinase pathway to control aerial development or the two pathways may act independently. (B) Conidiophore development is repressed by the cAMP pathway directly or by its effect on the MAK-2 pathway. On the basis of microarray and enhanced conidiation of the mutants, MAK-2 exerts a stronger effect than PP-1 and MAK-2 may act through PP-1 and another (?) factor to repress conidiation. (C) Protoperithecial development and ascospore lethality depend on the MAK-2 pathway and is independent of cAMP signaling.
Regulation of plant-association genes:
Plant cell-wall-degrading enzymes and secondary metabolites are important virulence factors in pathogenesis. In nature, N. crassa produces perithecia embedded within colonized plant tissue; thus, production of at least some plant cell-wall-degrading enzymes may be associated with perithecia production and may be under control of the MAP kinase pathway. The KSS1 MAP kinase pathway positively regulates the expression of a polygalacturonase gene, which is involved in invasive growth in S. cerevisiae (Madhani et al. 1999). However, in N. crassa, expression of two exopolygalacturonase genes (NCU02369.1 and NCU06961.1) was not dependent on mak-2 or pp-1 during sexual or asexual development (data not shown). This is consistent with findings for a polygalacturonase of F. oxysporum (Di Pietro et al. 2001). However, the class II gene NCU05789.1 and the class III gene NCU07523.1 encode members of apparent 1,3-β-glucanase gene families in N. crassa. No clear homologs of these genes are present in S. cerevisiae; however, the plant pathogens M. grisea and F. graminearum each have multiple members of each of these 1,3-β-glucanase families. Cell-wall-degrading enzymes are considered virulence factors in fungus-plant interactions. Interestingly, the class I gene NCU05521.1 encodes a close homolog of the PATH531 protein from M. grisea that is annotated as being required for plant pathogenesis.
Additionally, we observed a gene cluster on chromosome I in N. crassa, including three mkr genes (mkr-2, -3, and -6) and a putative polyketide synthase ORF. Northern blot analysis and RT-PCR results indicate that this secondary metabolite cluster is expressed during sexual development, particularly during protoperithecia formation. However, the specific function of this pks cluster is still unknown. A homologous pks cluster in contig 2.2111 in M. grisea contains all but 1 of the 11 genes in the pks cluster in the N. crassa (contig 3.152) with only a few differences in the order and orientations of several genes (Figure 5). This suggests that the conserved genes do form part of a cluster of genes involved in production of a metabolite. It is interesting that no other sequenced organisms contain an orthologous cluster, including Podospora anserina (http://podospora.igmors.u-psud.fr), a fungus much more closely related to N. crassa than is M. grisea. Interestingly, P. anserina is not a plant-associated fungus. Although N. crassa is known to colonize only dead plant material, this polyketide cluster may play a role in promoting plant association in N. crassa and M. grisea. Another attractive possibility is that such a metabolite may serve as a signal-regulating intrahyphal communication. It has been hypothesized (Pandey et al. 2004) that such a diffusible compound may help regulate hyphal fusion, a phenomenon absent in mak-2 and pp-1 mutants. Additionally, the activity of these compounds might be important for protoperithecium morphogenesis.
We conclude that the role of the mak-2/pp-1 pathway in both sexual and asexual development, and in regulating plant cell-wall-degrading enzymes, secondary metabolites, and homologs of plant pathogenicity genes, is consistent with the dual regulation of the mating process and pathogencity/invasive growth observed in many fungal pathogens. Thus, analysis of this MAP kinase pathway is likely to provide an important perspective on the evolution of a major regulatory pathway governing fungal pathogenesis. Although we do not know if the ancestor of N. crassa was saprophytic or parasitic, N. crassa does possess the basic gene content thought to be essential for plant pathogenesis. We hypothesize that, in general, plant pathogenesis could have evolved through modification of the existing regulatory pathways and gene content found in saprophytic progenitor fungi similar to Neurospora.
Acknowledgments
We thank the Laboratory for Functional Genomics, Department of Biology, Texas A&M University and Terry Thomas for assistance with array spotting and the Gene Technology Laboratory, Department of Biology, Texas A&M University for assistance with DNA sequencing and oligonucleotide synthesis. We also thank James Sweigard for a gift of chlorimuron ethyl. This work was supported by National Science Foundation grant MCB-9974608 to D.J.E.
References
- Aramayo, R., and R. Metzenberg, 1996. Meiotic transvection in fungi. Cell 86 103–113. [DOI] [PubMed] [Google Scholar]
- Aramayo, R., Y. Peleg, R. Addison and R. Metzenberg, 1996. Asm-1+, a Neurospora crassa gene related to transcriptional regulators of fungal development. Genetics 144 991–1003. [DOI] [PMC free article] [PubMed] [Google Scholar]
- Borneman, A. R., M. J. Hynes and A. Andrianopoulos, 2001. An STE12 homolog from the asexual, dimorphic fungus Penicillium marneffei complements the defect in sexual development of an Aspergillus nidulans steA mutant. Genetics 157 1003–1014. [DOI] [PMC free article] [PubMed] [Google Scholar]
- Breitkreutz, A., and M. Tyers, 2002. MAPK signaling specificity: it takes two to tango. Trends Cell Biol. 12 254–257. [DOI] [PubMed] [Google Scholar]
- Chang, Y. C., B. L. Wickes, G. F. Miller, L. A. Penoyer and K. J. Kwon-Chung, 2000. Cryptococcus neoformans STE12a regulates virulence but is not essential for mating. J. Exp. Med. 191 871–882. [DOI] [PMC free article] [PubMed] [Google Scholar]
- Chang, Y. C., L. A. Penoyer and K. J. Kwon-Chung, 2001. The second STE12 homologue of Cryptococcus neoformans is MATa-specific and plays an important role in virulence. Proc. Natl. Acad. Sci. USA 98 3258–3263. [DOI] [PMC free article] [PubMed] [Google Scholar]
- Davis, R. H., and F. J. De Serres, 1970. Genetic and microbial research techniques for Neurospora crassa. Methods Enzymol. 17 79–143. [Google Scholar]
- DeRisi, J. L., V. R. Iyer and P. O. Brown, 1997. Exploring the metabolic and genetic control of gene expression on a genomic scale. Science 278 680–686. [DOI] [PubMed] [Google Scholar]
- Di Pietro, A., F. I. Garcia-Maceira, E. Meglecz and M. I. G. Roncero, 2001. A mitogen-activated protein kinase of the vascular wilt fungus Fusarium oxysporum is dispensable for vegetative growth but essential for pathogenicity. Mol. Microbiol. 39 1140–1152. [PubMed] [Google Scholar]
- Engelen, K., B. Coessens, K. Marchal and B. De Moor, 2003. MARAN: normalizing microarray data. Bioinformatics 19 893–894. [DOI] [PubMed] [Google Scholar]
- Galagan, J. E, S. E. Calvo, K. A. Borkovich, E. U. Selker, N. D. Read et al., 2003. The genome sequence of the filamentous fungus Neurospora crassa. Nature 422 859–868. [DOI] [PubMed] [Google Scholar]
- Gustin, M. C., J. Albertyn, M. Alexander and K. Davenport, 1998. MAP kinase pathways in the yeast Saccharomyces cerevisiae. Microbiol. Mol. Biol. Rev. 62 1264–1300. [DOI] [PMC free article] [PubMed] [Google Scholar]
- Ivey, F. D., A. M. Kays and K. A. Borkovich, 2002. Shared and independent roles for a Gαi protein and adenylyl cyclase in regulating development and stress responses in Neurospora crassa. Eukaryot. Cell 1 634–642. [DOI] [PMC free article] [PubMed] [Google Scholar]
- Kays, A. M., and K. A. Borkovich, 2004. Severe impairment of growth and differentiation in a Neurospora crassa mutant lacking all heterotrimeric Gα proteins. Genetics 166 1229–1240. [DOI] [PMC free article] [PubMed] [Google Scholar]
- Kays, A. M., P. S. Rowley, R. A. Baasiri and K. A. Borkovich, 2000. Regulation of conidiation and adenylyl cyclase levels by the Gα protein GNA-3 in Neurospora crassa. Mol. Cell. Biol. 20 7693–7705. [DOI] [PMC free article] [PubMed] [Google Scholar]
- Kim, H., and K. A. Borkovich, 2004. A pheromone receptor gene, pre-1, is essential for mating type-specific directional growth and fusion of trichogynes and female fertility in Neurospora crassa. Mol. Microbiol. 52 1781–1798. [DOI] [PubMed] [Google Scholar]
- Kothe, G. O., and S. J. Free, 1998. The isolation and characterization of nrc-1 and nrc-2, two genes encoding protein kinases that control growth and development in Neurospora crassa. Genetics 149 117–130. [DOI] [PMC free article] [PubMed] [Google Scholar]
- Kultz, D., 1998. Phylogenetic and functional classification of mitogen- and stress-activated protein kinases. J. Mol. Evol. 46 571–588. [DOI] [PubMed] [Google Scholar]
- Lengeler, K. B., R. C. Davidson, C. D'souza, T. Harashima and W. C. Shen, et al., 2000. Signal transduction cascades regulating fungal development and virulence. Microbiol. Mol. Biol. Rev. 64 746–785. [DOI] [PMC free article] [PubMed] [Google Scholar]
- Lev, S., A. Sharon, R. Hadar, H. Ma and B. A. Horwitz, 1999. A MAPK of the corn leaf pathogen Cochliobolus heterostrophus is involved in conidiation, appressorium formation, and pathogenicity: Diverse roles for MAPK homologs in foliar pathogens. Proc. Natl. Acad. Sci. USA 96 13542–13547. [DOI] [PMC free article] [PubMed] [Google Scholar]
- Lewis, Z. A., A. Correa, C. Schwerdtfeger, K. Link, X. Xie et al., 2002. Overexpression of WHITE COLLAR-1 (WC-1) activates circadian clock-associated genes, but is not sufficient to induce most light-regulated gene expression in Neurospora crassa. Mol. Microbiol. 45 917–931. [DOI] [PubMed] [Google Scholar]
- Liu, H., J. Kohler and G. R. Fink, 1994. Suppression of hyphal formation in Candida albicans by mutation of a STE12 homolog. Science 266 1723–1726. [DOI] [PubMed] [Google Scholar]
- Madhani, H. D., T. Galitski, E. S. Lander and G. R. Fink, 1999. Effectors of a developmental mitogen-activated protein kinase cascade revealed by expression signatures of signaling mutants. Proc. Natl. Acad. Sci. USA 96 12530–12535. [DOI] [PMC free article] [PubMed] [Google Scholar]
- Margolin, B. S., M. Frietag and E. L. Selker, 1997. Improved plasmid for gene targeting at the his-3 locus of Neurospora crassa by electroporation. Fungal Genet. Newsl. 44 34–36. [Google Scholar]
- Mayorga, M. E., and S. E. Gold, 1999. A MAP kinase encoded by the ubc3 gene of Ustilago maydis is required for filamentous growth and full virulence. Mol. Microbiol. 34 485–497. [DOI] [PubMed] [Google Scholar]
- Mey, G., B. Oeser, M. H. Lebrun and P. Tudzynski, 2002. The biotrophic, non-appressorium-forming grass pathogen Claviceps purpurea needs a Fus3/Pmk1 homologous mitogen-activated protein kinase for colonization of rye ovarian tissue. Mol. Plant-Microbe Interact. 15 303–312. [DOI] [PubMed] [Google Scholar]
- Nelson, M. A., S. Kang, E. L. Braun, M. E. Crawford, P. L. Dolan et al., 1997. Expressed sequences from conidial, mycelial, and sexual stages of Neurospora crassa. Fungal Genet. Biol. 21 343–368. [DOI] [PubMed] [Google Scholar]
- Obenauer, C. J., C. L. Cantley and B. M. Yaffe, 2003. Scansite 2.0: proteome-wide prediction of cell signaling interactions using short sequence motifs. Nucleic Acids Res. 31 3635–3641. [DOI] [PMC free article] [PubMed] [Google Scholar]
- Orbach, M. J., 1994. A cosmid with a HygR marker for fungal library construction and screening. Genetics 150 159–162. [DOI] [PubMed] [Google Scholar]
- Pandey, A., M. G. Roca, N. D. Read and N. L. Glass, 2004. Role of a mitogen-activated protein kinases pathway during conidial germination and hyphal fusion in Neurospora crassa. Eukaryot. Cell 3 348–358. [DOI] [PMC free article] [PubMed] [Google Scholar]
- Park, G., C. Xue, L. Zheng, S. Lam and J.-R. Xu, 2002. MST12 regulates infectious growth but not appressorium formation in the rice blast fungus Magnaporthe grisea. Mol. Plant-Microbe. Interact. 15 183–192. [DOI] [PubMed] [Google Scholar]
- Perkins, D. D., and N. B. Raju, 1986. Neurospora discreta, a new heterothallic species defined by its crossing behavior. Exp. Mycol. 10 323–338. [Google Scholar]
- Perkins, D. D., A. Radford and M. S. Sachs, 2001 The Neurospora Compendium. Academic Press, San Diego.
- Sachs, M. S., and C. Yanofsky, 1991. Developmental expression of genes involved in conidiation and amino acid biosynthesis in Neurospora crassa. Dev. Biol. 148 117–128. [DOI] [PubMed] [Google Scholar]
- Sambrook, J., and D. W. Russell, 1989 Molecular Cloning. Cold Spring Harbor Laboratory Press, New York.
- Sweigard, J., F. Chumley, A. Carroll, L. Farrall and B. Valent, 1997. A series of vectors for fungal transformation. Fungal Genet. Newsl. 44 52–53. [Google Scholar]
- Takano, Y., T. Kikuchi, Y. Kubo, J. E. Hamer, K. Mise et al., 2000. The Colletotrichum lagenarium MAP kinase gene CMK1 regulates diverse aspects of fungal pathogenesis. Mol. Plant-Microbe. Interact. 13 374–383. [DOI] [PubMed] [Google Scholar]
- Tusher, V. G., R. Tibshirani and G. Chu, 2001. Significance analysis of microarrays applied to the ionizing radiation response. Proc. Natl. Acad. Sci. USA 98 5116–5121. [DOI] [PMC free article] [PubMed] [Google Scholar]
- Vallim, M., K. Y. Miller and B. L. Miller, 2000. Aspergillus SteA (Sterile12-like) is a novel homeodomain/C2/H2-Zn+2 finger transcription factor required for sexual reproduction. Mol. Microbiol. 36 290–301. [DOI] [PubMed] [Google Scholar]
- Vollmer, S. J., and C. Yanofsky, 1986. Efficient cloning of genes of Neurospora crassa. Proc. Natl. Acad. Sci. USA 83 4869–4873. [DOI] [PMC free article] [PubMed] [Google Scholar]
- Wang, Z., and D. D. Brown, 1991. A gene expression screen. Proc. Natl. Acad. Sci. USA 88 11505–11509. [DOI] [PMC free article] [PubMed] [Google Scholar]
- Xie, X., H. H. Wilkinson, A. Correa, Z.A. Lewis, D. Bell-Pedersen et al., 2004. Transcriptional response to glucose starvation and functional analysis of a glucose transporter of Neurospora crassa. Fungal Genet. Biol. 41 1101–1119. [DOI] [PubMed] [Google Scholar]
- Xu, J.-R., 2000. MAP kinases in fungal pathogens. Fungal Genet. Biol. 31 137–152. [DOI] [PubMed] [Google Scholar]
- Xu, J.-R., and J. E. Hamer, 1996. MAP kinases and cAMP signaling regulate infection structure formation and pathogenic growth in the rice blast fungus Magnaporthe grisea. Genes. Dev. 10 2696–2706. [DOI] [PubMed] [Google Scholar]
- Yang, Q., S. I. Poole and K. A. Borkovich, 2002. A G-protein α-subunit required for sexual and vegetative development and maintenance of normal Gα protein levels in Neurospora crassa. Eukaryot. Cell 1 378–390. [DOI] [PMC free article] [PubMed] [Google Scholar]
- Young, L. Y., M. C. Lorenz and J. Heitman, 2000. A STE12 homolog is required for mating but dispensable for filamentation in Candida lusitaniae. Genetics 155 17–29. [DOI] [PMC free article] [PubMed] [Google Scholar]
- Zheng, L., M. Campbell, J. Murray, S. Lam and J.-R. Xu, 2000. The BMP1 MAP kinase is essential for fungal pathogenesis in the gray mold fungus Botrytis cinerea. Mol. Plant-Microbe. Interact. 13 724–732. [DOI] [PubMed] [Google Scholar]