

Abstract
T cells are activated by recognition of foreign peptides displayed on the surface of antigen presenting cells (APCs), an event that triggers assembly of a complex microscale structure at the T cell–APC interface known as the immunological synapse (IS). It remains unresolved whether the unique physical structure of the synapse itself impacts the functional response of T cells, independent of the quantity and quality of ligands encountered by the T cell. As a first step toward addressing this question, we created multicomponent protein surfaces presenting lithographically defined patterns of tethered T cell receptor (TCR) ligands (anti-CD3 “activation sites”) surrounded by a field of tethered intercellular adhesion molecule-1 (ICAM-1), as a model substrate on which T cells could be seeded to mimic T cell–APC interactions. CD4+ T cells seeded on these surfaces polarized and migrated; on contact with activation sites, T cells assembled an IS with a structure modulated by the physical pattern of ligand encountered. On surfaces patterned with focal spots of TCR ligand, T cells stably interacted with activation sites, proliferated, and secreted cytokines. In contrast, T cells interacting with activation sites patterned to preclude centralized clustering of TCR ligand failed to form stable contacts with activation sites, exhibited aberrant PKC-θ clustering in a fraction of cells, and had significantly reduced production of IFN-γ. These results suggest that focal clustering of TCR ligand characteristic of the “mature” IS may be required under some conditions for full T cell activation.
Keywords: protein patterned surface, T cell activation
Microscale patterns of proteins immobilized on surfaces can be used to dissect the role of spatial organization in the signals transferred to cells from the extracellular matrix or other cells (1, 2). By presenting ligands in a spatially defined manner from a synthetic substrate, cell functions such as life or death (3), adhesion and migration (4, 5), receptor clustering and membrane compartmentalization (6), and differentiation (7) can be controlled, and the role of physical patterns of cell- or extracellular matrix-derived signals on cell responses can be elucidated. Studies of this type have to date primarily focused on cell responses to a single signaling or adhesion protein patterned into defined regions, surrounded by a “background” that lacks protein (3–7). However, surfaces comprising multiple signaling proteins patterned into distinct regions on cellular and subcellular length scales would be useful for the study of the complex, spatially organized receptor–ligand interactions that occur in many cell–cell and cell–extracellular matrix contacts (8–12).
The interactions between T cells and antigen-presenting cells (APCs) during T cell activation provide a stunning example of such complexity. T cells are activated when their T cell receptors (TCRs) recognize and engage antigenic peptides displayed on the surface of APCs. This initial event triggers receptor pairs in the membranes of the two cells to assemble an organized structure at the cell–cell contact site termed an immunological synapse (IS) (8, 12). The “mature” IS formed by T cells encountering high densities of agonist peptides is composed of a central cluster of TCRs engaging foreign peptide–MHC molecules on the APC surface, surrounded by a concentric ring of T cell integrins, particularly lymphocyte function-associated antigen-1 (LFA-1), binding APC intercellular adhesion molecule-1 (ICAM-1) adhesion receptors in the periphery of the contact region (8, 12). Intriguingly, this mature IS structure is only one of several supramolecular organizations observed in T cell–APC communication: inverse patterns of receptor clustering (i.e., signaling receptors clustered peripherally around a central accumulation of adhesion receptors) have been observed in the first few minutes of T cell activation before formation of a mature IS (8, 13); T cells encountering low (but fully activating) densities of foreign peptides show diffuse receptor clustering in the interface (14–16); immature T cells exhibit multifocal clusters of receptors during interactions with APCs during positive selection (17, 18); and naive T cell–dendritic cell conjugates have been reported to form only nanoscale clusters of receptors in their synapse (19).
Motivated by this phenomenological diversity in synapse structures, there is great interest in understanding how different patterns of receptor and intracellular signaling molecule clustering at immune cell–cell interfaces may impact lymphocyte functional responses (20, 21). For example, Mossman et al. (22), using patterned lipid bilayers where T cell ligands were confined to μm-scale “corrals,” showed that initial TCR signaling could be altered by preventing central clustering of TCR (22). As an alternative strategy, we fabricated engineered surfaces designed to “replace” the APC and present multiple protein ligands to T cells in fixed physical patterns, mimicking (or not) the organization observed in native synapses, as a tool to dissect the role of this structure in directing T cell functions. We developed an approach to pattern arrays of “activation sites” containing immobilized TCR ligands in defined geometries, surrounded by immobilized adhesion proteins in an “adhesion field” (Fig. 1). We hypothesized that T cells seeded onto such a surface would initially polarize and migrate on the adhesion field, mimicking their migration within lymph nodes in search of antigen (23, 24). T cells encountering an activation site would be presented with a defined physical distribution of ligand; for the mature IS protein pattern shown in Fig. 1, the responding cell would “see” a concentric distribution of TCR ligands and adhesion ligands mimetic of the receptor organization on the APC surface during native T cell triggering. We found that such “immunological synapse arrays” supported robust T cell migration. On contact with activation sites, T cells responded in a manner characteristic of live APC–T cell interactions: T cells stopped migration, elevated intracellular calcium, and accumulated receptors and signaling molecules at the interface in a manner dependent on the pattern of ligands presented from activation sites. Synapse arrays mimicking the structure of the mature IS triggered full T cell activation, including IL-2 and IFN-γ secretion. Interestingly, we found that alteration of the structure of activation sites not only altered the physical pattern of receptor and intracellular signaling molecule assembly in T cells, but also influenced endpoint functional responses of the responding cells.
Fig. 1.

Schematic of immunological synapse array surface pattern.
Results and Discussion
Fabrication of Immunological Synapse Arrays.
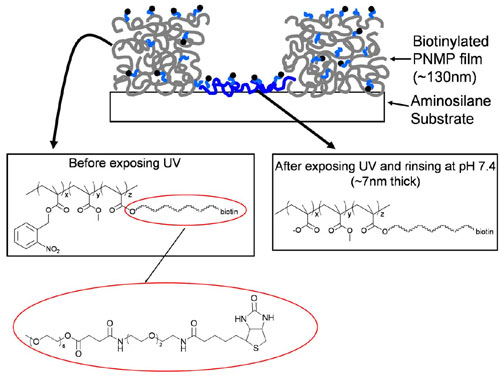
We first sought to create arrays of “focal” T cell activation sites, surrounded by a field of tethered adhesion molecules, as schematically illustrated in Fig. 1. An antibody against the CD3ε chain of the TCR complex (25) was tethered to surfaces within the activation sites, as a commonly used surrogate for the T cell receptor’s native ligand (peptide–MHC complexes) (26, 27), whereas recombinant ICAM-1 was immobilized in the adhesion field. We hypothesized that such surfaces would allow T cells engaging an activation site to ligate LFA-1 in a peripheral distribution around the central patch of TCR ligands, mimicking the microscale organization of the mature immunological synapse (8, 12). To create these surfaces, we first extended an approach we previously reported for patterning using a biotinylated photoresist copolymer, poly(o-nitrobenzyl methacrylate-r-methyl methacrylate-r-poly(ethylene glycol) methacrylate) (PNMP) (28), to achieve multicomponent patterning of commercially available, multibiotinylated proteins. The assembly procedure and resulting surface structures are schematically illustrated in Fig. 2A. This process is enabled by the polyelectrolyte structure of UV-irradiated PNMP: on UV exposure, the o-nitrobenzyl groups of the photoresist are cleaved to create carboxylic acids (chemical structure shown in Fig. 7, which is published as supporting information on the PNAS web site). When immersed in aqueous buffer solutions at near-neutral pH, films of the UV-exposed resist immediately dissolve. However, when exposed PNMP films are immersed in aqueous solutions at slightly reduced pH (<6.5), a fraction of the carboxylate groups of the UV-exposed copolymer protonate, hydrogen bonding among the PNMP chains occurs, and the film remains intact (28). To create multicomponent protein patterns, PNMP thin films cast on cationic aminosilane glass substrates were UV exposed through a photomask to define the activation sites (Fig. 2Ai), followed by dissolution of the bulk of the film in the exposed regions by washing with PBS (pH 7.4; Fig. 2Aii). In this step, a thin layer of the exposed polyelectrolyte resist remains bound to the cationic substrate to present biotin for further protein assembly (Fig. 7). In Fig. 2Aiii, the film is exposed to UV without a mask, priming the background portions of the film (which will become the adhesion field) for dissolution. A first ligand is then immobilized over the entire surface (Fig. 2Aiv) by incubation in a pH 6.0 solution; the exposed photoresist film masking the adhesion field regions does not dissolve at this slightly reduced pH. The first ligand immobilization is followed by a gentle “erasure” of the remaining masking film by washing in PBS at pH 7.4 (Fig. 2Av). As in Fig. 2Aii, a thin molecular layer of biotinylated PNMP is retained on the substrate, providing fresh biotin groups for a final step of backfilling with a second ligand (Fig. 2Avi). This procedure allowed segregated patterning of two ligands onto surfaces, keeping the immobilized proteins fully hydrated in near-neutral pH buffers during the surface processing. Biotinylated anti-CD3 in the activation sites was tethered via a streptavidin (SAv) bridge, whereas recombinant ICAM-1/Fc fusion proteins were immobilized by means of a biotinylated anti-Fc antibody and SAv (illustrated in Fig. 2 Aiv Inset and Avi Inset).
Fig. 2.

Fabrication of immunological synapse arrays. (A) Schematic procedure of surface patterning. A PNMP thin film is irradiated through a photomask (Ai), developed with PBS (Aii), and then re-exposed to UV in the absence of a mask (Aiii). A first ligand is deposited (Aiv), followed by washing with pH 7.4 buffer (Av), and finally the second ligand is immobilized by using the newly exposed biotin groups (Avi). (Aiv and Avi Insets) The structure of protein ligand linkages to the surface. The chemical structure of the PNMP photoresist and film after UV exposure and development (Aii) is further illustrated in Fig. 7. (B) Fluorescence micrographs taken from one field of a two-component patterned surface. SAv-Texas red detecting biotinylated α-CD3 (Left), α-ICAM-1-FITC detecting ICAM-1 (Center), and their overlay (Right).
By blocking excess biotin groups of patterned anti-CD3 with Alexa Fluor 647-conjugated SAv and by detecting immobilized ICAM-1 with an FITC-conjugated anti-ICAM-1 antibody, the final spatial distribution of the two ligands on the patterned PNMP surface was visualized. Representative fluorescence images depicting the spatial patterning of anti-CD3 (far red fluorescence) and the adhesion ligand ICAM-1 (green fluorescence) in a square array of circular activation sites 6 μm in diameter are shown in Fig. 2B. As shown by the single-color and overlay images, the pattern fidelity and segregation of ligands to their respective domains by this approach was excellent. Although ICAM-1/Fc molecules were immobilized here by means of noncovalent antibody binding to the Fc portion of the fusion protein, the half-life for release of immobilized ICAM-1/Fc from the surface was ≈55 h (Fig. 8, which is published as supporting information on the PNAS web site), indicating that the ligand density changed only very slowly over the time courses studied in the experiments described below.
T Cell Responses to Immunological Synapse Arrays.
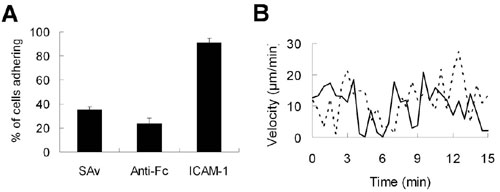
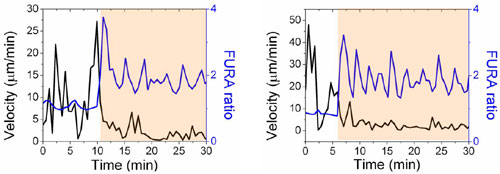
Motile T cells that encounter antigen-loaded APCs receive a “stop signal” provided by TCR triggering (29), which is closely followed by an increase in intracellular calcium levels driven by TCR signaling (30–32). We confirmed that synthetic synapse arrays elicited a similar sequence of early T cell responses by fluorescence videomicroscopy analysis of murine primary CD4+ T cell blasts interacting with surfaces patterned as shown in Fig. 2B. Importantly, the discrete presentation of TCR ligand in defined areas allowed T cells landing on the adhesion field to adopt a polarized, motile pre-antigen-contact state before TCR triggering on activation sites (Fig. 9, which is published as supporting information on the PNAS web site). Representative time-lapse images of single T cell responses to synapse surfaces presenting anti-CD3 or an isotype control IgG from the activation sites are shown in Fig. 3A and B (and, respectively, in Movies 1 and 2, which are published as supporting information on the PNAS web site). T cells migrating on control surfaces passed through activation sites presenting isotype control antibodies without stopping or altering intracellular calcium levels (Fig. 3A and Movie 1). In contrast, migrating T cells that encountered an activation site presenting anti-CD3 stopped migration, changed from a polarized to rounded morphology, and elevated intracellular calcium (Fig. 3B and Movie 2). Quantitation of the response of T cells to contact with activation sites by calculation of the cells’ instantaneous velocity and average fura ratio vs. time showed the temporal proximity of the halt in migration and calcium elevation that occurs coincident with activation site contact (illustrated in Fig. 10, which is published as supporting information on the PNAS web site, for two representative single cells). Although the diameter of the anti-CD3 activation sites examined here (and in the majority of the studies described below) was significantly larger than the typical dimensions of central supramolecular activation clusters (cSMACs) formed by T cells (8, 12), anti-CD3 activation sites with smaller diameters (4 μm, 3 μm, or 2 μm) triggered qualitatively similar migration/halt and calcium responses (data not shown). Thus, the presentation of segregated patterned protein signals from these substrates elicited dynamic T cell migration and calcium signaling behavior mirroring responses observed with live T cell–APC interactions (30).
Fig. 3.

Cell morphology and calcium signaling (tracked by fura fluorescence ratio) as single OT-II CD4+ T cells contact a control (A) or anti-CD3-presenting (B) activation site of a synapse array.
In addition to controlling T cell activation state, the segregated presentation of “stop” (TCR ligand) and “go” (ICAM-1) signals from patterned surfaces led to self-assembly of T cells on the array sites. T cells migrated randomly on synapse surfaces until activation sites were encountered; once triggered by an activation site, responding cells generally centered themselves over the activation site and maintained a long-lasting (≈7–17 h) contact. Within 30 min at optimal T cell seeding densities (≈1.5 cells seeded on the surface per activation site), the majority of the activation sites were occupied by single T cells (Fig. 11, which is published as supporting information on the PNAS web site). Such cellular self-organization dictated by surface patterns could be used to prevent or promote cell–cell contacts as well as cell–substrate contacts.
Synapse Arrays Drive Full T Cell Activation.
We next asked whether patterned anti-CD3/ICAM-1 surfaces elicited full activation of T cells, including proliferation and cytokine production. Because the photolithographic process used allows entire large-area substrates to be accurately patterned, single-cell as well as population assays are possible with these array surfaces. By using videomicroscopy, T cell division triggered by activation sites was directly observed, as illustrated by the time-lapse image sequence of a T cell dividing on one of the array activation sites ≈20 h postseeding (Fig. 4A and Movie 3, which is published as supporting information on the PNAS web site). Interestingly, we observed that daughter cells formed after cell division were ignorant of activation sites and rapidly migrated through TCR ligand-presenting regions with only transient pauses (≈10 min) or without stopping at all for up to 3 h after cell division (unpublished data). Unlike uniformly coated anti-CD3 substrates commonly used to elicit polyclonal T cell activation, here T cells can migrate away from the activation sites, as they can when interacting with discrete live APCs in vitro or in vivo.
Fig. 4.

Synapse arrays induce proliferation and cytokine production in primed CD4+ T cell blasts. (A) Time-lapse image sequence depicting a 5C.C7 CD4+ T cell undergoing cell division on a synapse array surface. Arrows track the original cell and resulting two daughter cells. (B and C) IL-2 (B) and IFN-γ (C) production by OT-II CD4+ T cell blasts incubated on surfaces for 48 h (shown are average ± SEM for one representative experiment of three).
At the population level, we measured the secretion of the T cell growth factor IL-2 and the effector cytokine IFN-γ by T cells interacting with synapse arrays presenting patterned anti-CD3/ICAM-1 or control ligands (anti-CD3/SAv or isotype IgG/ICAM-1) in the activation site/adhesion field regions (Fig. 4 B and C). Higher levels of IL-2 and IFN-γ production were seen on the anti-CD3/ICAM-1 surfaces than on those of anti-CD3/SAv, possibly due to rapid T cell motility and subsequent encounter of T cells with activation sites and/or costimulation delivered from LFA-1 engagement of ICAM-1 (33, 34). Negligible amounts of cytokine were produced by T cells cultured on isotype IgG/ICAM-1-patterned surfaces. Cytokine production was also triggered by 3-μm-diameter activation sites, and titration of the density of tethered anti-CD3 within 6-μm-diameter activation sites revealed a dose-dependent response of IL-2 production with anti-CD3 density (Fig. 12, which is published as supporting information on the PNAS web site).
Altogether, these results demonstrate that patterned synapse arrays can elicit full T cell functional responses, and allow single-cell dynamics of T cells over extraordinary time intervals and at times as late as the onset of cell division to be tracked.
Modulation of Cell Surface and Intracellular Protein Clustering by Synapse Array Microstructure.
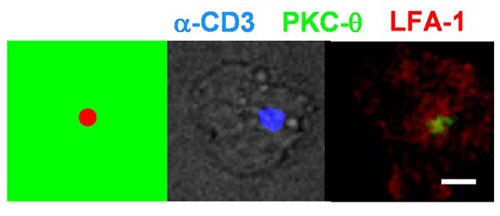
In live APC–T cell interactions, TCR triggering is followed by the clustering of receptor-ligand pairs in the T cell–APC interface, forming an immunological synapse. Depending on the activation conditions, μm-scale physical patterning of a number of cell surface and intracellular signaling molecules accompanies this process. To determine whether a similar IS structure would assemble in response to the presentation of tethered patterned ligands, we performed immunostaining on CD4+ T cell blasts fixed after 20 min of interaction with patterns of focal anti-CD3 spots surrounded by ICAM-1 (Fig. 5A and B). In synapses formed between T cells and live B cells, the cytoskeletal protein talin enriches in a peripheral ring surrounding a central accumulation of the critical signaling molecule PKC-θ (12). In a similar manner, we observed focal clustering of PKC-θ centered over sites of patterned anti-CD3, surrounded by a ring-like accumulation of talin (Fig. 5A). On the cell surface, LFA-1 and TCR have been shown to cluster in a pattern similar to the concentric arrangement of talin and PKC-θ inside the cell (12); we also observed this concentric arrangement of TCR and LFA-1 for T cells interacting with activation sites of synapse arrays (Fig. 5B). Similar structures were observed for activation sites displaying 25-fold lower densities of anti-CD3 (data not shown), and with smaller-diameter activation sites (as shown in Fig. 13, which is published as supporting information on the PNAS web site, for 2-μm focal sites).
Fig. 5.

Synapse array patterns template T cell surface receptor and intracellular signaling molecule accumulation at the cell–surface contact site. Shown in each panel are schematics of the anti-CD3/ICAM-1 substrate pattern and representative immunofluorescence images at the cell–substrate contact plane of OT-II CD4+ T cells fixed 20 min after seeding on synapse surfaces. (A and B) Immunostaining of PKC-θ (green) and talin (red) (A) or TCR and LFA-1 on focal anti-CD3 patterns (B). (C and D) Immunostaining of PKC-θ (green) and LFA-1(red) on multifocal patterns (each anti-CD3 spot 2 μm in diameter) (C) or annular anti-CD3 patterns (D). (Scale bars: 5 μm.)
Clearly, a significant difference between T cell–live APC interactions and T cell–synapse array interactions rests with the mobility of the ligands presented; ICAM-1 and peptide–MHCs diffuse laterally in the membrane of the live APC but here we have immobilized these ligands on the surface by short molecular tethers. However, a powerful feature of this approach is the potential to use the fixed distribution of ligands to template an arbitrary organization of T cell surface receptors and thus probe the importance of specific physical patterns of receptor clustering on T cell functions, independent of changes in the total amount or quality of ligands presented to the T cell. We thus examined T cell responses to two additional types of immunological synapse arrays: “multifocal” patterns of anti-CD3 patterned as four 2-μm circles placed at the corners of a square 6 μm on a side, and “annular” patterns of anti-CD3 with an outer diameter of 8 μm and inner diameter of 4 μm (Fig. 5 C and D). These activation site geometries were chosen to template T cell surface receptor clustering in patterns mimicking intermediate synapse structures observed before the formation of a mature IS (8, 13, 35). In each case, the adhesion field was composed of immobilized ICAM-1. Immunostaining of T cells 20 min after seeding onto these altered synapse arrays revealed that the accumulation of both cell surface receptors and intracellular signaling molecules was impacted by the surface ligand pattern. As shown in Fig. 5C, PKC-θ clustered over each 2-μm patch of TCR ligand on “quad” patterns, with LFA-1 accumulating around each of these patches. Such multifocal PKC-θ clustering was observed in 53% of cells (n = 30) on quad patterned surfaces. On activation sites with an annular geometry, PKC-θ clustered in coincidence with the annular activation patch in 25% of cells in full contact with the surface pattern (discussed further below). Strikingly, LFA-1 accumulated outside the anti-CD3 ring but was virtually excluded from the region of the interface inside the ring of surface anti-CD3, despite the presence of ICAM-1 in this region (Fig. 5D).
Modulation of T Cell Responses by Altering Surface Ligand Patterns.
Having observed that surface ligand patterns could modulate T cell synapse assembly, we further investigated the behavior of T cells on focal and annular anti-CD3 patterned surfaces. First, we recorded the dynamics of T cell–surface interactions by videomicroscopy 30 min after seeding cells on focal and annular arrays. All T cells interacting with focal patterns of anti-CD3 centered themselves for full contact with the anti-CD3 circle, exhibited a rounded morphology, and made minimal membrane extensions away from the contact site (Movie 4, which is published as supporting information on the PNAS web site). In contrast, the majority of T cells interacting with annular patterns made only partial contact with the anti-CD3 ring, exhibited a partially polarized morphology, and made dynamic membrane extensions away from the activation site: many cells continuously changed directions while maintaining a partial contact with the anti-CD3 ring (Movie 5, which is published as supporting information on the PNAS web site). This unusual motion of T cells could be correlated with their polarization by performing tubulin immunostaining on fixed T cells. Fig. 6A and B shows representative micrographs of T cells interacting with focal and ring anti-CD3-patterned surfaces, respectively. For both patterns, colocalization of the microtubule-organizing center (MTOC) and PKC-θ over the anti-CD3 pattern was observed in ≈90% of cells that exhibited significant clustering of PKC-θ (≈80% of cells) at the cell–substrate interface (Fig. 6 A and B). Although T cells contacting focal patterns of anti-CD3 always covered the entire area of the activation site, the majority of T cells (64%) on ring patterns made only partial contact with activation sites. The morphology of PKC-θ accumulated by T cells contacting different patterns of anti-CD3 is summarized in Fig. 6C. Most T cells that had partial contact with anti-CD3 rings showed focal clustering of PKC-θ colocalized with the MTOC at their points of contact with the activation site, as shown in Fig. 6B Left. For a fraction of cells (25%) fully contacting anti-CD3 rings, PKC-θ assembled in an annular structure, as shown in Fig. 6B Right. Altogether, annular patterns of anti-CD3 seem to perturb the stable polarization of T cells. Helper T cells polarize PKC-θ and their MTOC toward APCs presenting agonist ligand (36), and they can also rapidly change the direction of polarization when a nearby stronger stimulus is detected (37). It is possible that semimotile T cells making only partial contact with annular activation sites may be in the process of continuously repolarizing their TCRs and signaling machinery around the annulus of ligand, seeking a focus of maximal stimulus. Alternatively, the inability of T cells spread over the annular activation sites to focally cluster ligated TCRs may have frustrated the normal program of T cell activation.
Fig. 6.

T cell responses to focal vs. annular anti-CD3 activation sites. (A and B) Representative micrographs of 5C.C7 CD4+ T cells interacting with focal and annular activation sites, respectively. Overlays show DIC/activation site fluorescence (Upper Left), PKC-θ/activation site fluorescence (Upper Right), PKC-θ/tubulin (Lower Left), and tubulin/activation site fluorescence (Lower Right). (Scale bars: 5 μm.) (C) Quantification of PKC-θ clustering morphologies. (D) IL-2 and IFN-γ secreted by 5C.C7 T cells cultured on focal vs. annular activation site patterns after 48 h, normalized by cytokine concentrations secreted on focal patterns (average ± SEM from three independent experiments).
To determine whether the altered early response of T cells to annular ligand patterns affected the functional outcome of T cell activation, several measures of the T cell response to annular activation site patterns were compared with those obtained on 6-μm focal patterns. IL-2 production (Fig. 6D) and calcium signaling (average fura ratio over 20 min, data not shown) were not significantly affected by changing the physical display of anti-CD3 from focal sites to ring structures. Likewise, colocalization of phosphotyrosine with TCR, as a measure of TCR-associated signaling (22), was similar for T cells responding to focal or annular activation sites (Fig. 14, which is published as supporting information on the PNAS web site). In contrast, IFN-γ secretion by T cells cultured on annular anti-CD3 patterns was greatly reduced compared with focal anti-CD3 patterns (P < 0.02; Fig. 6D). Notably, the surface area of focal and annular activation sites (and thus the total amount of anti-CD3 encountered by the T cells) was comparable (ring patterns tested here had a 1.3-fold larger activation site area); thus, the reduction in IFN-γ production cannot be ascribed to a lower density of available ligand on the annular pattern. The exact mechanism of this effect on cytokine production remains to be determined, but these results demonstrate that, at least for the 5C.C7 transgenic CD4+ T cells tested here, encounter with a nonfocal display of TCR ligand may alter the program of T cell activation. Alternatively, annular activation sites may have selectively activated a subpopulation of the primed T cell population; for example, Th1 and Th2 cells form different synapse structures and have different requirements for activation (38). Although this alternative cannot be formally excluded, we found that, on restimulation with anti-CD3-coated plates, a significant fraction of primed 5C.C7 T cells (as used for all of our studies) produced the Th1-associated cytokine IFN-γ, but only ≈1% produced the Th2-associated cytokine IL-4 (data not shown), in agreement with earlier studies on 5C.C7 T cells (39).
In this article, we have created surfaces presenting segregated patterns of two protein ligands, which mimic the microscale organization of ligands on APCs observed during the assembly of an immunological synapse. The ability to pattern commercially available proteins into defined, segregated regions while retaining activity makes the patterning strategy described here immediately applicable to a broad range of readily available protein ligands of interest to many problems in cell biology. Using these patterned surfaces, we have shown that T cell activation events, and in particular the molecular assembly of T cell synapses, can be modulated simply by changing the microscale organization of stimuli. This model system allows T cell responses to be monitored from initial signaling events occurring within seconds to proliferation and cytokine production occurring 20–30 h after the onset of activation, at the population or single-cell levels.
Materials and Methods
Materials Used in Surface Fabrication.
A photoresist copolymer, PNMP, was synthesized, biotinylated, and characterized as described (28). This resist material is a random terpolymer with composition o-nitrobenzyl methacrylate (o-NBMA):methyl methacrylate (MMA):poly(ethylene glycol) methacrylate (PEGMA) = 36:37:27 by weight, number average molecular weight 6,500 g/mol, and polydispersity index of 1.78. Detailed information on proteins used for surface patterning and characterization is provided in Supporting Text, which is published as supporting information on the PNAS web site.
Fabrication of Immunological Synapse Arrays.
Glass coverslips (24 × 50 mm; VWR Scientific) were cleaned by 10 M NaOH (10 min with sonication) and silanized by 3-aminopropyl triethoxysilane (APTS) following a published procedure (40) to create a positively charged surface layer. Biotinylated PNMP was dissolved in 1,4-dioxane (3 wt/vol %) and spincoated on APTS-modified coverslips to obtain ≈130 nm-thick-films. Immunological synapse arrays were prepared on PNMP-coated coverslips by using a photolithography-based technique we previously reported (28) for patterning multiple monobiotinylated proteins. The arrays are based on segregated patterns of immobilized biotinylated anti-CD3 and ICAM-1/Fc fusion proteins. The patterning approach largely follows our previous report (28), except that, because we sought to use commercially available biotinylated antibodies that typically have 4–12 biotin groups per molecule (unpublished data), steps to block excess biotin groups on the biotinylated anti-CD3 molecules patterned in the first step of the immobilization procedure were required (41). Briefly, PNMP thin films on cationic glass substrates prepared as described above were first exposed to UV irradiation through a photomask for 20 min (Fig. 2Ai) and developed by rinsing with pH 7.4 PBS to define the regions that would become activation sites (Fig. 2Aii). Next, the substrate was reexposed to UV without a photomask, priming the background regions of the resist film for dissolution (Fig. 2Aiii). The removable plastic sidewalls of a commercial eight-well chambered coverslip (well area, 0.8 cm2; Lab-Tek Permanox slides; Nunc) were then attached to the partially processed patterned coverslip by using Superflex Clear RTV Silicone (Henkel Loctite, Rocky Hill, CT) and cured for 24 h at 20°C, to create culture wells with the patterned glass substrate serving as a base. Before “erasing” the background film region, SAv (10 μg/ml) and biotinylated anti-CD3 (or biotinylated isotype control antibody, 5 μg/ml) were sequentially incubated over the surface for 30 min each in PBS (pH 6.0) at 4°C, binding to the available surface-tethered biotin groups (Fig. 2Aiv). (As an estimate of the binding capacity of biotinylated PNMP films, the density of SAv coupled to PNMP surfaces measured by using 125I-labeled SAv was ≈4,000 molecules per μm2; however, this value likely overestimates the density of active anti-CD3 and ICAM-1 sites on the surfaces.) Excess free biotin groups remaining on the tethered anti-CD3 were blocked by sequential incubation with SAv (10 μg/ml, 30 min) and biotin-PEO-amine (10 μg/ml, 30 min, at 4°C; Pierce EZ-link). The exposed PNMP film masking the background (and protein bound to it) was then dissolved by immersing the protein-conjugated surface in pH 7.4 PBS (Fig. 2Av). Although the bulk of the masking PNMP film dissolved, the cationic substrate electrostatically retained a thin layer of biotinylated PNMP on the surface. By using these freshly exposed biotin groups, the adhesion field was functionalized by sequential assembly of SAv (10 μg/ml, 30 min), biotinylated anti-human Fc (10 μg/ml, 30 min), and ICAM-1/Fc (5 μg/ml, 30 min) at 4°C (Fig. 2Avi).
Preparation of Cells.
OT-II (The Jackson Laboratory) and 5C.C7 (Taconic Farms) CD4+ T cell blasts were prepared by stimulation of splenocytes from transgenic mice with 100 μg/ml ovalbumin (for OT-II) or 1 μM moth cytochrome c peptide (amino acids 88–103; for 5C.C7). Cells were maintained in complete RPMI medium (RPMI medium 1640/10% FCS/2 mM l-glutamine/50 μM 2-mercaptoethanol/penicillin/streptomycin) and used on days 5–7.
Time-Lapse Microscopy.
Time-lapse fluorescence microscopy was performed on a Zeiss Axiovert 200 epifluorescence microscope equipped with a heated stage (maintaining 37°C and 5% CO2). T cells were loaded with the intracellular Ca2+ indicator fura-2 AM (Molecular Probes) to permit simultaneous morphology and intracellular Ca2+ imaging (30). For each experiment, fura-loaded T cell blasts were seeded onto patterned synapse arrays, and time-lapse microscopy was immediately initiated (see Supporting Text).
Immunostaining.
T cells were seeded on immunological synapse surfaces and incubated for 20 min at 37°C and 5% CO2. Cells were then fixed, permeabilized, and stained as described elsewhere (42) (see Supporting Text).
ELISA.
The functional outcome of T cell interactions with patterned surfaces was assayed by measuring IL-2 and IFN-γ secretion. T cells (105) were seeded on patterned substrates in 300 μl of RPMI media and incubated at 37°C, 5% CO2 for 48 h; 100 μl of supernatant was then collected from each sample for ELISA analysis of cytokine concentrations.
Supplementary Material
Acknowledgments
This work was supported by the DuPont-MIT Alliance and the Arnold and Mabel Beckman Foundation.
Abbreviations
- APC
antigen-presenting cell
- IS
immunological synapse
- ICAM-1
intercellular adhesion molecule-1
- LFA-1
lymphocyte function-associated antigen-1
- PNMP
poly(o-nitrobenzyl methacrylate-r-methyl methacrylate-r-poly(ethylene glycol) methacrylate)
- SAv
streptavidin
- TCR
T cell receptor.
Footnotes
Conflict of interest statement: No conflicts declared.
This paper was submitted directly (Track II) to the PNAS office.
References
- 1.Folch A., Toner M. Annu. Rev. Biomed. Eng. 2000;2:227–256. doi: 10.1146/annurev.bioeng.2.1.227. [DOI] [PubMed] [Google Scholar]
- 2.Whitesides G. M., Ostuni E., Takayama S., Jiang X. Y., Ingber D. E. Annu. Rev. Biomed. Eng. 2001;3:335–373. doi: 10.1146/annurev.bioeng.3.1.335. [DOI] [PubMed] [Google Scholar]
- 3.Chen C. S., Mrksich M., Huang S., Whitesides G. M., Ingber D. E. Science. 1997;276:1425–1428. doi: 10.1126/science.276.5317.1425. [DOI] [PubMed] [Google Scholar]
- 4.Koo L. Y., Irvine D. J., Mayes A. M., Lauffenburger D. A., Griffith L. G. J. Cell Sci. 2002;115:1423–1433. doi: 10.1242/jcs.115.7.1423. [DOI] [PubMed] [Google Scholar]
- 5.Jiang X. Y., Bruzewicz D. A., Wong A. P., Piel M., Whitesides G. M. Proc. Natl. Acad. Sci. USA. 2005;102:975–978. doi: 10.1073/pnas.0408954102. [DOI] [PMC free article] [PubMed] [Google Scholar]
- 6.Wu M., Holowka D., Craighead H. G., Baird B. Proc. Natl. Acad. Sci. USA. 2004;101:13798–13803. doi: 10.1073/pnas.0403835101. [DOI] [PMC free article] [PubMed] [Google Scholar]
- 7.McBeath R., Pirone D. M., Nelson C. M., Bhadriraju K., Chen C. S. Dev. Cell. 2004;6:483–495. doi: 10.1016/s1534-5807(04)00075-9. [DOI] [PubMed] [Google Scholar]
- 8.Grakoui A., Bromley S. K., Sumen C., Davis M. M., Shaw A. S., Allen P. M., Dustin M. L. Science. 1999;285:221–227. [PubMed] [Google Scholar]
- 9.Dustin M. L., Colman D. R. Science. 2002;298:785–789. doi: 10.1126/science.1076386. [DOI] [PubMed] [Google Scholar]
- 10.Giancotti F. G., Ruoslahti E. Science. 1999;285:1028–1032. doi: 10.1126/science.285.5430.1028. [DOI] [PubMed] [Google Scholar]
- 11.Davis D. M., Chiu I., Fassett M., Cohen G. B., Mandelboim O., Strominger J. L. Proc. Natl. Acad. Sci. USA. 1999;96:15062–15067. doi: 10.1073/pnas.96.26.15062. [DOI] [PMC free article] [PubMed] [Google Scholar]
- 12.Monks C. R. F., Freiberg B. A., Kupfer H., Sciaky N., Kupfer A. Nature. 1998;395:82–86. [Google Scholar]
- 13.Lee K. H., Holdorf A. D., Dustin M. L., Chan A. C., Allen P. M., Shaw A. S. Science. 2002;295:1539–1542. doi: 10.1126/science.1067710. [DOI] [PubMed] [Google Scholar]
- 14.Purtic B., Pitcher L. A., van Oers N. S. C., Wulfing C. Proc. Natl. Acad. Sci. USA. 2005;102:2904–2909. doi: 10.1073/pnas.0406867102. [DOI] [PMC free article] [PubMed] [Google Scholar]
- 15.Purbhoo M. A., Irvine D. J., Huppa J. B., Davis M. M. Nat. Immunol. 2004;5:524–530. doi: 10.1038/ni1058. [DOI] [PubMed] [Google Scholar]
- 16.Faroudi M., Utzny C., Salio M., Cerundolo V., Guiraud M., Muller S., Valitutti S. Proc. Natl. Acad. Sci. USA. 2003;100:14145–14150. doi: 10.1073/pnas.2334336100. [DOI] [PMC free article] [PubMed] [Google Scholar]
- 17.Richie L. I., Ebert P. J. R., Wu L. C., Krummel M. F., Owen J. J. T., Davis M. M. Immunity. 2002;16:595–606. doi: 10.1016/s1074-7613(02)00299-6. [DOI] [PubMed] [Google Scholar]
- 18.Hallman E., Burack W. R., Shaw A. S., Dustin M. L., Allen P. M. Immunity. 2002;16:839–848. doi: 10.1016/s1074-7613(02)00326-6. [DOI] [PubMed] [Google Scholar]
- 19.Brossard C., Feuillet V., Schmitt A., Randriamampita C., Romao M., Raposo G., Trautmann A. Eur. J. Immunol. 2005;35:1741–1753. doi: 10.1002/eji.200425857. [DOI] [PubMed] [Google Scholar]
- 20.Friedl P., den Boer A. T., Gunzer M. Nat. Rev. Immunol. 2005;5:532–545. doi: 10.1038/nri1647. [DOI] [PubMed] [Google Scholar]
- 21.Trautmann A., Valitutti S. Curr. Opin. Immunol. 2003;15:249–254. doi: 10.1016/s0952-7915(03)00040-2. [DOI] [PubMed] [Google Scholar]
- 22.Mossman K. D., Campi G., Groves J. T., Dustin M. L. Science. 2005;310:1191–1193. doi: 10.1126/science.1119238. [DOI] [PubMed] [Google Scholar]
- 23.Miller M. J., Wei S. H., Parker I., Cahalan M. D. Science. 2002;296:1869–1873. doi: 10.1126/science.1070051. [DOI] [PubMed] [Google Scholar]
- 24.Mempel T. R., Henrickson S. E., von Andrian U. H. Nature. 2004;427:154–159. doi: 10.1038/nature02238. [DOI] [PubMed] [Google Scholar]
- 25.Leo O., Foo M., Sachs D. H., Samelson L. E., Bluestone J. A. Proc. Natl. Acad. Sci. USA. 1987;84:1374–1378. doi: 10.1073/pnas.84.5.1374. [DOI] [PMC free article] [PubMed] [Google Scholar]
- 26.Bruniquel D., Schwartz R. H. Nat. Immunol. 2003;4:235–240. doi: 10.1038/ni887. [DOI] [PubMed] [Google Scholar]
- 27.Lee K. M., Chuang E., Griffin M., Khattri R., Hong D. K., Zhang W. G., Straus D., Samelson L. E., Thompson C. B., Bluestone J. A. Science. 1998;282:2263–2266. doi: 10.1126/science.282.5397.2263. [DOI] [PubMed] [Google Scholar]
- 28.Doh J., Irvine D. J. J. Am. Chem. Soc. 2004;126:9170–9171. doi: 10.1021/ja048261m. [DOI] [PubMed] [Google Scholar]
- 29.Dustin M. L., Bromley S. K., Kan Z. Y., Peterson D. A., Unanue E. R. Proc. Natl. Acad. Sci. USA. 1997;94:3909–3913. doi: 10.1073/pnas.94.8.3909. [DOI] [PMC free article] [PubMed] [Google Scholar]
- 30.Wulfing C., Sjaastad M. D., Davis M. M. Proc. Natl. Acad. Sci. USA. 1998;95:6302–6307. doi: 10.1073/pnas.95.11.6302. [DOI] [PMC free article] [PubMed] [Google Scholar]
- 31.Lewis R. S., Cahalan M. D. Annu. Rev. Immunol. 1995;13:623–653. doi: 10.1146/annurev.iy.13.040195.003203. [DOI] [PubMed] [Google Scholar]
- 32.Donnadieu E., Bismuth C., Trautmann A. Curr. Biol. 1994;4:584–595. doi: 10.1016/s0960-9822(00)00130-5. [DOI] [PubMed] [Google Scholar]
- 33.Vanseventer G. A., Newman W., Shimizu Y., Nutman T. B., Tanaka Y., Horgan K. J., Gopal T. V., Ennis E., Osullivan D., Grey H., Shaw S. J. Exp. Med. 1991;174:901–913. doi: 10.1084/jem.174.4.901. [DOI] [PMC free article] [PubMed] [Google Scholar]
- 34.Kuhlman P., Moy V. T., Lollo B. A., Brian A. A. J. Immunol. 1991;146:1773–1782. [PubMed] [Google Scholar]
- 35.Krummel M. F., Sjaastad M. D., Wulfing C., Davis M. M. Science. 2000;289:1349–1352. doi: 10.1126/science.289.5483.1349. [DOI] [PubMed] [Google Scholar]
- 36.Monks C. R. F., Kupfer H., Tamir I., Barlow A., Kupfer A. Nature. 1997;385:83–86. doi: 10.1038/385083a0. [DOI] [PubMed] [Google Scholar]
- 37.Depoil D., Zaru R., Guiraud M., Chauveau A., Harriague J., Bismuth G., Utzny C., Muller S., Valitutti S. Immunity. 2005;22:185–194. doi: 10.1016/j.immuni.2004.12.010. [DOI] [PubMed] [Google Scholar]
- 38.Balamuth F., Leitenberg D., Unternaehrer J., Mellman I., Bottomly K. Immunity. 2001;15:729–738. doi: 10.1016/s1074-7613(01)00223-0. [DOI] [PubMed] [Google Scholar]
- 39.Seder R. A., Paul W. E., Davis M. M., Destgroth B. F. J. Exp. Med. 1992;176:1091–1098. doi: 10.1084/jem.176.4.1091. [DOI] [PMC free article] [PubMed] [Google Scholar]
- 40.Jonas U., del Campo A., Kruger C., Glasser G., Boos D. Proc. Natl. Acad. Sci. USA. 2002;99:5034–5039. doi: 10.1073/pnas.082634799. [DOI] [PMC free article] [PubMed] [Google Scholar]
- 41.Sandberg S. A., Barrett R. W., Pirrung M., Lu A. L., Kiangsoontra B., Holmes C. P. J. Am. Chem. Soc. 1995;117:12050–12057. [Google Scholar]
- 42.O’Keefe J. P., Blaine K., Alegre M. L., Gajewski T. F. Proc. Natl. Acad. Sci. USA. 2004;101:9351–9356. doi: 10.1073/pnas.0305965101. [DOI] [PMC free article] [PubMed] [Google Scholar]
Associated Data
This section collects any data citations, data availability statements, or supplementary materials included in this article.