Abstract
In this article, optimization-based frameworks are introduced for elucidating the input-output structure of signaling networks and for pinpointing targeted disruptions leading to the silencing of undesirable outputs in therapeutic interventions. The frameworks are demonstrated on a large-scale reconstruction of a signaling network composed of nine signaling pathways implicated in prostate cancer. The Min-Input framework is used to exhaustively identify all input-output connections implied by the signaling network structure. Results reveal that there exist two distinct types of outputs in the signaling network that either can be elicited by many different input combinations or are highly specific requiring dedicated inputs. The Min-Interference framework is next used to precisely pinpoint key disruptions that negate undesirable outputs while leaving unaffected necessary ones. In addition to identifying disruptions of terminal steps, we also identify complex disruption combinations in upstream pathways that indirectly negate the targeted output by propagating their action through the signaling cascades. By comparing the obtained disruption targets with lists of drug molecules we find that many of these targets can be acted upon by existing drug compounds, whereas the remaining ones point at so-far unexplored targets. Overall the proposed computational frameworks can help elucidate input/output relationships of signaling networks and help to guide the systematic design of interference strategies.
INTRODUCTION
Recent years have witnessed an increasing interest in the study of cell signaling cascades as the critical role of these networks in various cellular events is becoming better understood. A typical signaling pathway involves the capture of extracellular signals and the subsequent transduction inward to control target proteins or gene expression (1). For example, in response to stimulation by specific ligands, the receptor tyrosine kinases regulate a great diversity of cellular processes including cell migration, cell proliferation, and differentiation (2). Similarly, the vascular endothelial growth factor (VEGF) family of ligands and receptors has been implicated in vascular development and neovascularization (3). The connectivity of signaling networks is being unraveled at an ever increasing pace (4–6). This brings to the forefront the challenge of devising novel strategies for systematically deducing the stimuli capable of eliciting a particular cellular response and deciphering how to “shape” their connectivity to negate undesirable outputs (e.g., P70S6K, a suppressor of apoptosis) without affecting necessary ones (e.g., glycogen synthesis) (7,8). This article introduces an integrated computational base for addressing these questions for large-scale signaling network reconstructions using a stoichiometric description of molecular transformations and a Boolean description of activations and inhibitions. The lack of any kinetic information in the adopted modeling descriptions implies that no dynamic effects in signal propagation are captured (e.g., signal timing). Additional complications may include cell-type dependent inhibition or activation, compartmentalization and the impact of spatial organization in general. Therefore, only connectivity-encoded insight can be elucidated, implying that further detailed kinetic-based analysis may be needed to fully recapitulate the underlying input-output structures and/or interventions.
Genomic advances have provided a major impetus to the large-scale reconstruction of signaling pathways. Numerous databases are under development to catalog the astounding complexity associated with cell signaling networks. For example, the Reaction entries in the TRANSPATH database (9,10) allow the query of the upstream and downstream connectivity of signaling molecules by providing directionality and stoichiometry information for each interaction. The integration of TRANSPATH with TRANSFAC (11), a database for transcription factors and their DNA binding sites, provides the means to obtain complete signaling pathways from the binding of a ligand to the set of affected genes. The Alliance for Cellular Signaling (12), has brought forward the Molecule Pages database (13), which contains extensive information about more than 3,700 signaling proteins present in cellular signaling. Each entry, contributed by invited experts and peer-reviewed, contains information on a protein's known states including a list of sequence, kinetic, and thermodynamic parameters when available. Both the Alliance for Cellular Signaling and TRANSPATH programs have the ultimate goal of providing the kinetic parameters necessary for the quantitative simulation of large signaling networks to aid in drug target discovery and evaluation. The Biomolecular Interaction Network Database (14,15) and the Database of Interacting Proteins (16) store protein-protein interaction data representing ∼15,000 and 11,000 interactions, respectively. Finally, the PANTHER (17) database is a repository for cell signaling pathways and includes interactive resources for associating protein families with their biological pathways, as well as new tools for analyzing gene expression data in relation to molecular functions, biological processes, and pathways.
Signaling cascades were originally thought to function via linear routes where a single extracellular signal (i.e., input) would trigger a linear chain of reactions resulting in a single well-defined response (i.e., output) (18). However nowadays, it is unanimously accepted that biological responses to external stimuli are much more complicated and the result of multiple interacting pathways containing many common molecules (19–22). Many researchers have attempted to model and simulate the signaling cascades. These include modeling studies conducted on localized aspects of the cell signaling process such as the kinetic and spatial analysis of cell surface receptor mechanisms (23,24), analyses of the cascades (25,26), analyses of specific signaling system modules (27–30), and analyses of timing- dependent receptor specificities (31). Specifically, the Database of Quantitative Cellular Signaling provides a repository of modules (i.e., <100 reactions) of signaling pathways containing ∼1/3 of all published kinetic models of signaling pathways (4). To date, the most detailed modular-type kinetic analysis involves the construction of a dynamic model of the MAP kinase cascade activated by epidermal growth factor (EGF) receptors (32). This model describes the temporal concentration profiles of 94 compounds participating in 62 biochemical transformations triggered by EGF stimulation. Though impressive, a total of 94 compounds is still only a small fraction of the 2,503 unique chemical species that have so far been identified in humans and cataloged in the TRANSPATH database (9).
Faced with the paucity of accurate and comprehensive kinetic data, the key question is whether only the topology and connectivity alone of signaling networks can provide information to qualitatively predict some of their allowable states and responses to stimuli. Interestingly, a number of studies have shown that signaling networks are quite robust with respect to variations in kinetic parameters, implying that their key properties may be largely established by their network architecture. For example, it has recently been deduced that the core topology of the interactions of the Drosophila segment polarity genes in differentiation was sufficient to deduce the properties expected of a developmental module, irrespective of the exact values of the kinetic parameters or initial conditions (33–35). Furthermore, a Boolean model of the segment polarity genes based solely on binary (0–1) representation of transcript and protein levels was able to reproduce wild-type gene expression experiments along with expression patterns in various mutants and overexpression experiments (36). In their study of the EGF signaling system, Schoeberl et al. (32) concluded that the EGF-induced responses were remarkably stable over a 100-fold range of ligand concentrations and were unexpectedly robust to variations in kinetic parameters and initial conditions. In Escherichia coli chemotaxis, the precision of tumbling frequency adaptation to external stimulant concentrations was found to be quite robust despite substantial variations in network-protein concentrations. (37,38). The local responses at each level of a signaling cascade have been shown to amplify, enabling the total response of the cascade to operate almost as a switch where the target is activated in response to a given signal (39). Lastly, it has been found that engineering the topology of signaling networks alone was able to change response specificity in Saccharomyces cerevisiae resulting in cells eliciting an osmolarity response to a mating signal (40,41).
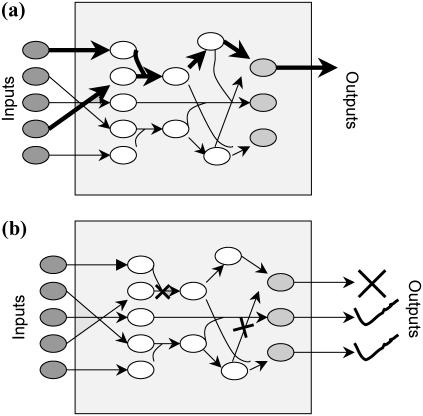
Therefore, the newly available large-scale signaling network reconstructions motivate the need to explore computationally their signal transfer properties and possible redesigns. Specifically, the question of how many signaling inputs are required to elicit a particular cellular response has already drawn attention (5). The examination of alternative sets of input signaling molecules that are capable of triggering the same response provides insight into the degeneracy built into signaling networks and their organizational principles. In another context, degeneracy has been shown to play an important role in the robust behavior exhibited by the cellular, metabolic, and regulatory networks (42). To address this need, we put forward an optimization based framework, (Min-Input problem) that exhaustively identifies all sets of input signaling molecules that are required to elicit a particular cellular outcome (see Fig. 1 a) in the context of large-scale signaling networks.
FIGURE 1.
Pictorial representation of the problems and solution strategies proposed in this article. The Min-Input framework (a) identifies the minimal sets of input signaling molecules that are capable of eliciting a particular cellular outcome. The Min-Interference framework (b) identifies the minimal combinations of disruptions to prevent an undesirable outcome while preserving a set of the desired outputs.
Dysfunctions in the signaling architecture have often been implicated in a wide range of diseases. For example, deregulation of Ets transcription factors results in formation of malignant cells leading to tumorous growth (43). Similarly, dysfunctions in the activity of the receptor tyrosine kinases and corresponding signaling pathways have been linked to diabetes and cancer (2). Several drug development studies focus on identifying therapeutic agents that are capable of disrupting a targeted set of chemical transformations within the signaling pathways through competitive binding. Unfortunately, due to the complexity of the networks, the unintended consequences of these disruptions to desired outputs are not systematically explored. However, by considering systemwide reconstructions of signaling pathways, the far reaching effects of these disruptions could be traced over the entire signaling cascades. To this end, we introduce the optimization-based framework (i.e., Min-Interference problem) that pinpoints the minimal combinations of chemical transformations that need to be disrupted to prevent an undesirable cellular response while preserving desired ones (see Fig. 1 b).
The proposed computational base is demonstrated on nine human signaling pathways that have been implicated in the growth and development of prostate cancer (Table 1). This network, extracted from the PANTHER (17) database of signaling networks, involves 322 chemical transformations and 526 distinct chemical entities. A description of the procedure used to download and process all pathway data is provided in the next section. Subsequently, the adopted mathematical description of the signaling network is highlighted followed by a detailed presentation of the computational frameworks for the Min-Input and Min-Interference problems including results and some comparisons to data from open literature.
TABLE 1.
Signaling pathways investigated in this study
| Pathways involved in prostate cancer cells |
|---|
| 1. Angiogenesis |
| 2. Apoptosis_signaling_pathway |
| 3. Cell_cycle |
| 4. EGF_receptor_signaling_pathway |
| 5. Hypoxia_response_via_HIF_activation |
| 6. Insulin_IGF_pathway_MAP_kinase_cascade |
| 7. JAK_STAT_signaling_pathway |
| 8. P53 pathway |
| 9. PI3_kinase pathway |
The pathways were obtained from the PANTHER database.
MATHEMATICAL MODELING
Pathway data
Table 1 lists all nine pathways considered in this study to highlight the proposed computational frameworks. We used implication to prostate cancer as a selection criterion. Prostate cancer is the second highest cause of cancer related deaths in the United States and many research efforts are directed toward elucidating the pathways whose upregulation or downregulation promotes malignant behavior (44).
Many of the chemical transformations in the signaling pathways are either activated or repressed by chemical entities present in the system. For example, protein tyrosine hydroxylase activates the transformation of tyrosine to 3,4-dihydroxyphenylalanine in the adrenaline synthesis pathway. Similarly, the presence of Akt suppresses the recruitment of capsase 9 in the angiogenesis pathway, which plays an important role in blood vessel formation. Therefore, in addition to stoichiometry, representation of the network topology requires identification of the activation and inhibition agents and interactions. As explained before, the pathways investigated in this work were downloaded from the PANTHER database of signaling networks in SBML format (45). PANTHER is publicly available without restriction at http://panther.appliedbiosystems.com. We developed customized scripts using Perl (46) to mine the chemical transformations, chemical entities, and activating and inhibiting interactions and convert them into a format readable by the GAMS (47) optimization environment. The final data set consists of 322 chemical transformations, 526 chemical entities, 198 activation interactions, and 38 inhibition interactions and it is available as supplementary material.
Basic definitions
Signaling pathways are represented using a stoichiometric formalism that has been extensively used to model metabolic networks (48). The key features of this formalism include explicit accounting of every chemical transformation such as binding, dimerization, and phosphorylation, and balancing around every chemical entity. The component balances governing a signal transduction network involving N = {1, … , n} chemical transformations and M = {1, … , m} chemical entities are as follows:
 |
(1) |
Here Ci denotes the concentration of chemical entity i, Sij is the stoichiometric coefficient of chemical entity i in chemical transformation j, and rj is the corresponding flux of transformation j. The rate-limiting steps in cell signaling processes are typically either receptor internalization or transcriptional regulation, both with time constants on the order of 102 s. The time constants for the signaling transformations are on the order of 1–10 s allowing a steady-state assumption to be invoked:
 |
(2) |
Our reaction set considers the transcription factors as the endpoints and do not take into account the subsequent transcriptional regulation of targeted genes
Modeling activating interactions
Activators are chemical entities that act as catalysts and enable specific chemical transformations. In such situations, the corresponding chemical transformation can take place only if the requisite activator is present subject to the availability of the reactants. The following simple example explains how we model activation using only a stoichiometric description of chemical transformations.
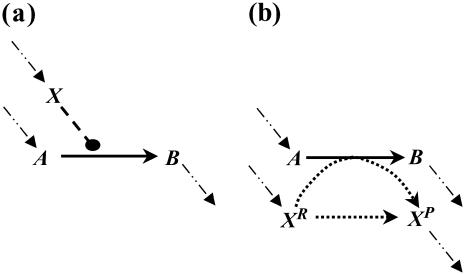
Consider the chemical transformation A→B, which is activated by a chemical entity X (Fig. 2 a). Even though the presence of X is necessary to carry out the transformation, there is no net change in the amount of X and thus an unambiguous stoichiometric coefficient value cannot be assigned to it. To overcome this dilemma, we duplicate the X chemical entity into XR and XP depending on whether X is a “reactant” or “product” species with respect to the reaction at hand (i.e., A→B). Accordingly, activation by X is modeled using the following simple reaction steps (see Fig. 2 b):
 |
 |
 |
 |
FIGURE 2.
Modeling activating interactions. Shown in a is the chemical transformation A→B, which is activated by the chemical entity X. Activation interaction is indicated by an arrow with a dot at its tail. Shown in b is the pathway resulting after accounting for activation. The activator X is duplicated as XR and XP. The new transformations introduced are represented by dotted arrows. In both panels, the dashed arrows account for the production and transfer of chemical entities.
The first reaction step ensures that all X present as input or generated through chemical transformations is denoted as XR. This defines a pool XR of “reactant” X, which, only if available, could be used in the second step to carry out the A→B transformation, which also converts XR to XP. The third step allows for X to directly flow from its “reactant” XR to its “product” XP form without having to necessarily participate in reaction A→B. Finally, the last step enables X to be consumed or become an output to prevent accumulation. This representation of activation enables a nonzero flux through the reaction A→B if and only if activator X is available in the system. All the transformations modeling activating interactions are irreversible. It is important to note that based on the above definitions, the extent of the A→B reaction is constrained by the amount of XR. However, this is not a problem because we are examining network properties of signaling pathways that are dependent upon the presence or absence of flow rather than exact values.
This formalism for modeling activation within a stoichiometric framework can be generalized for any chemical transformation. Based on the above definitions and by duplicating all activators into corresponding “reactant” and “product” pools, any reaction requiring activation by a single or multiple species can be expressed as the combination of the elementary steps described above.
Modeling inhibiting interactions
Inhibition interactions are ubiquitous in signaling pathways. Despite the conceptual similarity of inhibitions to activations, we did not find an equivalent way to express them in a purely stoichiometric fashion. Therefore, we had to make use of binary variables  (i.e., acting as on/off switches) to model inhibited chemical transformations depending on the presence or absence of the inhibitor. The binary variable
  is defined as follows:
 |
The above condition for setting the values of  along with the constraint
  ensure that the flux rj is set to zero if
  = 0 and it can assume any value between 0 and U if
  = 1. The magnitude of parameter
  was fixed at 103 for all the computational studies conducted in this work. We also define the set
  as the set of inhibitors for transformation j.
The presence or absence of an inhibiting chemical species  is determined by examining if at least one chemical transformation leads to production of inhibitor i or i is supplied as an input. The amount of i produced by or supplied as input to the system is given by the term
  , where
  is the set of chemical transformations (including input reactions) leading to the production of i.
If  then inhibitor i is present and the flux through transformation j is set to zero. This condition is described mathematically as the following set of constraints:
 |
Parameter L is chosen so that the term  is always <1. Given the scale of flows in the network, a value of L = 106 was sufficient for all computational studies presented in this study. Therefore, through the application of duplicated chemical species and binary variables, both activating and inhibiting interactions are properly described.
Identifying and eliminating loops
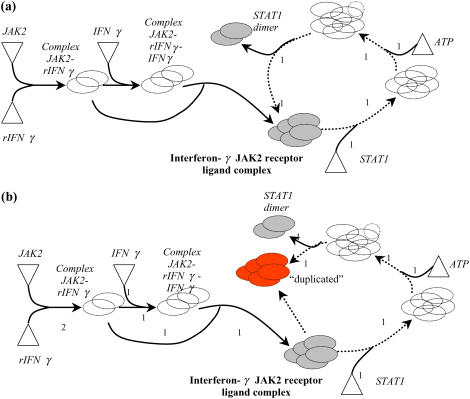
Signaling networks are often characterized by the existence of cycles (i.e., loops) in the flow of information. Specifically, a chemical entity i participates in a loop if there exists a finite number of chemical transformations that starting from i can lead back to the formation of the chemical entity i. Cyclic motifs or loops lead to the formation of disjoint subnetworks that can have nonzero flows, at steady state, even in the absence of required input signaling molecules. A practical manifestation of this is the incomplete identification of all inputs needed for an output. To illustrate this point, consider the pathway posed by Papin and Palsson (5) for the generation of the STAT1 homodimer output from the input signaling molecules, rIFNγ, JAK2, IFNγ, STAT1, and ATP (Fig. 3 a). Also shown in Fig. 3 a is one possible flux distribution that recruits input signaling molecules ATP and STAT1 alone to produce STAT1 homodimer. Hence, the presence of the loop at interferon-γ JAK2 receptor ligand complex allows the assignment of nonzero flows toward the production of STAT1 homodimer in the presence of ATP and STAT1 even if the required inputs rIFNγ, JAK2, and IFNγ are absent. To overcome this problem, we have developed a loop-breaking procedure that first identifies all linearly independent loops and subsequently breaks them by duplicating chemical species forming the junction points of the identified loops. Briefly, the procedure involves an iterative algorithm that selects each chemical entity and subsequently traces the path from the selected chemical entity to the input entities. If the same chemical entity is encountered again in the traced path, then a loop exists at the specific chemical entity. The chemical entity is subsequently duplicated to eliminate the loop and the algorithm is applied to the new network to find additional loops. This procedure is repeated until no loops are identified. For example, by applying the loop-breaking procedure to the example shown in Fig. 3 a, a topologically equivalent loop-free network is obtained (see Fig. 3 b). It can be seen from Fig. 3 b that the network flow balance condition (Eq. 2) now ensures the recruitment of all the five inputs toward the production of STAT1 homodimer.
FIGURE 3.
Application of loop-breaking procedure: a shows the pathway for generating the STAT1 homodimer before application of loop-breaking procedure. The pathway is characterized by the existence of loop at interferon-γ-JAK2 receptor ligand complex. The loop is represented by dotted arrows in a. b shows that the topologically equivalent loop-free pathway is obtained by duplicating the complex (represented in red). The input molecules are shown with triangles.
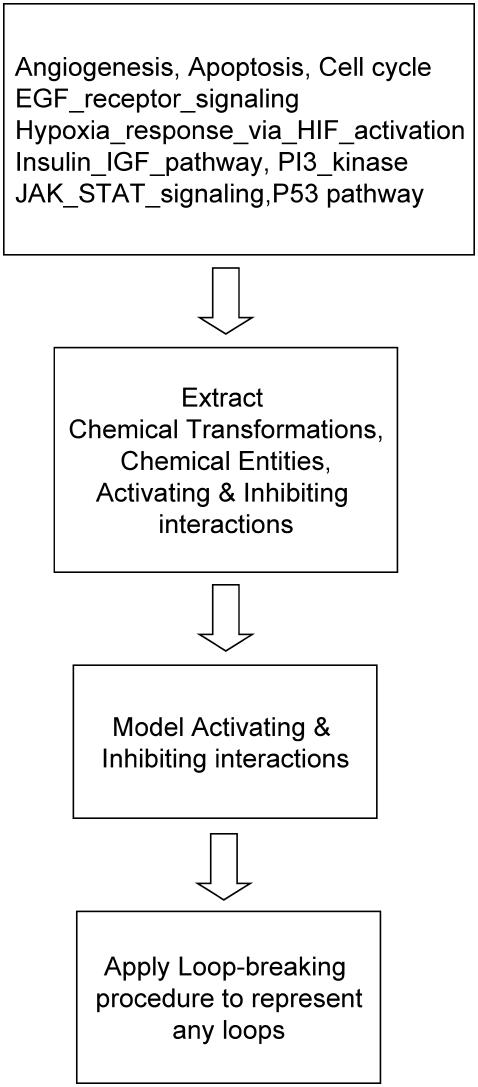
A composite block diagram indicating the important steps in the network modeling is shown in Fig. 4. The statistics of the resulting network are summarized in Table 2. As shown in the table, the curated network involves 1,338 chemical transformations, of which 249 are inputs and 75 are the outputs, and consists of 1,063 chemical entities. This network is used as the basis for all subsequent computational studies.
FIGURE 4.
Composite block diagram illustrating the important steps in the network modeling procedure. First, the pathway data from PANTHER database is downloaded and subsequently curated to convert the data into a spreadsheet readable format. Next, we identify chemical transformations, chemical entities, activating, and inhibiting interactions using customized PERL (46) scripts. Next, the identified activating and inhibiting interactions are modeled as described, and finally the loop-breaking procedure is employed to represent any loops embedded in the network.
TABLE 2.
Number of chemical transformations, chemical entities, input transformations and output transformations
| Statistics of the network model | |
|---|---|
| Chemical transformations | 1014 |
| Chemical species | 1063 |
| Input transformations | 249 |
| Output transformations | 75 |
COMPUTATIONAL STUDIES
Min-Input problem
The identification of all combinations of input signals that could lead to a desired cellular response represents a significant challenge for large and highly interconnected signaling networks. The proposed approach exhaustively identifies the smallest nondecomposable sets of inputs that could elicit a particular cellular response (see Fig. 1 a) using an optimization-based framework. The mathematical description of the optimization problem requires the definition of a number of sets that identify chemical entities that serve only as inputs Min or outputs Mout, respectively, in the signaling pathways. Specifically, the stoichiometric coefficients Sij for all inputs must be nonpositive for every chemical transformation j. Similarly, the stoichiometric coefficients Sij are nonnegative for all outputs in all chemical transformations j.
Transport reactions provide input and output species with a way to enter and leave, respectively, the signaling pathways ensuring balanceability under the quasi steady-state assumption. Transport reactions form sets Nin and Nout, respectively:
 |
 |
Based on the above variable and set definitions, the problem of identifying all minimal inputs capable of eliciting a desired output  , where
  , is posed as the following mixed-integer linear programming (MILP) problem:
 |
(3) |
subject to
 |
(4) |
 |
(5) |
 |
(6) |
 |
(7) |
 |
(8) |
The objective function minimizes the number of inputs required to allow a particular response (output  ). Constraint 4 imposes the quasi steady-state condition. Constraint 5 ensures that the flux to the output transformation corresponding to the desired output (i.e.,
  ) is nonzero. Constraint set 6 accounts for the inhibition interactions. Finally, constraint 7 ensures that the reaction flux rj is set to zero if Yj is equal to zero. Alternatively, if Yj is equal to 1, then rj can assume any value between zero and U as described previously. The above formulation is solved sequentially for every chemical entity that has been characterized to be an output of the signaling network (i.e., for every
  ) to extract the minimal sets of inputs for every output of the signaling network. Often times several nondecomposable sets of inputs exist that could elicit a particular cellular response. Exhaustively identifying all sets of inputs requires utilizing the above formulation in an iterative procedure while successively implementing constraints known as integer cuts. Specifically, we impose the constraint 9:
 |
(9) |
where  corresponds to the values of binary variables obtained at a particular iteration. The constraints at each successive iteration are accumulated to exclude previously found solutions. If the problem becomes infeasible, then no other sets of inputs that can elicit the formation of the desired outcome remain and the procedure terminates.
Convex analysis-based methods such as extreme pathway (49) and elementary mode (50,51) analysis represent other alternatives for obtaining an exhaustive identification of all input/output structures. These approaches require the computation of all convex basis vectors that can represent every possible combination of reactions rates that are feasible to the network. However, convex analysis-based methods have been found to have poor scalability when applied to large networks (52). In contrast, the proposed formulation is based on linear programming and MILP principles and is scalable to thousands of chemical transformations. Similar linear programming and MILP based procedures have been successfully demonstrated on genome-scale metabolic networks in various microorganisms containing thousands of metabolic reactions (53–56).
In addition to solution tractability to large networks, the proposed formulation can be readily modified to address a number of biologically relevant questions. For example, the minimal sets of inputs that are required for attaining not just a single but multiple outputs can be identified by simply setting the flows through all the desired outputs >1. Similarly, the formulation can be modified to conduct an input/output feasibility analysis as in Pappin and Palsson (5). A feasible input/output relationship implies that given a set of signaling inputs, there exists a set of chemical transformations that lead to the production of the desired output. This is accomplished by replacing the objective function with  and replacing constraint 5 with
  , where
  represents the flux on the desired output transformation and the set
  is the set of available inputs.
Computational results
The breadth of questions that can be answered by solving the Min-Input problem and the biological insights obtained are highlighted by applying the procedure to the large-scale network model constructed from the pathways characterizing the growth and development of prostate cancer. Specifically, we address the following three key challenges in the context of the signaling network described in the Table 2:
Identify the minimal number of inputs required to elicit a particular outcome.
Identify the degeneracy of a particular output by exhaustively enumerating all possible sets of input signaling molecules that lead to a particular outcome.
Analyze the interconnection between the inferred input/output structures.
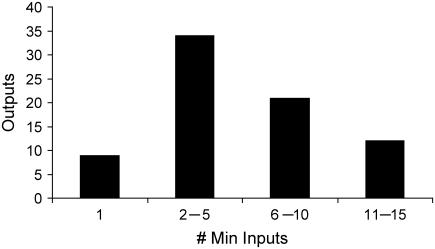
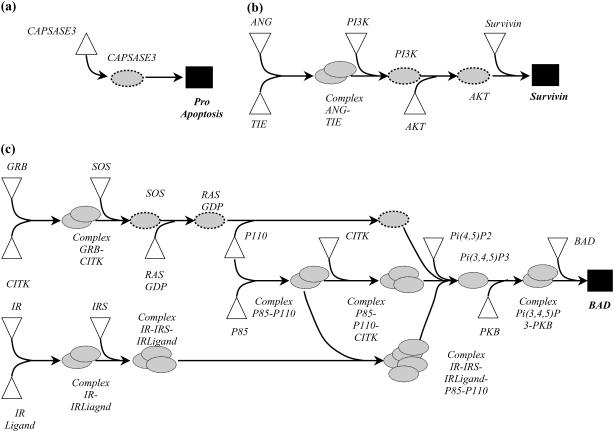
By iteratively solving the Min Input problem once for each output, we generated the distribution of the minimum number of inputs required to realize a particular output (see Fig. 5). As shown in Fig. 5, the minimum number of required inputs to elicit an output ranges from as low as 1 input to as high as 15. This is a manifestation of the highly varied topologies of the identified input/output structures. We observe single linear paths to highly interconnected cascades (see Fig. 6) depending on the output. Specifically, in the case of apoptosis, a single intracellular input of capsase 3 protein needs to be provided (see Fig. 6 a). Alternatively, as shown in Fig. 6 b, the input/output structure characterizing the formation of protein survivin resembles a simple linear cascade. Finally, we find that input/output structure of phosphorylation of BAD is much more complex and is formed by multiple interacting linear cascades (see Fig. 6 c).
FIGURE 5.
Graph depicts the distribution of minimal number of inputs required to realize a particular output. The broadness of the distribution suggests that the input/output structures span a wide spectrum in terms of their complexity.
FIGURE 6.
Complexity of input/output structure varies from single linear paths to highly interconnected linear cascades. In a, the input/output structure for capsase 3 resembles a simple linear path requiring just one input. In b, the input/output structure for survivin represents a linear cascade requiring a minimum of five inputs. In c, the input/output structure for BAD is much more complex and has many interacting linear cascades.
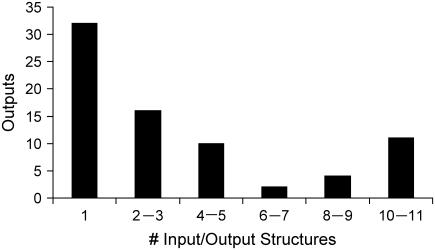
Next, the degeneracy of the outputs is examined by exhaustively identifying all sets of input molecules capable of triggering the response of a particular outcome. The distribution of the number of alternative sets of input molecules capable of eliciting a given response is shown in Fig. 7. Interestingly, the distribution of output degeneracy is a convex function with a minimum in the middle and two maxima at the two extremes. This suggests that the examined signaling pathways are characterized by the existence of two distinct sets of outcomes (i.e., outputs) that are either highly degenerate or highly specific. Table 3 summarizes the number of input/output structures identified for each output present in our signaling pathways. For example, we find that nine alternative sets of input signaling molecules are capable of triggering the apoptotic machinery, whereas there is only a single way of triggering the deregulation of the apoptotic machinery by enabling the activation of NF-κB. The presence of alternative strategies to realize an outcome can be rationalized as an evolutionary adaptation to protect against failure, thus improving response robustness (42). Therefore, a high degree of degeneracy for a particular outcome may allude to the importance of the role played by that component in the cell.
FIGURE 7.
Graph shows the number alternative input/output structures realized for each output. The distribution is a convex function with a minimum in the middle and maxima at two extremes, implying the existence of two distinct set of outcomes (highly degenerate or highly specific outputs).
TABLE 3.
Number of alternative input/output structures identified for each output
| Number of alternative input/output structures identified for each output | |||
|---|---|---|---|
| Mitogenesis_br_Differentiation_Cytosol | 1 | ComplexAxinAPCGSK3_beta__PlasmaMembrane | 2 |
| endoG_Intracellular | 1 | PLD_PlasmaMembrane | 2 |
| Anti-apoptosis_Nucleus | 1 | PLA_sub_2_endsub_PlasmaMembrane | 2 |
| ComplexI_kappa_BNF_kappa_B_Intracellular | 1 | Src_PlasmaMembrane | 2 |
| a127_degraded_Intracellular | 1 | PTEN_ | 2 |
| ComplexBcl-2Bik_Intracellular | 1 | ARF_ | 2 |
| CSL_Nuclearmembrane | 1 | Genetranscription_nucleus | 2 |
| Dsh_PlasmaMembrane | 1 | Bid_Mitochondria | 3 |
| TCF_Nuclearmembrane | 1 | ELF2_alpha__Intracellular | 3 |
| Grb14_PlasmaMembrane | 1 | Rac_PlasmaMembrane | 3 |
| Pak_PlasmaMembrane | 1 | IP3_ER | 3 |
| Grb2_PlasmaMembrane | 1 | ADP_Cytosol | 3 |
| RasGAP_PlasmaMembrane | 1 | Pro-apoptotic_Intracellular | 4 |
| Tumorsuppression_ | 1 | Ets_Nuclearmembrane | 4 |
| Survival_ | 1 | Survivin_PlasmaMembrane | 4 |
| ADP_cytosol | 1 | ComplexeNOSCa_super_2+_endsuper_PlasmaMembrane | 4 |
| VHL_cytosol | 1 | ComplexcPLA_sub_2_endsubCa_super_2+_endsuper_PlasmaMembrane | 4 |
| a64_degraded_cytosol | 1 | VRAP_PlasmaMembrane | 4 |
| MetabolismGenes_br_IncreasedGlycolysis_Nucleus | 1 | Sck_PlasmaMembrane | 4 |
| Increased_br_Angiogenesis_Nucleus | 1 | HSP27_PlasmaMembrane | 4 |
| Pro-apoptotic_br_genes_Nucleus | 1 | Complexc-Junc-Fos_Nuclearmembrane | 5 |
| ADP_Cytoplasm | 1 | Paxillin_PlasmaMembrane | 5 |
| Pi_Cytoplasm | 1 | Survival_br_Apoptosis_br_cell_space_migration_Cytosol | 6 |
| ADP_ | 1 | Gene_space_transcription_Cytosol | 6 |
| 2ADP_Cytoplasm | 1 | PI3,4P2_cytoplasm | 8 |
| Pi_nucleus | 1 | GDP_cytoplasm | 8 |
| ComplexGPCRligandGPCRG_sub__alpha__cytoplasm | 1 | S6K_cytoplasm | 8 |
| Pre-replication_br_Complex_SPhase | 1 | Pro-apoptotic_Nucleus | 9 |
| Rb_LateG_sub_1_endsub_ | 1 | ADP_cytoplasm | 10 |
| ADP_Mitosis | 1 | Pi_cytoplasm | 10 |
| a102_degraded_Mitosis | 1 | GSK3_cytoplasm | 10 |
| a_300_ | 1 | Caspase-9_cytoplasm | 10 |
| a87_degraded_Cytosol | 2 | BAD_cytoplasm | 10 |
| Transcription_br_cellcycleprogression_Cytosol | 2 | NOS_cytoplasm | 10 |
| STAT3_Nuclearmembrane | 2 | ComplexFOXO14-3-3_cytoplasm | 10 |
| STAT1_Nuclearmembrane | 2 | Cyclind_nucleus | 10 |
| GADD45_nucleus | 10 | ||
| scl-1_nucleus | 10 | ||
| IGFBP1_nucleus | 10 | ||
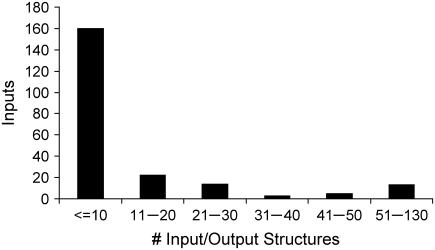
In the previous paragraph, we examined output degeneracy. Next, we quantify input degeneracy by identifying whether there exist any input signaling molecules that are highly recruited. The distribution of the number of input/output structures that require the participation of a particular input is shown in Fig. 8. It can be seen that the number of input/output structures that recruit a particular input can be as low as 1 to as high as 130. This clearly demonstrates that most inputs are narrowly recruited to trigger only a handful of outputs, although a few key inputs are implicated in triggering a large number of outputs. Specifically, 73% of inputs signaling molecules were found to be narrowly recruited (i.e., recruited by 10 or less input/output structures), whereas 10% of input signaling molecules were found to be highly recruited (i.e., recruited by 50 or more input/output structures). The complete list of highly recruited input signaling molecules is provided in Table 4. As expected, energy transfer metabolites such as ATP and GTP and proteins such as Grb2 and Sos were found to be highly recruited. This is in agreement with experimental observations that report that the protein Grb2 is a crucial component linking the receptor tyrosine kinase pathways (e.g., VEGF, EGF) with downstream proteins such as Ras and Sos (57). The identification of highly/narrowly recruited input signaling molecules is important for developing targeted therapeutic interventions in signaling pathways. Specifically, interfering with a highly recruited signaling molecule is more likely to lead to side effects by negating many possibly desirable outputs.
FIGURE 8.
Graph depicts the number of times a particular input is recruited by an input/output structure. Highly recruited inputs include common currency such as ATP GTP along proteins such as Grb2 and Sos.
TABLE 4.
Highly recruited input signaling molecules (50 or more input/output structures)
| Input signaling molecules | No. input/output structures |
|---|---|
| p101_cytoplasm | 50 |
| FOXO_cytoplasmINAC | 50 |
| GPCRligand_ | 50 |
| ComplexGPCRG_sub__alpha_G_sub__beta__gamma__cytoplasm | 50 |
| ComplexRasGDP_cytoplasm | 63 |
| ComplexGDPRas_cytoplasm | 65 |
| IRligand_ | 71 |
| IR_cytoplasm | 71 |
| IRS_cytoplasm | 71 |
| PKB_cytoplasm | 72 |
| PI4,5P2_cytoplasm | 120 |
| p85_cytoplasm | 123 |
| p110_cytoplasm | 123 |
| SOS_cytoplasmINAC | 128 |
| GTP_cytoplasm | 128 |
| ATP_cytoplasm | 130 |
| Grb2_cytoplasm | 131 |
In summary, we find that the topology of the input/output structures varies widely from simple linear paths to highly connected cascades. Output degeneracy tends to be either very high or very low, whereas input degeneracy is very low for most inputs and very high for a few key inputs (exponential distribution). Clearly, input and output degeneracy plays a key role in understanding the organizational principles of signaling networks and devising therapeutic interventions by blocking key transformations. In the next section, we describe how to systematically identify which transformations to disrupt to deny and/or enable different outcomes.
Min-Interference problem
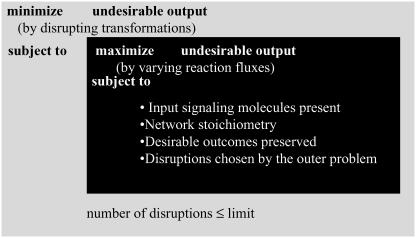
The results for the Min-Input problem indicate that cellular outputs can be stimulated by several different signaling molecules hinting at the enormous complexity associated with disrupting signal transduction. Given a set of input signaling molecules (Min), the Min-Interference problem pinpoints the minimal disruption strategies needed to prevent an undesirable cellular outcome while preserving the desired ones (see Fig. 1 b). At the core of the search algorithm is the bilevel optimization problem depicted pictorially in Fig. 9. Bilevel programming problems are hierarchical optimization problems where the constraints of one problem (outer problem) are defined in part by a second parametric optimization problem (inner problem). Specifically, in the case of the Min-Interference problem, the inner level problem identifies the worst-case scenario response of the network by maximizing the flow to the undesirable response. The outer problem then guarantees that the solution of the inner problem is equal to zero by systematically disrupting a minimal number of transformations. A similar framework has been proposed before and successfully implemented for identifying gene knockouts in metabolic networks leading to the overproduction of a particular metabolite (58).
FIGURE 9.
Bilevel optimization structure for suggesting disruption targets. The inner problem allocates the fluxes through the signaling reactions to maximize the formation of an undesirable output (i.e., worst-case scenario). The outer problem then minimizes the flow to the undesirable outcomes by restricting access (i.e., disrupting) to key transformations available to the optimization of the inner problem.
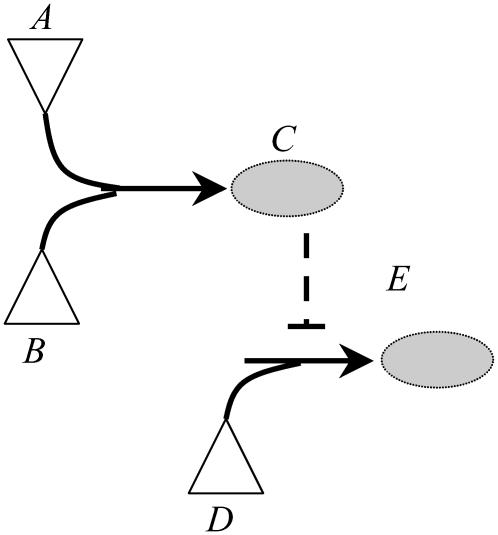
It is important to emphasize that the presence of an inhibitor molecule leads to the disruption of the corresponding chemical transformation(s) without the need for any further action. Inhibitor molecules can either be inputs to the signaling network whose presence can be controlled or they can be produced through a set of chemical transformations. This implies that both the set of inputs present and the underlying chemical transformations in tandem determine the presence or absence of inhibiting species in the network. For example, in the context of the small pathway shown in Fig. 10, recruitment of inputs A, B, and D implies that the formation of output E is blocked due to the production of inhibitor molecule C for the transformation D→E. Alternatively, assuming that only the input signaling molecule D is present in the system enables the production of output E. In the results described in this section, we assume that all of the input signaling molecules (Min) are present in the network. We also postulate that all inhibitor molecules that can be produced from the set of input signaling molecules (Min) are present in the system. Therefore, the disruption targets identified by the Min-Interference problem are in addition to those chemical transformations that are not achievable due to presence of inhibitors. This assumption that all “reachable” inhibitors are present is described mathematically as follows:
 |
where the set IR is identified by employing an input/output feasibility analysis for every inhibitor molecule (6). This constraint forces a net production of each inhibitor i that is constitutively available to the system. The set of chemical transformations that are unreachable or disrupted by the presence of inhibitors  is found by examining if at least one inhibitor i for that transformation is a member of set IR.
FIGURE 10.
Set of input signaling molecules present determines the set of inhibitor molecules that can be formed. Recruitment of input molecules A, B, and D blocks the production of output E by disruption of the transformation D→E by the inhibitor molecule C. Alternatively, if input molecule D alone is present, production of E is preserved. The inhibitor action is indicated by dotted line.
The conceptual optimization model shown in Fig. 9 is fleshed-out in full detail as follows. Given the set of input transformations (Nin), an undesirable output  , a subset of desirable outputs
  to be preserved, and the set of inhibitor molecules (
 ), the bilevel optimization problem for identifying a disruption strategy to prevent an undesirable output while preserving the desired outputs is posed as follows:
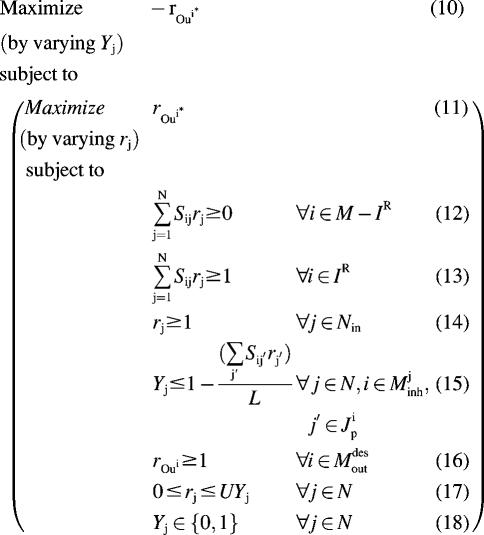 |
 |
(19) |
The objective function 10 for the outer problem minimizes the flow to the undesirable outcome (i.e.,  ), whereas the objective function for the inner problem 11 maximizes the flow to the undesirable outcome. This is because the solution of the inner problem establishes the worst-case scenario for the system, whereas the outer problem drives this worst-case flow to the undesirable output to zero by disrupting reaction steps. Disruption of chemical transformations either by inhibitor action or by targeted disruption eliminates reactions that consume the reactants involved in the disrupted chemical transformations. Consequently, this leads to the accumulation of some of these reactant species. This is allowed through constraint 12, which ensures that no deficit in the mass balance of any chemical species is present although a surplus or accumulation is allowed. Constraint set 13 ensures that, as discussed earlier, all inhibitor molecules that can be derived from the current input signaling molecules are present in the system. The inflow of input signaling molecules is switched on by setting them greater than or equal to one (constraint 14). Constraint 15 disrupts inhibited transformations (by setting
  = 0) if the corresponding inhibitor is present. Constraint 16 preserves the desired outputs (
  ) by ensuring that the flow to these outputs is possible. Constraint 17 forces the reaction flux corresponding to all disrupted chemical transformations in the network to zero, and finally constraint 19 places an upper limit of K on the number of allowable interferences.
A mathematically valid disruption strategy is identified if the value of the objective function reaches zero, implying that the transmission of the extracellular signal to the undesirable output is blocked. As in the case of the Min-Input problem, alternative interference strategies (i.e., multiple optima) are identified by implementing the above optimization problem within an iterative procedure where previously found solutions are excluded at each iteration by employing integer cut constraints. First, single disruptions are investigated by setting K equal to one. Multiple disruption strategies are investigated by successively increasing the value of K by one after all single disruption strategies are found.
Computational results
The following studies were conducted to test the ability of the Min-Interference problem to elucidate targeted disruptions:
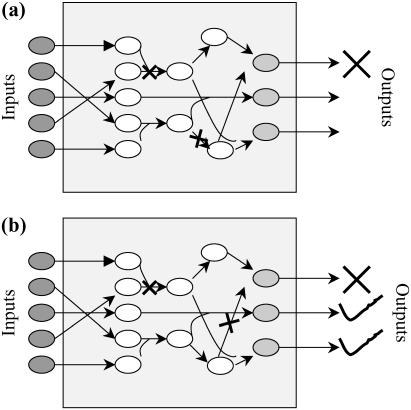
Identify the minimal set of transformations that need to be disrupted to prevent each output separately (see Fig. 11 a).
Identify the minimal set of transformations that need to be disrupted to prevent each output separately while preserving the flow to a set of desirable outputs (see Fig. 11 b).
FIGURE 11.
Pictorial representation of the two different problems solved within the Min-Interference framework. In a, we identify disruption strategies to prevent an undesirable outcome, whereas in b we identify disruption strategies to prevent an undesirable outcome while preserving the formation of desirable outcomes.
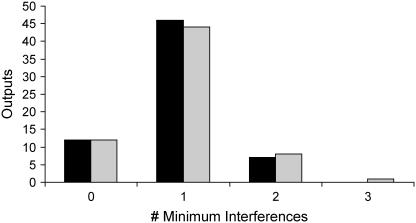
By iteratively solving the Min-Interference problem once for each output, we generate the distribution of minimum interference strategies for disrupting a particular output (see Fig. 12). Following from our assumptions stated in previous section, the bar for zero interference corresponds to outputs that are already inaccessible due to the presence of inhibitor molecules in the signaling network. Most of the outputs (i.e., 47) require a minimum of a single disruption to be blocked and only two outputs require a minimum of two disruptions.
FIGURE 12.
Distribution of the minimum number of interferences required to disrupt the production of a particular cellular outcome. The black bars represent the distribution of minimum number of interferences identified to block a cellular outcome alone. The shaded bars correspond to the distribution of minimum number of interferences identified to block a cellular outcome while preserving the formation of desirable outcomes.
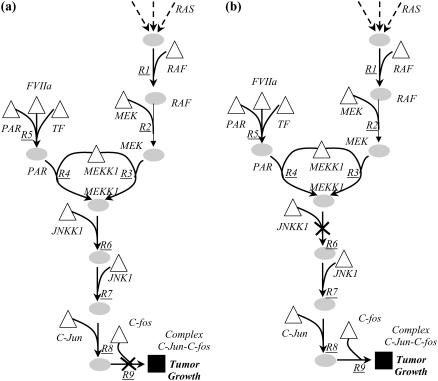
As expected, there exist multiple interference strategies that can block the formation of an undesirable outcome. We find that the Min-Interference framework is able to suggest both straightforward strategies involving the disruption of the final transformation(s) leading to the outcome, and relatively less intuitive strategies that target transformations far upstream of an undesirable outcome. For example, consider the interference strategies to block the formation of complex cJun-cFos, a major component of the transcription factor AP-1, which has been implicated for its role in tumor growth (59). A straightforward strategy to block the formation of the complex involves simple disrupting the heterodimeration of transcription factors cJun and cFos (see Fig. 13 a). However, we find a number of less intuitive strategies such as targeting the MEKK1-dependent activation of protein JNKK1 (see Fig. 13 b).
FIGURE 13.
In a, a straightforward strategy to block the formation of complex cJun-cfos involves disrupting the final transformation (R9) leading to the formation of the complex. A less intuitive strategy shown in b targets MEKK1-mediated activation of JNKK1 (R6), which is located far upstream from the complex.
Overall, a total of 10 distinct disruption strategies (4 single and 6 double) were found to block the formation of complex cJun-cFos. Whereas the single disruption strategies were found to focus on transformations downstream of the Ras-Map kinase cascade, the double disruption strategies target transformations within the Ras-Map kinase cascade. Interestingly, Ras-Map kinase cascades are known to participate in a diverse array of cellular programs including growth, proliferation, and survival, and several drug molecules have been developed to target these cascades as a means to eliminate undesirable outcomes (60). For example, by employing the drugs U0126 and PD98059, it is possible to inhibit the phosphorylation of MEK (60). Table 5 lists drug molecules that can carry out the identified disruption strategies demonstrating the relevance of identified targets.
TABLE 5.
List of the identified interference strategies to block the formation of cJun-cFos along with the list of available drug molecules reported to be able to block the targeted transformations
| Strategy | Type | Disrupted transformation(s) | Outputs blocked | Drug molecule(s) | References |
|---|---|---|---|---|---|
| 1 | Single | R7 | cJun-cFos | CNI-1493/JIP-1 | (59) |
| 2 | Single | R8 | cJun-cFos | Retenoid acid | (70) |
| 3 | Single | R9 | cJun-cFos | 52R | (71) |
| 4 | Single | R6 | cJun-cFos | CEP1347 | (59) |
| 5 | Double | R4 | cJun-cFos | Azathioprine | (72) |
| R3 | Ets | ||||
| cPlA2 | |||||
| 6 | Double | R4 | cJun-cFos | Azathioprine | (72) |
| R2 | Ets | U0126/PD98059 | (73) | ||
| cPLA2 | |||||
| 7 | Double | R1 | cJun-cFos | RKIP | (74) |
| R4 | Ets | Azathioprine | (72) | ||
| cPLA2 | |||||
| 8 | Double | R5 | cJun-cFos | PN7051 | (75) |
| R1 | Ets | RKIP | (74) | ||
| cPLA2 | |||||
| 9 | Double | R2 | cJun-cFos | U0126/PD98059 | (73) |
| R5 | Ets | PN7051 | (75) | ||
| cPLA2 | |||||
| 10 | Double | R5 | cJun-cFos | PN7051 | (75) |
| R3 | Ets | Azathioprine | (72) | ||
| cPlA2 |
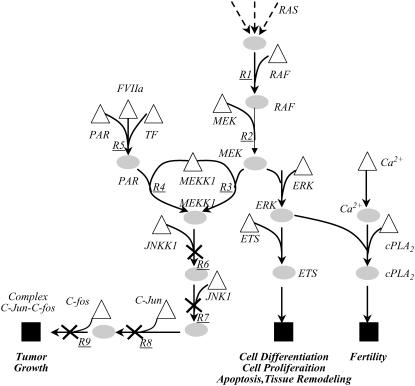
In the second study, we impose constraints that ensure that whereas a specific output is disrupted, a set of desirable ones is left unaffected. This modification attempts to identify disruptions that are less likely to interfere with necessary biological processes. The set of desirable outputs here is listed in Table 6. The identified distribution of the minimum required number of disruptions for different outputs, while preserving the set of desirable outcomes (indicated by shaded bars in Fig. 12), is almost identical to the previous case. However, the number of alternative disruption strategies identified is found to be substantially decreased. For example, consider the disruption strategy identified previously to block the formation of complex cJun-cFos. The total number of interference strategies decreased from 10 (4 single, 6 double) to 4 (4 single) when the flow to desirable outputs is preserved. Furthermore, the interference strategies are found to exclusively target the terminal transformations located downstream of the Ras-Map kinase cascade rather than disrupting the initial steps governing the Map kinase cascade as shown in Fig. 14. In addition to eliminating complex cJun-cFos, we find that the disruption strategies that target the Map kinase cascades also block the activation of cPLA2 and the expression of Ets transcription factors, which play an important role in cell differentiation, cell proliferation, tissue remodeling, and apoptosis (43) (see Table 5). These results indicate that when the flow to desirable outcomes is preserved, the number of alternative interference strategies decreases and the suggested strategies are found to predominantly target the terminal transformations of the signaling pathways.
TABLE 6.
List of desirable outputs
| Desirable outputs | |
|---|---|
| Transcription_br_cellcycleprogression_Cytosol | VRAP_PlasmaMembrane |
| Anti-apoptosis_Nucleus | Paxillin_PlasmaMembrane |
| ComplexI_kappa_BNF_kappa_B_Intracellular | HSP27_PlasmaMembrane |
| a127_degraded_Intracellular | Tumorsuppression_ |
| CSL_Nuclearmembrane | Survival_ |
| Ets_Nuclearmembrane | Gene_space_transcription_Cytosol |
| STAT3_Nuclearmembrane | Genetranscription_nucleus |
| STAT1_Nuclearmembrane | S6K_cytoplasm |
| TCF_Nuclearmembrane | GSK3_cytoplasm |
| PLD_PlasmaMembrane | Caspase-9_cytoplasm |
| PLA_sub_2_endsub_PlasmaMembrane | BAD_cytoplasm |
| Src_PlasmaMembrane | NOS_cytoplasm |
| Survivin_PlasmaMembrane | ComplexFOXO14-3-3_cytoplasm |
| IGFBP1_nucleus | Cyclind_nucleus |
| Rb_LateG_sub_1_endsub_ | GADD45_nucleus |
| a102_degraded_Mitosis | scl-1_nucleus |
| ComplexeNOSCa_super_2+_endsuper_PlasmaMembrane | ComplexcPLA_sub_2_endsubCa_super_2+_endsuper_PlasmaMembrane |
The flow to these outputs is preserved while devising interference strategies for blocking the formation of complex cJun-cFos.
FIGURE 14.
Alternative interference strategies identified to block the formation of complex cJun-cfos while preserving the formation of the formation of ETS transcription factors and cPLA2. The Min-Interference framework finds only single interference strategies. As shown in the figure, the alternative strategies target transformations R6, R7, R8, and R9, respectively. Note that all the disruption strategies target the terminal transformations located downstream of the MAP kinase cascades.
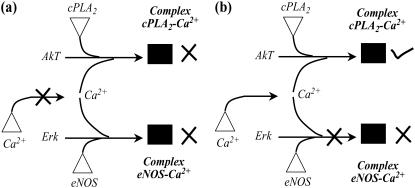
The hypothesis that by preserving the flow to desirable outputs the likelihood of side effects is reduced is next tested by considering two separate examples. First, we explore blocking the formation of endothelial nitric oxide synthase (eNOS) an endothelial-cell-specific isoform of nitric oxide-producing enzyme. eNOS has been implicated in both angiogenesis and vasculogenesis, suggesting that the modulation of eNOS may be a potent new strategy for the control of pathological neovascularization (61,62). As illustrated in Fig. 15 a, one strategy for eliminating eNOS activity is to disrupt the transport of Ca2+ ion from endoplasmic reticulum. However, this also results in loss of cPLA2 activity, which is implicated in reduced fertility (63). Alternatively, we find that targeting the Ca2+-dependent activation of eNOS within the plasma membrane as shown in Fig. 15 b preserves cPLA2 activity. Interestingly, this disruption strategy is identical to the action of cavtratin, a cell-permeable peptide molecule, which by inhibiting eNOS activity, was shown to exhibit anti-tumor properties (61).
FIGURE 15.
Interference strategies to block eNOS activation. Disrupting Ca2+ transport from the endoplasmic reticulum eliminates both cPLA2 and eNOS activation as shown in a. In contrast, disrupting Erk-mediated activation of eNOS preserves cPLA2 activation as shown in b.
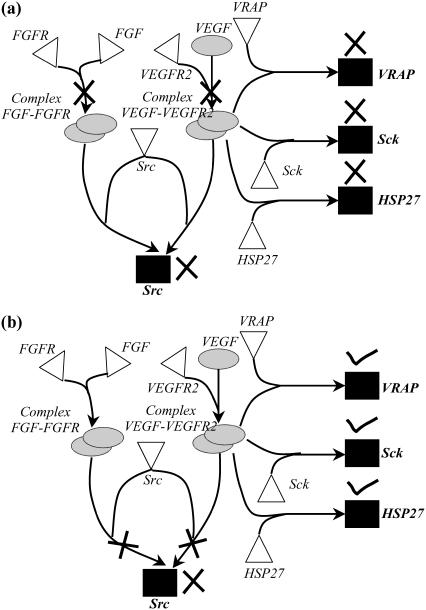
In the previous study, we find that the identified disruption target can be accomplished by an existing drug molecule. Next, we describe an example where a disruption strategy is identified that to our knowledge is not the target of any existing drug molecules. Research has implicated Src in the progression of tumor angiogenesis (64), qualifying Src as an attractive target for disruption. By disrupting both VEGF and fibroblast growth factor (FGF) receptor ligand binding, thalidomide blocks Src activity (see Fig. 16 a) (65). However, as shown in Fig. 16 a, disrupting both VEGF and FGF receptor-ligand binding also interferes with the activation of proteins VRAP, Sck, and HSP27. Experimental studies have shown that VRAP plays an important role in the progression of normal angiogenesis (66), and HSP27 is known to aid in the survival and recovery of cells exposed to stressful conditions (67). Also, it has been reported that employing thalidomide as a means of eliminating Src activity may result in compromised wound healing and stop the normal reproductive cycle in women, among other side effects (68). In contrast, we find that by imposing as a restriction the preservation of desired output in Min-Interference we identify, among others, a previously unexplored target involving the disruption of both VEGF-VEGFR2 and FGF-FGFR mediated activation of protein Src (see Fig. 16 b), which preserves VRAP, Sck, and HSP27 activity.
FIGURE 16.
Interference strategies to block the activation of Src. Disrupting both VEGF and FGF ligand-receptor binding eliminates VRAP, Sck, and Hsp27 activity along with Src production as shown in a. In contrast, disruption of both VEGF-VEGFR2 and FGF- FGFR complex-mediated Src activation blocks Src activation alone as shown in b.
SUMMARY/DISCUSSION
In this work, a computational base was introduced for the systematic analysis and targeted disruption of signal transduction networks. A stoichiometric formalism was adopted to model the complex network of interacting molecules in signaling pathways as a network of chemical transformations. The cellular stimuli to the signaling pathways were described as inputs to the signaling network while cellular responses were abstracted as outputs. The developed frameworks were benchmarked by applying them to a large-scale signaling network constructed from nine signaling pathways known to play an active role in the growth and progression of prostate cancer. It is important to emphasize that the introduced frameworks cannot capture dynamic effects in signal propagation as no kinetic information is included. Therefore, only connectivity encoded insight can be elucidated implying that further detailed kinetic based analysis may be needed to fully recapitulate the underlying input-output structures and/or interventions.
First, we introduced the Min-Input framework to identify all cellular stimuli that can elicit the formation of a particular response. By exhaustively identifying all input/output structures, Min-Input was able to extract a number of important topological properties of signaling networks. Specifically, we found that the outputs can be classified into two distinct sets, highly degenerate or highly specific depending on whether they can be elicited by many different input combinations or a few dedicated ones. This classification has important implications for guiding the development of therapeutic strategies. For example, interfering with highly recruited input molecules (e.g., Sos) is likely to impact many network functions, whereas affecting inputs with dedicated participation is more likely to cause only a specific event. Similarly, blocking the formation of a highly degenerate outcome (e.g., cyclinD) is hard to accomplish because it requires the disruption of multiple steps. Given a set of input signaling molecules the Min-Interference framework identifies the minimal set of disruptions needed to eliminate an undesirable outcome. Computational results indicated that Min-Interference was able to suggest multiple disruption strategies that were biologically relevant as several drug molecules exist to carry out the identified disruptions. Furthermore, by proactively preserving desirable outputs, disruption strategies were identified that appear to be less likely to involve side effects by contrasting them against the action and reported side effects of existing drug molecules. Min-Interference can also be used to examine if a particular combination of drug molecules is effective when used in combination and not alone (i.e., exhibit drug synergy). This is particularly important for pathologies such as cancer, where multiple pathways may be dysfunctional, requiring a combination of several drug molecules (44) for effective treatment.
The reconstruction of signaling networks is progressing with a fast pace (6). Efforts are under way to identify “signature networks” that are highly specific descriptors of many diseases (e.g., renal cell carcinoma)(69,70). Whenever available, the Min-Interference can be used to identify ways to negate the occurrence of these “signature networks”. Nevertheless, it is important to emphasize that existing signaling reconstructions are inherently incomplete. Therefore, input-output structure (Min-Input) or disruption results (Min-Interference) are bound to, for some cases, reflect these missing links. However, results obtained that are inconsistent with biological knowledge or experiment can be used to come up with hypotheses for “filling in” gaps in signaling reconstructions. Furthermore, the lack of any kinetic information in the signaling network description can lead to an overestimation of the number of viable input-output structures embedded within a signaling network. However, this overestimation of the signaling network functionalities ensures that all identified disruption strategies will be valid for the true signaling network. Despite these limitations, this work represents an important first step toward constructing an integrated computational base for elucidating the input/output structure and subsequently redesigning signaling networks.
SUPPLEMENTARY MATERIAL
An online supplement to this article can be found by visiting BJ Online at http://www.biophysj.org.
Acknowledgments
The authors thank Dr. Anshuman Gupta for helpful discussions and suggestions.
Funding from the Dept. of Energy, award DE-FG02-05ER25684, is gratefully acknowledged.
References
- 1.Takahashi, K., S. N. V. Arjunan, and M. Tomita. 2005. Space in systems biology of signaling pathways-towards intracellular molecular crowding in silico. FEBS Lett. 579:1783–1788. [DOI] [PubMed] [Google Scholar]
- 2.Schlessinger, J. 2004. Common and distinct elements in cellular signaling via EGF and FGF receptors. Science. 306:1506–1507. [DOI] [PubMed] [Google Scholar]
- 3.Cross, M. J., J. Dixelius, T. Matsumoto, and L. Claesson-Welsh. 2003. VEGF-receptor signal transduction. Trends Biochem. Sci. 28:488–494. [DOI] [PubMed] [Google Scholar]
- 4.Sivakumaran, S., S. Hariharaputran, J. Mishra, and U. S. Bhalla. 2003. The Database of Quantitative Cellular Signaling: management and analysis of chemical kinetic models of signaling networks. Bioinformatics. 19:408–415. [DOI] [PubMed] [Google Scholar]
- 5.Papin, J. A., and B. O. Palsson. 2004. Topological analysis of mass-balanced signaling networks: a framework to obtain network properties including crosstalk. J. Theor. Biol. 227:283–297. [DOI] [PubMed] [Google Scholar]
- 6.Papin, J. A., T. Hunter, B. O. Palsson, and S. Subramaniam. 2005. Reconstruction of cellular signalling networks and analysis of their properties. Nat. Rev. Mol. Cell Biol. 6:99–111. [DOI] [PubMed] [Google Scholar]
- 7.Aksenov, S. V., B. Church, A. Dhiman, A. Georgieva, R. Sarangapani, G. Helmlinger, and I. G. Khalil. 2005. An integrated approach for inference and mechanistic modeling for advancing drug development. FEBS Lett. 579:1878–1883. [DOI] [PubMed] [Google Scholar]
- 8.Apic, G., T. Ignjatovic, S. Boyer, and R. B. Russell. 2005. Illuminating drug discovery with biological pathways. FEBS Lett. 579:1872–1877. [DOI] [PubMed] [Google Scholar]
- 9.Krull, M., N. Voss, C. Choi, S. Pistor, A. Potapov, and E. Wingender. 2003. TRANSPATH: an integrated database on signal transduction and a tool for array analysis. Nucleic Acids Res. 31:97–100. [DOI] [PMC free article] [PubMed] [Google Scholar]
- 10.Schacherer, F., C. Choi, U. Gotze, M. Krull, S. Pistor, and E. Wingender. 2001. The TRANSPATH signal transduction database: a knowledge base on signal transduction networks. Bioinformatics. 17:1053–1057. [DOI] [PubMed] [Google Scholar]
- 11.Matys, V., E. Fricke, R. Geffers, E. Gossling, M. Haubrock, R. Hehl, K. Hornischer, D. Karas, A. E. Kel, O. V. Kel-Margoulis, D. U. Kloos, S. Land, B. Lewicki-Potapov, H. Michael, R. Munch, I. Reuter, S. Rotert, H. Saxel, M. Scheer, S. Thiele, and E. Wingender. 2003. TRANSFAC: transcriptional regulation, from patterns to profiles. Nucleic Acids Res. 31:374–378. [DOI] [PMC free article] [PubMed] [Google Scholar]
- 12.Gilman, A. G., M. I. Simon, H. R. Bourne, B.A. Harris, R. Long, E. M. Ross, J. T. Stull, R. Taussig, H. R. Bourne, A. P. Arkin, M H. Cobb, et al. 2002. Overview of the alliance for cellular signaling. Nature. 420:703–706. [DOI] [PubMed] [Google Scholar]
- 13.Li, J., Y. Ning, W. Hedley, B. Saunders, Y. Chen, N. Tindill, T. Hannay, and S. Subramaniam. 2002. The Molecule Pages database. Nature. 420:716–717. [DOI] [PubMed] [Google Scholar]
- 14.Bader, G. D., D. Betel, and C. W. Hogue. 2003. BIND: the Biomolecular Interaction Network Database. Nucleic Acids Res. 31:248–250. [DOI] [PMC free article] [PubMed] [Google Scholar]
- 15.Bader, G. D., I. Donaldson, C. Wolting, B. F. Ouellette, T. Pawson, and C. W. Hogue. 2001. BIND–The Biomolecular Interaction Network Database. Nucleic Acids Res. 29:242–245. [DOI] [PMC free article] [PubMed] [Google Scholar]
- 16.Xenarios, I., L. Salwinski, X. J. Duan, P. Higney, S. M. Kim, and D. Eisenberg. 2002. DIP, the Database of Interacting Proteins: a research tool for studying cellular networks of protein interactions. Nucleic Acids Res. 30:303–305. [DOI] [PMC free article] [PubMed] [Google Scholar]
- 17.Mi, H., B. Lazareva-Ulitsky, R. Loo, A. Kejariwal, J. Vandergriff, S. Rabkin, N. Guo, A. Muruganujan, O. Doremieux, M. J. Campbell, H. Kitano, and P. D. Thomas. 2005.The PANTHER database of protein families, subfamilies, functions and pathways. Nucleic Acids Res. 33:D284–D288. [DOI] [PMC free article] [PubMed] [Google Scholar]
- 18.Scita, G., P. Tenca, E. Frittoli, A. Tocchetti, M. Innocenti, G. Giardina, and P. P. Di Fiore. 2000. Signaling from Ras to Rac and beyond: not just a matter of GEF's. EMBO J. 19:2393–2398. [DOI] [PMC free article] [PubMed] [Google Scholar]
- 19.Weng, G., U. S. Bhalla, and R. Iyengar. 1999. Complexity in biological signaling systems. Science. 284:92–96. [DOI] [PMC free article] [PubMed] [Google Scholar]
- 20.Bhalla, U. S., and R. Iyengar. 1999. Emergent properties of networks of biological signaling pathways. Science. 283:381–387. [DOI] [PubMed] [Google Scholar]
- 21.Jordon, J. D., E. M. Landau, and R. Iyengar. 2000. Signaling Networks: The Origins of Cellular Multitasking. Cell. 103:193–200. [DOI] [PMC free article] [PubMed] [Google Scholar]
- 22.Neves, S. R., and R. Iyengar. 2002. Modeling of signaling networks. Bioessays. 24:1110–1117. [DOI] [PubMed] [Google Scholar]
- 23.Haugh, J. M. 2002. A unified model for signal transduction reactions in cellular membranes. Biophys. J. 82:591–604. [DOI] [PMC free article] [PubMed] [Google Scholar]
- 24.Shvartsman, S. Y., H. S. Wiley, W. M. Deen, and D. A. Lauffenburger. 2001. Spatial range of autocrine signaling: modeling and computational analysis. Biophys. J. 81:1854–1867. [DOI] [PMC free article] [PubMed] [Google Scholar]
- 25.Heinrich, R., B. G. Neel, and T. A. Rapoport. 2002. Mathematical models of protein kinase signal transduction. Mol. Cell. 9:957–970. [DOI] [PubMed] [Google Scholar]
- 26.Femenia, F. J., and G. Stephanopoulos. 2003. Activation Ratios for Reconstruction of Signal Transduction Networks. IN SMA program of Molecular Engineering of Biological and Chemical Systems, Cambridge, MA.
- 27.Hoffmann, A., A. Levchenko, M. L. Scott, and D. Baltimore. 2002. The IkappaB-NF-kappaB signaling module: temporal control and selective gene activation. Science. 298:1241–1245. [DOI] [PubMed] [Google Scholar]
- 28.Bhalla, U. S. 2002. The chemical organization of signaling interactions. Bioinformatics. 18:855–863. [DOI] [PubMed] [Google Scholar]
- 29.Kremling, A., K. Jahreis, J. W. Lengeler, and E. D. Gilles. 2000. The organization of metabolic reaction networks: a signal-oriented approach to cellular models. Metab. Eng. 2:190–200. [DOI] [PubMed] [Google Scholar]
- 30.Kremling, A., and E. D. Gilles. 2001. The organization of metabolic reaction networks. II. Signal processing in hierarchical structured functional units. Metab. Eng. 3:138–150. [DOI] [PubMed] [Google Scholar]
- 31.Shymko, R. M., P. D. Meyts, and R. Thomas. 1997. Logical analysis of timing-dependent receptor signalling specificity: application to insulin receptor metabolic and mitogenic signalling pathways. Biochem. J. 326:463–469. [DOI] [PMC free article] [PubMed] [Google Scholar]
- 32.Schoeberl, B., C. Eichler-Jonsson, E. D. Gilles, and G. Muller. 2002. Computational modeling of the dynamics of the MAP kinase cascade activated by surface and internalized EGF receptors. Nat. Biotechnol. 20:370–375. [DOI] [PubMed] [Google Scholar]
- 33.von Dassow, G., E. Meir, E. M. Munro, and G. M. Odell. 2000. The segment polarity network is a robust developmental module. Nature. 406:188–192. [DOI] [PubMed] [Google Scholar]
- 34.Von Dassow, G., and G. M. Odell. 2002. Design and constraints of the Drosophila segment polarity module: robust spatial patterning emerges from intertwined cell state switches. J. Exp. Zool. 294:179–215. [DOI] [PubMed] [Google Scholar]
- 35.Ingolia, N. T. 2004. Topology and robustness in the Drosophila segment polarity network. PLoS Biol. 2:E123. [DOI] [PMC free article] [PubMed] [Google Scholar]
- 36.Albert, R., and H. G. Othmer. 2003. The topology of the regulatory interactions predicts the expression pattern of the segment polarity genes in Drosophila melanogaster. J. Theor. Biol. 223:1–18. [DOI] [PMC free article] [PubMed] [Google Scholar]
- 37.Yi, T. M., Y. Huang, M. I. Simon, and J. Doyle. 2000. Robust perfect adaptation in bacterial chemotaxis through integral feedback control. Proc. Natl. Acad. Sci. USA. 97:4649–4653. [DOI] [PMC free article] [PubMed] [Google Scholar]
- 38.Alon, U., M. G. Surette, N. Barkai, and S. Leibler. 1999. Robustness in bacterial chemotaxis. Nature. 397:168–171. [DOI] [PubMed] [Google Scholar]
- 39.Kholodenko, B. N., J. B. Hoek, H. V. Westerhoff, and G. C. Brown. 1997. Quantification of information transfer via cellular signal transduction pathways. FEBS Lett. 414:430–434. [DOI] [PubMed] [Google Scholar]
- 40.Ptashne, M., and A. Gann. 2003. Signal transduction. Imposing specificity on kinases. Science. 299:1025–1027. [DOI] [PubMed] [Google Scholar]
- 41.Park, S. H., A. Zarrinpar, and W. A. Lim. 2003. Rewiring MAP kinase pathways using alternative scaffold assembly mechanisms. Science. 299:1061–1064. [DOI] [PubMed] [Google Scholar]
- 42.Stelling, J., U. Sauer, Z. Szallasi, F. J. Doyle 3rd, and J. Doyle. 2004. Robustness of cellular functions. Cell. 118:675–685. [DOI] [PubMed] [Google Scholar]
- 43.Oikawa, T. 2004. ETS transcription factors: Possible targets for cancer therapy. Cancer Sci. 95:626–633. [DOI] [PMC free article] [PubMed] [Google Scholar]
- 44.McCarty, M. F. 2004. Targeting multiple signaling pathways as a strategy for managing prostate cancer: multifocal signal modulation therapy. Integrative Cancer Theories. 3:349–380. [DOI] [PubMed] [Google Scholar]
- 45.Hucka, M., A. Finney, H. M. Sauro, H. Bolouri, J. C. Doyle, H. Kitano, A. P. Arkin, B. J. Bornstein, D. Bray, A. Cornish-Bowden, A. A. Cuellar, S. Dronov, et al. 2003. The Systems Biology Markup Language (SBML): a medium for representation and exchange of biochemical network models. Bioinformatics. 19:524–531. [DOI] [PubMed] [Google Scholar]
- 46.Brown, M. Perl programmers's reference. 1999. Osborne/McGraw-Hill, Berkeley, CA.
- 47.Brooke, A., D. Kendrick, A. Meeravs, and R. Raman. 2002. GAMS: A User's Guide. GAMS Development, Washington, D.C.
- 48.Price, N. D., J. L. Reed, and B. O. Palsson. 2004. Genome-scale models of microbial cells: Evaluating the consequences of constraints. Nat. Rev. Microbiol. 2:886–897. [DOI] [PubMed] [Google Scholar]
- 49.Schilling, C. H., D. Letscher, and B. O. Palsson. 2000. Theory for the systemic definition of metabolic pathways and their use in interpreting metabolic function from a pathway-oriented perspective. J. Theor. Biol. 203:229–248. [DOI] [PubMed] [Google Scholar]
- 50.Schuster, S., and C. Hilgetag. 1994. On elementary flux modes in biochemical reaction systems at steady state. J. Biol. Syst. 2:165–182. [Google Scholar]
- 51.Schuster, S., D. A. Fell, and T. Dandekar. 2000. A general definition of metabolic pathways useful for systematic organization and analysis of complex metabolic networks. Nat. Biotechnol. 18:326–332. [DOI] [PubMed] [Google Scholar]
- 52.Klamt, S., and J. Stelling. 2002. Combinatorial complexity of pathway analysis in metabolic networks. Mol. Biol. Rep. 29:233–236. [DOI] [PubMed] [Google Scholar]
- 53.Burgard, A. P., E. V. Nikolaev, C. H. Schilling, and C. D. Maranas. 2004. Flux coupling analysis of genome-scale metabolic network reconstructions. Genome Res. 14:301–312. [DOI] [PMC free article] [PubMed] [Google Scholar]
- 54.Burgard, A. P., P. Pharkya, and C. D. Maranas. 2003. Optknock: a bilevel programming framework for identifying gene knockout strategies for microbial strain optimization. Biotechnol. Bioeng. 84:647–657. [DOI] [PubMed] [Google Scholar]
- 55.Burgard, A. P., S. Vaidyaraman, and C. D. Maranas. 2001. Minimal reaction sets for Escherichia coli metabolism under different growth requirements and uptake environments. Biotechnol. Prog. 17:791–797. [DOI] [PubMed] [Google Scholar]
- 56.Burgard, A. P., and C. D. Maranas. 2001. Probing the performance limits of the Escherichia coli metabolic network subject to gene additions or deletions. Biotechnol. Bioeng. 74:364–375. [DOI] [PubMed] [Google Scholar]
- 57.Koretzky, G. A. 1997. The role of Grb2-associated proteins in T-cell activation. Immunol. Today. 18:401–406. [DOI] [PubMed] [Google Scholar]
- 58.Burgard, A. P., P. Pharkhya, and C. D. Maranas. 2003. Optknock: A bilevel programming framework for identifying gene knockout strategies for microbial strain optimization. Biotechnol. Bioeng. 74:364–375. [DOI] [PubMed] [Google Scholar]
- 59.Hartl, M., A. G. Bader, and K. Bister. 2003. Molecular targets of the oncogenic transcription factor jun. Curr. Cancer Drug Targets. 3:41–55. [DOI] [PubMed] [Google Scholar]
- 60.Hommes, D.W., M.P. Peppelenbosch, and S. J. van Deventer. 2003. Mitogen activated protein (MAP) kinase signal transduction pathways and novel anti-inflammatory targets. Gut. 52:144–151. [DOI] [PMC free article] [PubMed] [Google Scholar]
- 61.Gratton, J. P., M. I. Lin, J. Yu, E. D. Weiss, Z. L. Jiang, T. A. Fairchild, Y. Iwakiri, R. Groszmann, K. P. Claffey, Y. C. Cheng, and W. C. Sessa. 2003. Selective inhibition of tumor microvascular permeability by cavtratin blocks tumor progression in mice. Cancer Cell. 4:31–39. [DOI] [PubMed] [Google Scholar]
- 62.Duda, D. G., D. Fukumura, and R. K. Jain. 2004. Role of eNOS in neovascularization: NO for endothelial progenitor cells. Trends Mol. Med. 10:143–154. [DOI] [PubMed] [Google Scholar]
- 63.Bonventre, J. V., Z. Huang, M. R. Taheri, E. O'Leary, E. Li, M. A. Moskowitz, and A. Sapirstein. 1997. Reduced fertility and postischaemic brain injury in mice deficient in cytosolic phopholipase A2. Nature. 390:622–625. [DOI] [PubMed] [Google Scholar]
- 64.Weis, S., J. Cui, L. Barnes, and D. Cheresh. 2004. Endothelial barrier disruption by VEGF-mediated Src activity potentiates tumor cell extravasation and metastasis. J. Cell Biol. 167:223–229. [DOI] [PMC free article] [PubMed] [Google Scholar]
- 65.Richardson, P., T. Hideshima, and K. Anderson. 2002. Thalidomide: emerging role in cancer medicine. Annu. Rev. Med. 53:629–657. [DOI] [PubMed] [Google Scholar]
- 66.Wu, L., L. D. Mayo, J. D. Dunbar, K. M. Kessler, O. N. Ozes, R. S. Warren, and D. B. Donner. 2000. VRAP is an adaptor protein that binds KDR, a receptor for vascular endothelial cell growth factor. J. Biol. Chem. 275:6059–6062. [DOI] [PubMed] [Google Scholar]
- 67.Das, D., and N. Maulik. 2000. Physiological role of heat shock protein 27. In Heat Shock Protein in Myocardial Protection. R. C. M. Kukreja, editor. Landes Bioscience, Georgetow, TX.
- 68.Goldman, D. A. 2001. Thalidomide use: past history and current implications for practice. Oncol. Nurs. Forum. 28:471–477. [PubMed] [Google Scholar]
- 69.Nikolsky, Y., T. Nikolskaya, and A. Bugrim. 2005. Biological networks and analysis of experimental data in drug discovery. Drug Discov. Today. 10:653–662. [DOI] [PubMed] [Google Scholar]
- 70.Rhodes, D. R., and A. M. Chinnaiyan. 2005. Integrative analysis of the cancer transcriptome. Nat. Genet. 37:S31–S37. [DOI] [PubMed] [Google Scholar]
- 71.Zhou, X. F., X. Q. Shen, and L. Shemshedini. 1999. Ligand-activated retinoic Acid receptor inhibits AP-1 transactivation by disrupting c-Jun/c-FOS dimerization. Mol. Endocrinol. 13:276–285. [DOI] [PubMed] [Google Scholar]
- 72.Brockmann, D., C. Bury, G. Kroner, H. C. Kirch, and H. Esche. 1995. Repression of the c-Jun trans-Activation function by the adenovirus type 12 E1A 52R protein correlates with the Inhibition of phosphorylation of the c-Jun Activation domain. J. Biol. Chem. 270:10754–10763. [DOI] [PubMed] [Google Scholar]
- 73.Siegmund, B., and M. Zeitz. 2004. Therapeutic approaches in inflammatory bowel disease based on the immunopathogenesis. Annales Academiae Medicae Bialostocenis. 49:22–30. [PubMed] [Google Scholar]
- 74.Duncia, J. V., J. B. Santella 3rd, and R. E. Olson. 1998. MEK inhibitors: the chemistry and biological activity of U0126, its analogs, and cyclization products. Bioorg. Med. Chem. Lett. 8:2839–2844. [DOI] [PubMed] [Google Scholar]
- 75.Park, S., M. L. Yeung, S. Beach, J. M. Shields, and K. C. Yeung. 2005. RKIP downregulates B-Raf kinase activity in melanoma cancer cells. Oncogene. 24:3535–3540. [DOI] [PubMed] [Google Scholar]
- 76.Orning, L., P. M. Fischer, C. K. Hu, E. Agner, M. Engebretsen, M. Husbyn, L. B. Petersen, U. Orvim, M. Llinas, and K. S. Sakariassen. 2002. A cyclic pentapeptide derived from the second EGF-like domain of Factor VII is an inhibitor of tissue factor dependent coagulation and thrombus formation. Thromb. Haemost. 87:13–21. [PubMed] [Google Scholar]


