Abstract
To study low-temperature signaling in plants, we previously screened for cold stress response mutants using bioluminescent Arabidopsis plants that express the firefly luciferase reporter gene driven by the stress-responsive RD29A promoter. Here, we report on the characterization and cloning of one mutant, frostbite1 (fro1), which shows reduced luminescence induction by cold. fro1 plants display reduced cold induction of stress-responsive genes such as RD29A, KIN1, COR15A, and COR47. fro1 leaves have a reduced capacity for cold acclimation, appear water-soaked, leak electrolytes, and accumulate reactive oxygen species constitutively. FRO1 was isolated through positional cloning and found to encode a protein with high similarity to the 18-kD Fe-S subunit of complex I (NADH dehydrogenase, EC 1.6.5.3) in the mitochondrial electron transfer chain. Confocal imaging shows that the FRO1:green fluorescent protein fusion protein is localized in mitochondria. These results suggest that cold induction of nuclear gene expression is modulated by mitochondrial function.
INTRODUCTION
Because of their sessile nature, plants frequently have to endure unfavorable environmental conditions. Consequently, plants have developed unique mechanisms to cope with environmental stresses such as chilling and freezing temperatures. Plants from temperate regions can acquire freezing tolerance after being exposed to low nonfreezing temperatures. This process is known as cold acclimation (Guy, 1990). Cold acclimation is associated with complex biochemical and physiological changes in plants, including changes in gene expression (Thomashow, 1994), leaf ultrastructure (Ristic and Ashworth, 1993), membrane lipid composition (Lynch and Steponkus, 1987; Miquel et al., 1993), enzyme activities, levels of sugars and polyamines (Levitt, 1980; Strand et al., 1997), and ion channel activities (Knight et al., 1996).
In Arabidopsis, a number of genes are induced during cold acclimation (Thomashow, 1999). These include RD29A (also known as COR78 or LTI78), KIN1, KIN2 (COR6.6), COR15A, and COR47 (RD17). The products of these genes are highly hydrophilic, but none of their functions (except those of COR15A) have been established. The constitutive expression of COR15A in Arabidopsis increased freezing tolerance at the chloroplast and protoplast levels (Artus et al., 1996). COR15A appears to function by decreasing the tendency of membranes to form the lamella-to-hexagonal II phase, which leads to membrane damage during freezing (Steponkus et al., 1998).
DNA regulatory elements in the promoters of cold-responsive genes have been identified and named dehydration-responsive element (DRE) or C-repeat (CRT) (Baker et al., 1994; Yamaguchi-Shinozaki and Shinozaki, 1994). DRE/CRT binding proteins, CBF1 (or DREB1B), CBF2 (or DREB1C), and CBF3 (or DREB1A) have been cloned and shown to function as transcriptional activators (Stockinger et al., 1997; Gilmour et al., 1998; Liu et al., 1998). CBFs/DREB1s are induced by low temperatures and are involved in the regulation of the DRE/CRT class of cold-responsive genes. Overexpression of CBF1 resulted in the constitutive expression of the DRE/CRT class of genes and enhanced freezing tolerance (Jaglo-Ottosen et al., 1998). Overexpression of a CBF1 isolog, DREB1A/CBF3, also brought about expression of the DRE/CRT class of genes and increased drought tolerance as well as freezing tolerance (Liu et al., 1998). As CBFs/DREB1s are induced rapidly by low temperatures (Thomashow, 1999), Gilmour et al. (1998) proposed that an as yet unknown transcriptional activator may exist in an inactive form at warm temperatures but may become activated at low temperatures to turn on the transcription of CBF/DREB1 genes.
Many plant adaptations to stresses involve mitochondria (Mackenzie and McIntosh, 1999). Mitochondria have been reported to be the main cellular organelles affected by low temperatures. Mitochondria at low temperatures exhibit changed respiration rate (Lyons and Raison, 1970), decreased cytochrome c oxidase activity (Prasad et al., 1994b), and enhanced alternative oxidase activity (Prasad et al., 1994b), leading to the generation of reactive oxygen species (ROS) such as superoxide and hydrogen peroxide and, consequently, oxidative stress (Rich et al., 1976; Huq and Palmer, 1978). For example, low temperatures induce oxidative stress in maize (Prasad et al., 1994a) and mitochondrial ROS accumulation (Prasad et al., 1995; De Santis et al., 1999; Gonzalez-Meler et al., 1999).
Although nuclear contributions to mitochondria have long been studied, mitochondrial effects on the nucleus have not received much attention until recently. Clearly, nuclear gene expression can be affected by the functional state of mitochondria (Parikh et al., 1987, 1989). This phenomenon is called retrograde regulation (Liao and Butow, 1993). In the yeast Saccharomyces cerevisiae, cells lacking mitochondrial DNA, and thus dysfunctional mitochondria, exhibit upregulation of the CIT2 gene encoding peroxisomal citrate synthase (Liao et al., 1991). This altered nuclear gene expres-sion caused by dysfunctional mitochondria involves two basic helix-loop-helix-leucine zipper transcription factors, Rtg1p and Rtg3p (Liao and Butow, 1993; Jia et al., 1997), and a member of the heat shock protein family, Rtg2p (Liao and Butow, 1993). In plants, our understanding of retrograde communications is limited by the lack of a suitable model system in which to study nuclear–mitochondrial interactions (Mackenzie and McIntosh, 1999).
Here, we report on the characterization and cloning of an Arabidopsis mutant, frostbite1 (fro1), which has altered cold-responsive nuclear gene expression because of a defect in mitochondrial complex I. The mutant was recovered in a genetic screen based on its reduced reporter gene induction by cold stress. RNA gel blot analysis showed that fro1 plants have lower levels of cold induction of stress-responsive genes such as RD29A, KIN1, COR15A, and COR47. fro1 leaves appear water-soaked, which mimics wild-type leaves that have been subjected to freezing stress. The mutant leaves are constitutively leaky to ions and have reduced capacity for cold acclimation. The mutant leaves show constitutive accumulation of ROS. FRO1 was isolated through map-based cloning. It encodes a protein with high similarity to the 18-kD Fe-S subunit of complex I (NADH dehydrogenase, EC 1.6.5.3) in the mitochondrial electron transfer chain. The FRO1:green fluorescent protein (GFP) fusion protein is localized in mitochondria. These results suggest that mitochondrial defects affect nuclear gene expression under low-temperature conditions, possibly through reactive oxygen messengers.
RESULTS
Identification of the FRO1 Locus
To study stress signaling pathways in plants, we previously generated transgenic Arabidopsis plants expressing the firefly luciferase reporter gene under the control of the stress-responsive RD29A promoter (Yamaguchi-Shinozaki and Shinozaki, 1993; Ishitani et al., 1997). The transgenic plants emit bioluminescence in response to low-temperature, abscisic acid, or NaCl treatment. Using these plants as the background line, mutants were isolated from an ethyl methanesulfonate–mutagenized M2 population based on altered luminescence responses under different stress conditions (Ishitani et al., 1997).
One mutant showing a lower level of luminescence under low-temperature treatment was chosen for further study. This mutant, in the loscold category (Ishitani et al., 1997), was named fro1 because of its translucent, water-soaked leaf phenotype, which is typically found in plants injured by chilling or freezing (Saltveit and Morris, 1990). fro1 was backcrossed to parental RD29A::LUC plants (i.e., wild type). Luciferase imaging after cold treatment showed that the resulting F1 plants all behaved like the wild type (Table 1). In the selfed F2 generation, plants segregated for wild-type and mutant RD29A::LUC response phenotypes at an ∼3:1 ratio (Table 1). These results indicate that fro1 is caused by a single recessive nuclear mutation. fro1 mutant plants were backcrossed to the wild type four times to remove possible unlinked mutations. All subsequent characterization was performed using the mutant that had been backcrossed.
Table 1.
Genetic Analysis of the fro1 Mutant (Wild Type × fro1)a
| Generation | Seedlings Tested | Wild Typeb | fro1 | χ2 | P |
|---|---|---|---|---|---|
| F1 | 25 | 25 | 0 | ||
| F2 | 544 | 412 | 132 | 0.157 | 0.693 |
Female × male.
Segregation was scored by comparing luminescence intensities from each genotype on the same plate. Seedlings with intensities >5000 counts per seedling after cold stress were considered to be wild type.
fro1 Mutant Plants Are Defective in Cold-Regulated Gene Expression
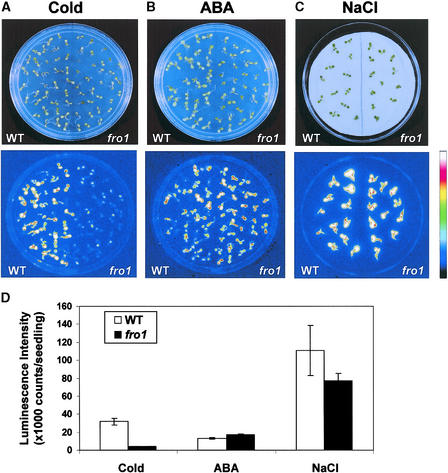
A comparison of luminescence images from wild-type and fro1 seedlings showed that the fro1 mutant clearly had reduced RD29A::LUC expression under cold stress (Figure 1A). However, RD29A::LUC responses to either abscisic acid or NaCl were not substantially different between fro1 and the wild type (Figures 1B and 1C). Quantification of the luminescence intensities revealed that cold-induced RD29A:: LUC expression in fro1 was only ∼12% of that in the wild type, whereas abscisic acid- or NaCl-induced expression was not significantly different between the mutant and the wild type (Figure 1D).
Figure 1.
RD29A::LUC Luminescence Images of Wild-Type and fro1 Seedlings.
(A) Morphology of seedlings on an agar plate and their luminescence images after treatment at 0°C for 72 h.
(B) Morphology of seedlings on an agar plate and their luminescence images after treatment with 100 μM abscisic acid for 3 h.
(C) Morphology of seedlings on an agar plate and their luminescence images after treatment with 300 mM NaCl for 5 h.
The color scale bar at right shows the luminescence intensity from black (lowest) to white (highest).
(D) Luminescence intensities of wild-type and fro1 seedlings after each treatment.
ABA, abscisic acid; WT, wild type.
Figure 2 shows the time course of RD29A::LUC expression in wild-type and fro1 seedlings under stress treatments. Wild-type plants showed considerable RD29A::LUC expression in response to cold treatment for 12 h or longer. By contrast, fro1 mutant plants did not show high levels of RD29A::LUC expression even after 48 or 72 h of cold treatment (Figure 2A). Abscisic acid or NaCl treatment for a few hours induced high levels of RD29A::LUC expression in both wild-type and fro1 plants. The peak level of abscisic acid response was slightly higher in fro1, but the NaCl response was higher in the wild type (Figures 2B and 2C).
Figure 2.
Time Courses of RD29A::LUC Expression in Wild-Type and fro1 Seedlings in Response to Cold, Abscisic Acid, or NaCl.
(A) RD29A::LUC expression after low-temperature treatment at 0°C.
(B) RD29A::LUC expression after treatment with 100 μM abscisic acid.
(C) RD29A::LUC expression after treatment with 300 mM NaCl.
RD29A::LUC expression was quantified as luminescence intensity. ABA, abscisic acid; WT, wild type.
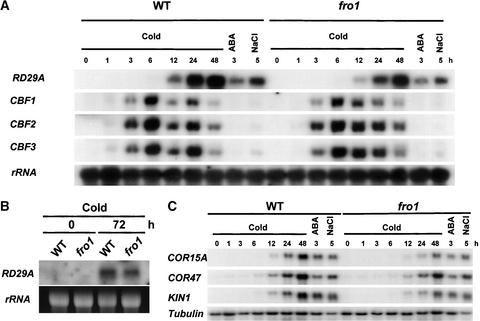
To determine whether endogenous RD29A gene induction also is altered in fro1, RNA gel blot hybridization was performed with total RNA extracted from wild-type and fro1 mutant seedlings treated with or without cold, abscisic acid, or osmotic stress (Figure 3). Consistent with the expression of the RD29A::LUC transgene, lower cold induction of the endogenous RD29A gene was detected in fro1 than in the wild type (Figures 3A and 3B). No significant reduction in RD29A expression was observed in fro1 in response to either abscisic acid or NaCl treatment. To test if the fro1 effect on cold regulation is specific to RD29A, the expression of three other cold-responsive genes, COR15A, KIN1, and COR47, was analyzed (Figure 3C). All three genes showed substantially reduced cold induction in fro1. By contrast, their expression in response to abscisic acid or NaCl was not lower in the mutant (Figure 3C).
Figure 3.
Gene Expression in Wild-Type and fro1 Mutant Plants in Response to Stress Treatments.
(A) and (C) RNA gel blot hybridization with total RNA (20 μg) from wild-type and fro1 mutant seedlings treated with low temperature (0°C) for the indicated times, abscisic acid (100 μM) for 3 h, or NaCl (300 mM) for 5 h. Gene probes used for RNA gel blot hybridization are indicated at left.
(B) RNA gel blot hybridization with total RNA (20 μg) from seedlings treated with low temperature (0°C) for either 0 or 72 h.
25S rRNA and tubulin were used as loading controls. ABA, abscisic acid; WT, wild type.
We tested and found that the cold-induced expression of CBF1, CBF2, and CBF3 was not lower in fro1 (Figure 3A). The CBF genes were induced early and peaked at 6 h in both the wild type and fro1 (Figure 3A). In wild-type plants, a consistently reduced level of CBF induction was observed at 12 h, and the induction level recovered to some extent at 24 h. In fro1, CBF induction decreased only slightly at 12 h (Figure 3A). At 48 h, CBF induction was very low in both the wild type and fro1. Cold induction of RD29A, COR15A, COR47, and KIN1 occurred later than that of CBF genes, and the induction levels were lower in fro1 throughout the time course (Figures 3A and 3C). The fro1 mutation reduced the cold induction of COR15A and KIN1 more than that of RD29A and COR47. The decrease in cold induction of the endogenous RD29A (Figures 3A and 3B) does not seem to be as great as that of the RD29A::LUC transgene (Figure 2A). This is probably because the transgene had <700 bp of the RD29A promoter region (Ishitani et al., 1997). In comparison, the endogenous RD29A gene may contain more regulatory elements in its promoter, introns, or untranslated regions and thus may be subjected to more complex regulation.
fro1 Mutant Leaves Are Translucent and Resemble Wild-Type Leaves That Have Been Subjected to Freezing
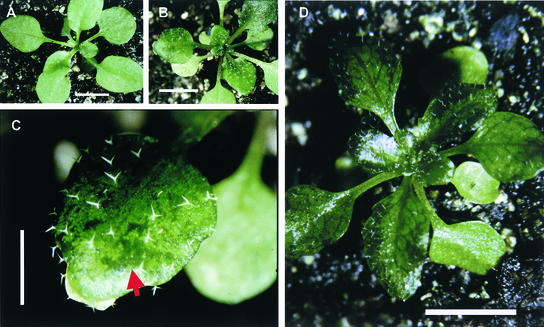
Some of the well-known freezing injuries include water-soaked phenotypes in leaves and reduced plant growth (Saltveit and Morris, 1990). Some chilling-sensitive plants also appear water-soaked in response to chilling damage (Saltveit and Morris, 1990). Under normal growth conditions, leaves of fro1 mutant plants appear water-soaked and translucent, with dark green color (Figure 4D). This dramatic water-soaked leaf appearance is similar to that of wild-type leaves that have been frozen (Figures 4A to 4C), although there may not be a mechanistic connection, because the latter is a physical process brought about by ice formation. The translucent leaf phenotype of fro1 was typically found in rosette leaves and sometimes in cauline leaves as well (data not shown).
Figure 4.
Water-Soaked Leaf Phenotype of fro1 Mutant Plants.
(A) Two-week-old wild-type plant grown at 22°C. Bar = 5 mm.
(B) Two-week-old wild-type plant after 4 h of freezing treatment at −10°C followed by 24 h of incubation at 4°C. Bar = 5 mm.
(C) Frozen wild-type leaf magnified from (B). The arrow indicates a water-soaked region of the leaf. Bar = 2 mm.
(D) Three-week-old fro1 mutant plant grown at 22°C. Bar = 5 mm.
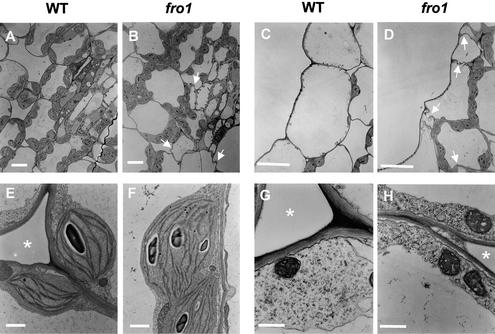
A comparison of leaf cross-sections did not reveal gross structural differences between fro1 and the wild type (Figure 5). However, less turgid and irregularly shaped cells were found frequently in fro1 leaves (Figures 5B and 5D) compared with wild-type leaves (Figures 5A and 5C). Chloroplasts (Figure 5F) and mitochondria (Figure 5H) in fro1 plants did not appear different from those of the wild type (Figures 5E and 5G). Interestingly, cell walls in fro1 were substantially thinner than those in the wild type (Figures 5E to 5H).
Figure 5.
Comparison of Ultrastructure between Wild-Type and fro1 Mutant Plants.
(A), (C), (E), and (G) Wild-type leaves. Chloroplasts (E) and mitochondria (G) are shown.
(B), (D), (F), and (H) fro1 mutant leaves. Chloroplasts (F) and mitochondria (H) are shown.
White arrows indicate the irregular cell shape in fro1. Asterisks indicate intercellular spaces. WT, wild type. Bars = 20 μm for (A) and (B), 10 μm for (C) and (D), 1 μm for (E) and (F), and 0.5 μm for (G) and (H).
fro1 Leaves Are Constitutively Leaky to Cellular Electrolytes and Are Impaired in Cold Acclimation
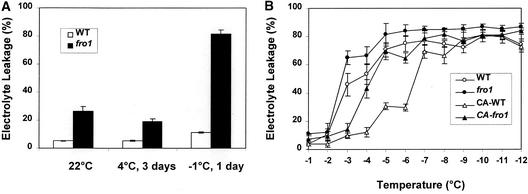
In wild-type leaves that have been frozen, the integrity of membranes is compromised. The electrolyte leakage test (Sukumara and Weiser, 1972; Ristic and Ashworth, 1993) is considered a good indicator of cell membrane integrity. Because the water-soaked appearance of fro1 leaves resembles that of wild-type leaves that have been frozen, we tested whether fro1 leaves are more leaky to electrolytes. Even without any cold treatment, fro1 mutant leaves showed a higher level of electrolyte leakage, as indicated by higher relative conductivity (Figure 6A). After 3 days of incubation at 4°C, electrolyte leakage in detached leaves of the wild type and fro1 was measured. The results indicated that the extent of electrolyte leakage did not change much in either the wild type or fro1. After 1 day of exposure to −1°C, fro1 leaves showed a large increase in electrolyte leakage, whereas wild-type leaves showed a relatively slight increase (Figure 6A). These results indicate that the membrane integrity of fro1 is impaired and that fro1 mutant seedlings are constitutively leaky and hypersensitive to freezing.
Figure 6.
Constitutive Leakiness and Cold Acclimation Defect in fro1 Plants.
(A) Electrolyte leakage in wild-type and fro1 leaves from whole plants without stress or with treatment at 4°C for 3 days or at −1°C for 1 day.
(B) Electrolyte leakage at different temperatures. For cold acclimation, seedlings were incubated under light at 4°C for 2 days before the test.
CA-fro1, cold-acclimated fro1; CA-WT, cold-acclimated wild type; WT, wild type.
Electrolyte leakage at subzero temperatures was investigated with detached leaves from both cold-acclimated and nonacclimated plants (Figure 6B). Without cold acclimation, fro1 leaves showed higher electrolyte leakage over the wild type at all temperatures tested. In nonacclimated plants, the LT50 values were −2.8 and −3.5°C for fro1 and the wild type, respectively. After 2 days of cold acclimation at 4°C, the wild type showed a large increase in freezing tolerance. In comparison, fro1 showed a much smaller increase in freezing tolerance under the same conditions (Figure 6B). The LT50 values for cold-acclimated fro1 and wild-type plants were −4.2 and −6.5°C, respectively. These results confirm that fro1 is more sensitive to freezing and, additionally, is impaired in cold acclimation.
fro1 Shows Constitutive Accumulation of ROS
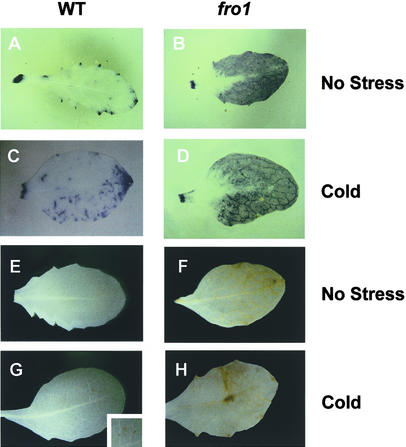
Prasad et al. (1994a) observed an accumulation of hydrogen peroxide when chilling-sensitive maize was exposed to cold conditions (either 14 or 4°C). ROS have been known to cause damage to cellular membranes (Kagan, 1988). It is possible that the membrane leakiness in fro1 is a consequence of oxidative damage. Therefore, the presence of ROS in wild-type and fro1 plants was tested with nitroblue tetrazolium (NBT) staining for superoxide and 3,3′-diaminobenzidine (DAB) staining for hydrogen peroxide. Without stress treatment, wild-type leaves did not show significant NBT staining, suggesting a lack of superoxide (Figure 7A). However, fro1 leaves showed intense NBT staining without any stress treatment, indicating that a high level of superoxide was present in the mutant (Figure 7B).
Figure 7.
Detection of ROS in fro1 Leaves.
(A) and (B) NBT staining for superoxide in unstressed leaves of wild-type (A) and fro1 (B) plants.
(C) and (D) NBT staining for superoxide in cold-treated (4°C for 2 days) leaves of wild-type (C) and fro1 (D) plants. Staining is shown as dark blue.
(E) and (F) DAB staining for hydrogen peroxide in unstressed leaves of wild-type (E) and fro1 (F) plants.
(G) and (H) DAB staining for hydrogen peroxide of cold-treated (4°C for 2 days) leaves of wild-type (G) and fro1 (H) plants. Staining is shown as dark yellow. Dark yellow spots representing DAB staining in the wild type are shown in the inset in (G).
WT, wild type.
After cold treatment, superoxide was detected in both the wild type and fro1, but the level in fro1 was much higher than that in the wild type (Figures 7C and 7D). Similarly, DAB staining showed that without cold treatment, fro1 but not the wild type accumulated hydrogen peroxide (Figures 7E and 7F). After cold treatment, wild-type leaves showed slight DAB staining, whereas fro1 exhibited very substantial staining (Figures 7G and 7H). In control treatments with superoxide dismutase for NBT staining or with ascorbic acid for DAB staining, no staining was detected in the wild type or fro1, suggesting that the staining was ROS specific. These results show that the fro1 mutation causes constitutive accumulation of ROS.
Growth Retardation and Germination Sensitivity to Osmotic Stress in fro1
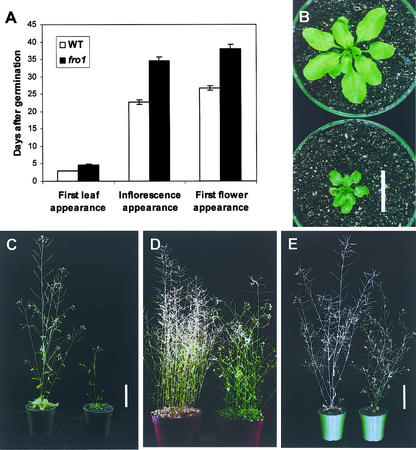
On Murashige and Skoog (1962) (MS) agar medium supplemented with 3% Suc, fro1 seeds germinated ∼1 day later than wild-type seeds. After germination, fro1 plants also grew more slowly than the wild type. First leaf appearance after germination in fro1 took 1.7 more days than in the wild type, and inflorescence and first flower in fro1 also appeared with a significant delay (Figure 8A). fro1 mutant plants were smaller in size than wild-type plants (Figures 8B and 8C). Nevertheless, fro1 plants eventually reached heights similar to those of wild-type plants (Figures 8D and 8E), even though fro1 leaves remained smaller than wild-type leaves. The green color and vigor of fro1 mutant plants lasted longer than those of wild-type plants. Whereas the wild type started to dry at 7 weeks after imbibition, fro1 was still green (Figure 8D) at that time and only began to dry at >8 weeks after imbibition.
Figure 8.
Difference in Growth and Development Rates between Wild-Type and fro1 Mutant Plants.
(A) Difference in organ appearance after germination (n = 10).
(B) Twenty-day-old wild-type (top) and fro1 (bottom) plants. Bar = 2 cm.
(C) Thirty-day-old wild-type (left) and fro1 (right) plants. Bar = 5 cm.
(D) Seven-week-old wild-type (left) and fro1 (right) plants.
(E) Eight-week-old wild-type (left) and fro1 (right) plants. Bar = 5 cm.
WT, wild type.
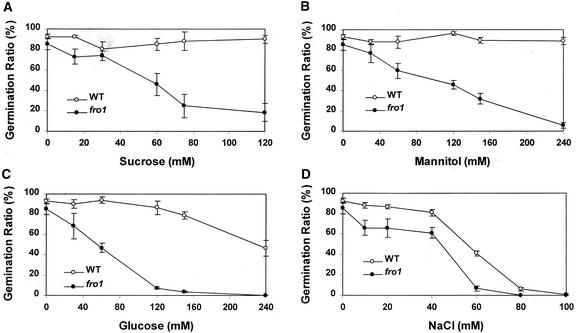
During mutant handling, we noticed that fro1 on MS agar medium supplemented with 3% Suc showed a slightly lower germination rate. When Suc was removed from the medium, the germination rates of the wild type and fro1 were almost the same (data not shown). Because of this observation, we compared fro1 and wild-type seed germination in response to various concentrations of sugars or salt (Figure 9). To avoid potential complications caused by MS agar medium, filter papers were used for the germination test. On control filter papers soaked with water, maximal germination was achieved for both fro1 and the wild type on day 4 after imbibition. Thus, germination rate was scored on day 4 after imbibition. Under our conditions, Suc or mannitol did not affect wild-type germination (Figures 9A and 9B). However, fro1 germination was affected by all of these sugars in a concentration-dependent manner (Figures 9A and 9B), suggesting that the reduced germination rate in fro1 probably was the result of an osmotic effect.
Figure 9.
Effect of Osmotic Stress on Seed Germination in fro1 and the Wild Type.
Germination ratio of the wild type and fro1 on filter papers saturated with different concentrations of Suc (A), mannitol (B), Glc (C), and NaCl (D). A clear appearance of the radicle was considered as germination, which was scored on day 4 after incubation at room temperature. WT, wild type.
Glc at high concentrations reduced wild-type germination, but the effect was much more dramatic on fro1 (Figure 9C). NaCl inhibited both wild-type and fro1 germination, but the inhibition on fro1 was slightly more pronounced (Figure 9D). These observations suggest that fro1 seed germination is more sensitive to inhibition by osmotic stress. We further investigated the osmotic effect on fro1 vegetative growth by monitoring root elongation. Seven-day-old wild-type and fro1 seedlings were transferred onto media containing different concentrations of mannitol. Root growth was measured 4 days later. No difference in root growth was observed between fro1 and the wild type (data not shown).
Isolation of the FRO1 Gene
To isolate the FRO1 gene, a positional cloning strategy was used. fro1 mutant plants in the C24 background were crossed to wild-type plants of the Columbia ecotype. F1 plants from the cross were selfed, and the resulting F2 seeds were collected. A total of 781 fro1 mutants from the F2 population were selected on the basis of its translucent, water-soaked phenotype and used for mapping with simple sequence length polymorphism (SSLP) (Bell and Ecker, 1994) and cleaved amplified polymorphic sequence (Konieczny and Ausubel, 1993) markers. Preliminary mapping results indicated that FRO1 was located at the bottom of chromosome 5. Because molecular markers polymorphic between C24 and Columbia were scarce, new SSLP makers were developed based on simple sequence repeats identified from Arabidopsis genomic sequences within this region.
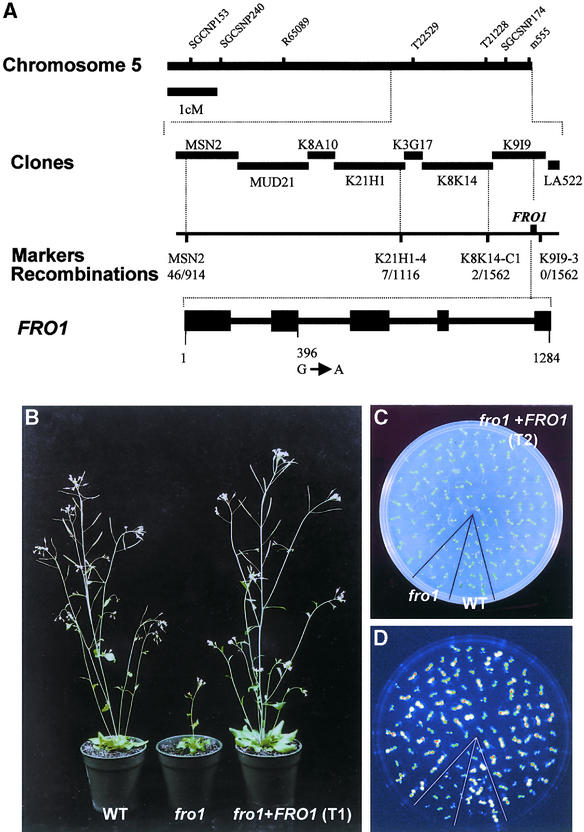
Further mapping with these markers delimited FRO1 to a short region at the lower arm of chromosome 5, south of marker K8K14-C1 (Figure 10A). Because FRO1 showed a very tight linkage to marker K9I9-3, FRO1 very likely was on transformation-competent artificial chromosome clone K9I9. Therefore, clone K9I9 was introduced into fro1 mutant plants via Agrobacterium tumefaciens–mediated in planta transformation (Liu et al., 1999). RD29A::LUC imaging and morphological observations showed that fro1 mutant plants transformed with K9I9 all behaved like the wild type. These results demonstrate that FRO1 is contained within transformation-competent artificial chromosome clone K9I9.
Figure 10.
Map-Based Cloning of FRO1 and Molecular Complementation of fro1 Mutants.
(A) Markers are SSLP markers except for K8K14-C1, which is a cleaved amplified polymorphic sequence marker. The number of recombinant chromosomes/number of total chromosomes examined at each locus is indicated. The FRO1 gene structure was obtained by comparing its cDNA sequence with the genomic sequence. Black boxes indicate exons, and solid lines between boxes indicate introns. The position of the fro1 mutation is indicated. cM, centimorgan.
(B) Morphological comparison between wild type (WT), fro1, and fro1 transformed with FRO1 (fro1+FRO1; T1 generation) at the same developmental stage (5 weeks old).
(C) and (D) Morphology (C) and luminescence (D) of wild-type (WT) and fro1 seedlings of a segregating T2 population from fro1 transformed with FRO1 (fro1+FRO1).
Because K9I9 had been sequenced and annotated, several candidate genes were amplified from fro1 and wild-type plants and sequenced. After sequence analysis, a mutation was found in a hypothetical open reading frame, K9I9.16 (K9I9.10 by Kazusa DNA Research Institute, Japan, at http://www.kazusa.or.jp), which spans from 37,239 to 38,522 bp of K9I9. The mutation is a G-to-A change at an intron-exon junction at nucleotide 396 from the ATG start codon. This mutation is predicted to cause missplicing, which would create a premature stop codon 13 bp downstream from the mutation. This candidate gene (i.e., K9I9.16), along with a 1.6-kb sequence 5′ upstream of the translation start codon and 260 bp of the 3′ untranslated region, was cloned into a binary vector and introduced into fro1 mutant plants. Twelve independent transgenic lines were obtained, and all grew like the wild type (Figure 10B). In the T2 generation, luciferase imaging analysis of cold-treated seedlings revealed the segregation of wild-type and fro1 phenotypes (Figures 10C and 10D). All seedlings showing the wild-type RD29A:: LUC phenotype were found to have the K9I9.16 transgene based on their hygromycin resistance. These results prove that K9I9.16 is the FRO1 gene.
FRO1 Encodes the NADH Dehydrogenase Subunit of Mitochondrial Respiratory Chain Complex I
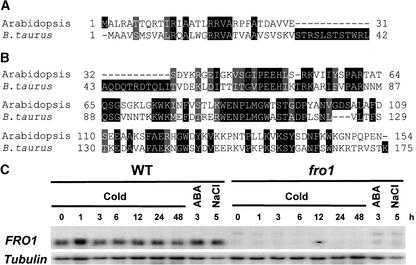
FRO1 cDNA was isolated by reverse transcriptase–mediated PCR. A comparison between the cDNA and genomic sequences revealed four introns and five exons in the FRO1 gene. This experimentally deduced gene structure is the same as the computer-annotated version generated by the Arabidopsis Genome Initiative (Palm et al., 2000). GenBank searches found that FRO1 has high amino acid sequence similarities to the 18-kD Fe-S subunit of mitochondrial respiratory chain complex I (NADH dehydrogenase) from diverse organisms. For example, FRO1 shows 46 to 47% amino acid identity and 63 to 64% similarity to its human and bovine orthologs, respectively. Because the bovine protein has been characterized biochemically and its sequence confirmed by amino acid sequencing (Walker et al., 1992), an alignment is shown between FRO1 and the bovine protein (Figures 11A and 11B). The calculated molecular mass of FRO1 is 17 kD, similar to that of the Fe-S subunit of complex I (18-kD). Hydropathy analysis revealed that FRO1 is highly hydrophilic, with no potential transmembrane domains (data not shown).
Figure 11.
Amino Acid Alignment between FRO1 and Its Homolog from Bos taurus.
(A) and (B) Alignment between predicted mitochondrial targeting sequences (A) and mature proteins after the targeting sequences are cleaved (B). Amino acid sequence alignment was performed with ClustalW (http://dot.imgen.bcm.tmc.edu:9331/multialign/Options/clustalw.html). Identical amino acids are highlighted in black, and conservative substitutions are highlighted in gray.
(C) FRO1 expression in wild-type and fro1 mutant plants. Seedlings were treated with low temperature (0°C) for the indicated times, abscisic acid (100 μM) for 3 h, and NaCl (300 mM) for 5 h. Tubulin was used as a loading control. ABA, abscisic acid; WT, wild type.
RNA gel blot analysis showed that FRO1 expression was constitutive and not regulated substantially by cold, abscisic acid, or NaCl treatment, except for a slight upregulation after 1 h of cold treatment (Figure 11C). Interestingly, no FRO1 transcript could be detected in fro1 mutant plants, suggesting instability of the misspliced mutant mRNA. This lack of FRO1 transcript suggests that fro1 might be a null mutation (Figure 11C).
Like the other known 18-kD Fe-S subunits of complex I, a putative mitochondrial targeting signal peptide was found in FRO1, with a cleavage point between residues 31 and 32, as analyzed by the MitoProt program at http://www.mips.biochem.mpg.de/cgi-bin/proj/medgen/mitofilter (Claros and Vincens, 1996). To confirm FRO1 subcellular localization, FRO1 was fused at its C terminus in frame with the GFP reporter under the control of the double 35S promoter. The construct was introduced into wild-type C24 plants via Agrobacterium-mediated transformation. Stable transgenic plants were obtained and used for FRO1:GFP localization with a confocal microscope.
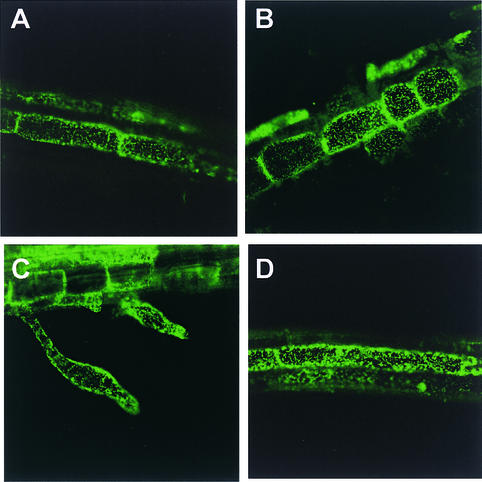
A clear particulate pattern of GFP expression was observed in the FRO1:GFP transgenic Arabidopsis roots (Figure 12). The size of the particles is consistent with that expected of mitochondria. The pattern of GFP subcellular localization in FRO1:GFP transgenic Arabidopsis (Figure 12A) is identical to that of β-ATPase:GFP, which is known to be localized in mitochondria (Figure 12D) (Logan and Leaver, 2000). These results strongly suggest that FRO1 is localized in mitochondria. The subcellular localization of FRO1 did not change under cold treatment (Figures 12B and 12C).
Figure 12.
Subcellular Localization of FRO1:GFP.
(A) to (C) Green fluorescence from root tissues of Arabidopsis plants transformed with FRO1:GFP was detected using a confocal microscope. Before confocal imaging, seedlings were subjected to the following treatments: no stress (A), cold stress at 0°C for 12 h (B), or cold stress at 0°C for 24 h (C).
(D) Green fluorescence from root tissue of mitochondria-targeted Arabidopsis β-ATPase:GFP (Logan and Leaver, 2000) is shown as a positive control.
DISCUSSION
In this study, we identified the fro1 mutation, characterized fro1 mutant phenotypes, cloned the FRO1 gene, and analyzed its expression and the subcellular localization of its gene product. fro1 mutant plants are impaired in cold regulation not only of the RD29A::LUC transgene but also of several endogenous cold-responsive genes, including RD29A, COR47, COR15A, and KIN1. The fact that fro1 reduces the cold induction of RD29A, COR47, COR15A, and KIN1 but not the CBF genes is not surprising, considering that the sfr6 mutation was reported to impair the induction of DRE/CRT-type genes but not the induction of CBF genes (Knight et al., 1999). It is possible that fro1 may affect factors required for the proper function of CBF transcriptional activators. The significance, if any, of the increased induction of the CBF genes at 12 h after cold treatment is unclear at present.
fro1 plants show a translucent, water-soaked appearance, which may be caused by membrane leakiness. fro1 mutant plants are defective in one of the components of complex I of the electron transfer chain in mitochondria. This molecular lesion leads to the accumulation of ROS such as superoxide and hydrogen peroxide, which may be the intermediary signals that alter the cold induction of nuclear genes. Thus, the fro1 mutant provides a novel example of the retrograde regulation of cold-responsive nuclear gene expression by functionally compromised mitochondria.
Plant mitochondria have the same basic electron transfer system as animal cells. The system consists of the following complexes: complex I, NADH dehydrogenase; complex II, succinate dehydrogenase; complex III, cytochrome bc1; complex IV, cytochrome c oxidase. Complex I, the first enzyme, transfers electrons from NADH to ubiquinone. In plants, complex I consists of >35 polypeptides (Leterme and Boutry, 1993), some of which are encoded in mitochondrial DNA. In addition to the common complexes, plant mitochondria have four additional NAD(P)H dehydrogenases (Rasmusson et al., 1998) and an alternative oxidase (Vanlerberghe and McIntosh, 1997). These membrane-bound additional NAD(P)H dehydrogenases and alternative oxidase bypass complex I and complexes III and IV, respectively. As a result, a lower proton electrochemical gradient across the inner membrane would be established if the two alternative electron pathways were used. Nevertheless, the electron transfer system still would be functional. Thus, a defect in complex I in plants is not lethal, as has been shown in other complex I mutant plants (e.g., NMS1; Sabar et al., 2000).
The lower cold induction of the endogenous RD29A in fro1 was not as dramatic as that of the RD29A::LUC transgene. This probably is the result of sequence differences between the endogenous RD29A gene and the transgene. In the hos1 mutant, the endogenous RD29A gene also is not affected as much as the RD29A::LUC transgene (Ishitani et al., 1998). These observations suggest that there might be additional regulatory elements in the endogenous RD29A gene promoter, intron, or untranslated regions, which might be enough to confer some cold responsiveness or transcript stability. In this regard, it is interesting that COR15A and KIN1 were affected more dramatically by fro1 than the endogenous RD29A and COR47 (Figure 3). Perhaps the additional regulatory elements are not present in COR15A and KIN1.
As a result of the defect in complex I, fro1 mutant plants accumulate ROS constitutively. Damage by ROS is dosage dependent. A very high dosage of ROS may cause hypersensitive cell death (Alvarez et al., 1998). However, fro1 mutant plants can complete their life cycle and set a normal number of seeds. Thus, the endogenous ROS level in fro1 is not high enough to cause cell death.
One well-known form of cellular damage caused by ROS is lipid peroxidation in cellular membranes (Kagan, 1988). Phospholipid hydroperoxides, a product of lipid peroxidation, form clusters that can function as channels. As a result, membrane permeability to electrolytes increases (Kagan, 1988). Therefore, the translucent and water-soaked fro1 leaf phenotype may be attributed to increased membrane permeability as a result of lipid peroxidation by ROS. This idea is supported by the electrolyte leakage test, which revealed high relative electric conductivity in fro1 (Figure 6). This damaged membrane integrity may result in the irregular cells found in fro1 leaves (Figure 5). Also, the hypersensitivity to osmotic stress seen in fro1 during seed germination may be caused by its impaired membrane integrity.
Complex I impairments in plants have been reported in the maize NCS2 mutant (Marienfeld and Newton, 1994) and tobacco CMS (cytoplasmic male sterile) I and II mutants (Gutierres et al., 1997). Interestingly, like fro1, the tobacco mutants CMS I and II also showed a slow growth phenotype (Gutierres et al., 1997), and the maize NCS2 mutant displayed a moderate defect in growth (Coe, 1983; Newton and Coe, 1986). fro1 mutant plants, however, are not sterile, as the NCS2 and CMS I/II mutants are. The slow growth is likely a consequence of reduced metabolic activity in fro1. Reduced metabolic activity in the mutant also may be responsible for its apparent delayed senescence and its thinner cell wall. Increased oxidative stress has been correlated with accelerated senescence (Finkel and Holbrook, 2000). Because fro1 has increased levels of ROS, it is an interesting and novel example of the negative correlation between senescence and oxidative stress.
It has been reported that hydrogen peroxide activates ANP1, a mitogen-activated protein kinase kinase kinase (Kovtun et al., 2000). In the Arabidopsis protoplast system, RD29A was not induced by exogenous hydrogen peroxide (Kovtun et al., 2000). Thus, it is possible that the signaling of DRE/CRT genes may not be mediated by the ANP1 pathway. Consistent with this notion, none of the cold-responsive genes tested in this study showed constitutive expression, even though fro1 accumulated high levels of ROS (Figures 3 and 7). Nevertheless, ROS accumulation in fro1 may be responsible for the defect in cold-responsive gene expression.
Cold regulation of gene expression is known to involve calcium signaling (Monroy and Dhindsa, 1995; Knight et al., 1996). Oxidative stress has been shown to affect cytoplasmic calcium signaling (Price et al., 1994). Therefore, it is possible that fro1 alters calcium signaling under low temperatures through ROS. Recently, using C2C12 skeletal myocytes that are defective in mitochondrial DNA or are stressed with respiratory chain inhibitors, Biswas et al. (1999) showed increased basal cytosol Ca2+ levels and altered nuclear gene expression. Exactly how the ROS in fro1 alters cold-activated calcium signaling is not known. Because the ROS could trigger calcium signaling without cold treatment, it may desensitize cells toward the cold-induced calcium signal, thus making the mutant plants less responsive to cold in terms of gene expression.
METHODS
Plant Materials and Growth Conditions
Transgenic Arabidopsis thaliana (ecotype C24) plants expressing the RD29A::LUC transgene (referred to as wild-type herein) were mutagenized by ethyl methanesulfonate to generate M2 seeds. One-week-old M2 seedlings on 0.6% agar plates containing 3% Suc and Murashige and Skoog (1962) (MS) salts (JRH Biosciences, Lenexa, KS) were screened for altered luciferase expression in response to low temperature, abscisic acid, or osmotic stress with a video imaging system composed of a charge-coupled device camera (CCD-512SB; Princeton Instruments, Trenton, NJ), a controller (Princeton Instruments), and a computer with WinView image-processing software (Princeton Instruments). For luminescence image analysis of seedlings, surface-sterilized seeds were plated on MS agar (0.6%) plates supplemented with 3% Suc and placed at room temperature (22 ± 1°C) under continuous light after 2 to 3 days of cold stratification. When appropriate, seedlings were transferred to soil pots and allowed to grow in a growth chamber with cycles of 16 h of light at 22°C and 8 h of dark at 18°C.
Stress Treatments
Stress was applied to 1-week-old wild-type and mutant seedlings grown on the same MS agar plate. For cold treatment, the plates were place at 0°C in the dark for the designated times. For abscisic acid treatment, 100 μM abscisic acid [(±)-cis,trans–abscisic acid; Sigma, St. Louis, MO] dissolved in sterile water was sprayed uniformly on the leaves of the seedlings. Abscisic acid–treated plates were kept at room temperature (22 ± 1°C) under cool-white light for the designated times. For NaCl treatment, seedlings were transferred to filter paper saturated with 300 mM NaCl in MS solution. The seedlings then were incubated under light at room temperature for the designated times. For luminescence imaging, 1 mM luciferin was sprayed evenly onto seedling leaves at the end of each treatment. The luciferin-sprayed plates were kept in the dark for 5 min for chlorophyll fluorescence to decay. Luminescence images were made with a charge-coupled device camera system. Detailed procedures on imaging and screening have been described previously (Xiong et al., 1999; Lee et al., 2002).
RNA Analysis
Nine-day-old seedlings grown on MS agar plates were used for RNA analysis. After stress treatments, total RNA was extracted and analyzed as described previously (Liu and Zhu, 1997). The RD29A-specific probe was from the 3′ noncoding region (Liu and Zhu, 1997). The CBF1, CBF2, and CBF3 (Gilmour et al., 1998) probes were obtained by amplifying a gene-specific region with the following primers: CBF1-F (5′-CGATAGTCGTTTCCATTTTTGT-3′) and CBF1-R (5′-TTGCTAGATTCGAGACGAGCC-3′); CBF2-F (5′-TTCGATTTTTAT-TTCCATTTTTGG-3′) and CBF2-R (5′-CCAAACGTCCTTGAGTCTTGAT-3′); and CBF3-F (5′-GAGGAGCCACGTAGAGGGCC-3′) and CBF3-R (5′-TAAAACTCAGATTATTATTTCCAT-3′). COR15A and COR47 cDNAs (Gilmour et al., 1992; Lin and Thomashow, 1992) were provided by M.F. Thomashow (Michigan State University, East Lansing, MI).
Probe for KIN1 (Kurkela and Franck, 1990) was a 0.4-kb EcoRI fragment of the Arabidopsis EST clone YAP368T7. As a loading control, 25S rRNA, actin2, and β-tubulin gene were amplified by PCR with the following primer pairs: 25S rRNA-F (5′-GGGATTACCCGCTGAGTTTA-3′) and 25S rRNA-R (5′-CGTCTCCACAAGCGTATCAA-3′); Actin-F (5′-TGTCGCCATCCAAGCTGTTCTCT-3′) and Actin-R (5′-CCATCGGGTAATTCATAGTTCTTCTCG-3′); and Tubulin-F (5′-CGT-GGATCACAGCAATACAGAGCC-3′) and Tubulin-R (5′-CCTCCTGCA-CTTCCACTTCGTCTTC-3′).
Microscopic Analysis
Leaves from 3-week-old wild-type and fro1 mutant plants were used to compare their ultrastructure at the transmission electron microscopy facility at the University of Arizona. Fully expanded leaves of wild-type and fro1 plants were fixed in 0.1 M phosphate buffer, pH 7.4, 4% formaldehyde, and 1% glutaraldehyde, postfixed in 1.0% osmium tetroxide, dehydrated in an ethanol series, and embedded in Epon araldite. Sections were observed with a transmission electron microscope (JEOL 100CXII). All procedures were performed according to standard protocols (Hayat, 2000).
For confocal microscopy, FRO1:GFP transgenic seedlings selected on MS agar medium supplemented with 25 mg/L hygromycin were mounted on glass slides, and green fluorescence images were made using a Bio-Rad MRC-1024 confocal laser scanning microscope with a 488-nm excitation laser and a 522/DF35 emission filter.
Electrolyte Leakage Test
The electrolyte leakage test was performed to compare membrane integrity and cold acclimation capability between wild-type and fro1 plants. To investigate potential relationships between the water-soaked leaf phenotype in fro1 and membrane leakage, ∼3-week-old plants of the wild type and fro1 were treated at 4°C for 3 days or at −1°C for 24 h. With 22°C-grown plants of the wild type and fro1 as controls, several rosette leaves from either treated or untreated plants were detached and transferred to tubes with 25 mL of deionized water. The conductivity of the solution was measured after shaking overnight at room temperature.
To evaluate cold acclimation, one fully developed rosette leaf was detached from ∼3-week-old plants and placed immediately into a test tube containing 100 μL of deionized water with only the petiole submerged in water. The tubes were placed in a refrigerated circulator with the temperature preset at 0°C. After 1 h of incubation, ice chips were added to provide ice nuclei in the tubes. The circulator was programmed so that the bath temperature decreased step-wise to −12°C at a rate of 1°C every 30 min. The tubes were removed upon reaching the designated temperatures and were placed on ice immediately to allow gradual thawing. After complete thawing, the leaflet and the solution in the tube were transferred to another tube containing 25 mL of deionized water followed by overnight shaking at room temperature.
After conductivity measurement of the samples, the tubes with the leaflets were autoclaved. After cooling to room temperature, the conductivity of the solution was measured again. The percentage of electrolyte leakage was calculated as the percentage of the conductivity before autoclaving divided by that after autoclaving.
Detection of Reactive Oxygen Species
For superoxide detection, leaves detached from ∼3-week-old plants were vacuum-infiltrated with 0.1 mg/mL nitroblue tetrazolium in 25 mM Hepes buffer, pH 7.6. In a control treatment, 10 mM MnCl2 and 10 units/mL superoxide dismutase were added to the buffer. Samples were incubated at room temperature in the dark for 2 h. For hydrogen peroxide staining, leaves were vacuum-infiltrated with 0.1 mg/mL 3,3′-diaminobenzidine in 50 mM Tris-acetate buffer, pH 5.0. As a control, ascorbic acid at a final concentration of 10 mM was added to the staining medium. Samples were incubated for 24 h at room temperature in the dark. To remove chlorophylls, the stained samples were transferred to 80% ethanol and incubated at 70°C for 10 min. For cold treatment, plants were placed at 4°C for 2 days before staining.
Germination Test
Surface-sterilized seeds were incubated at 4°C for 4 to 5 days to achieve germination uniformity. Then, seeds were planted on filter paper (on a plate) saturated with solutions containing Suc, Glc, mannitol, or NaCl at various concentrations. The plates then were incubated at room temperature under light to allow germination. Germination was scored at day 4. A clear appearance of the radicle was considered as germination.
Positional Cloning
For genetic mapping of the fro1 mutation, fro1 was crossed with the wild type in ecotype Columbia with the glabrous1 mutation. The resulting F1 plants were allowed to self, and F2 seeds were collected. Homozygous fro1 mutations in the segregated F2 population were selected based on their morphological phenotypes. Mapping of the mutation was performed using simple sequence length polymorphism (Bell and Ecker, 1994) or cleaved amplified polymorphic sequence (Konieczny and Ausubel, 1993) markers. Primers for simple sequence length polymorphism markers were as follows: MSN2-F (5′-ACGTAAACGAGTCGCCACGT-3′) and MSN2-R (5′-GTGAGGAGTTTGGTATAGCT-3′); K21H1-4F (5′-AACCCAAGAGAACCTTGT-TT-3′) and K21H1-4R (5′-GATTGGGATTTCTTCCTCAT-3′); and K9I9-3F (5′-TTTGATAACTAATTAAAGGGGAAA-3′) and K9I9-3R (5′-AGCCATAAAAACAGCAATCA-3′). Primers for cleaved amplified polymorphic sequence makers were K8K14-C1F (5′-AAACTAGCACCTGCAAATTAGTATT-3′) and K8K14-C1R (5′-CTTCTTCTTCTT-AAATAGCTCGAAA-3′). The resulting PCR products were digested with HhaI and resolved in a 1% agarose gel.
Plasmid Construction and Plant Transformation
The K9I9 transformation-competent artificial chromosome clone was obtained from ABRC (Columbus, OH) and was used for in planta transformation of fro1 plants. For fro1 single gene complementation, a genomic DNA fragment of FRO1 from 1622 bp upstream of the start codon to 260 bp downstream of the stop codon was amplified by LA Taq polymerase (Takara Shuzo, Shiga, Japan) using K9I9 transformation-competent artificial chromosome DNA as a template with the following primers: K9I9.10FXb (5′-AAATATCTAGAATATACAGAAAGATTGATGTTC-3′) and K9I9.10RH3 (5′-ATAATAAGC-TTCTCTCTTTCATAATCCAATCAC-3′). The resulting 3178-bp fragment was T-A cloned into the pBluescript II SK− EcoRV site and then subcloned into pCAMBIA1200 between the XbaI and HindIII sites, resulting in pCAMFRO1g23.
To make the FRO1:GFP construct, FRO1 cDNA was isolated by reverse transcriptase–mediated PCR. Total RNA prepared by Trizol (Life Technologies, Rockville, MD) was used to synthesize the first strand using SuperScript II (Life Technologies) with a poly-T primer, T7PtxbaI (5′-GCTCTAGATAATACGACTCACTATAGGGTTTTTTTTTTTT-3′). First-strand cDNA diluted 20 times was used for amplification of the FRO1 open reading frame using the following primer pair K9I9.10C1F (5′-AATTTTCCAGATTTCTCTAATTGACGATGG-3′) and K9I9.10C1R (5′-GGAAGAAGGTGTAACATCAGTTTTCTGG-3′). The amplified fragment was subcloned into the pBluescript II SK EcoRV site, resulting in pBS2SK-T-FRO1c5.
Using pBS2SK-T-FRO1c5 as a template, the FRO1 coding region was amplified with LA Taq polymerase to make the GFP fusion construct. The primers used for the amplification were FRO1cNcoIF (5′-CTAATTGACCATGGCGCTTCGTGCTACTACTC-3′) and FRO1cNcoIR (5′-TAAGAAGGTGTCCATGGCGTTTTCTGGTTG-3′). The resulting fragment was subcloned into the pBluescript II SK EcoRV site, resulting in pBS2SK-T-FRO1cNcoI4. The FRO1 coding region then was isolated from pBS2SK-T-FRO1cNcoI4 with NcoI treatment. The NcoI fragment was cloned into the pAVA393 NcoI site (von Arnim et al., 1998), resulting in pAVA393-FRO1c5NcoI4. Insert direction was checked by PCR using the 35S promoter–specific primer pAVA35S-F (5′-CTCCACTGACGTAAGGGATGAC-3′) and the FRO1cNcoIR primer. The HindIII and BglII fragments of pAVA393-FRO1c5NcoI4 were cloned into the HindIII and BglII sites of pCAMBIA1390, resulting in pCAMBIA1390-FRO1c5NcoI4-27.
All binary vectors for plant transformation were transferred to Agrobacterium tumefaciens GV3101 (pMP90) by electroporation at 1250 V with capacitance of 25 μF and resistance of 400 Ω. After appropriate antibiotic selection and PCR confirmation, selected Agrobacterium was grown at 28°C in Luria-Bertani medium (1% [w/v] bacto-tryptone, 0.5% [w/v] bacto-yeast extract, and 1% [w/v] NaCl, pH 7.0) or YEB (5% [w/v] meat extract, 1% [w/v] bacto-yeast extract, 5% [w/v] peptone, 5% [w/v] Suc, and 10 mM MgSO4, pH 7.4) overnight and then used for in planta floral vacuum infiltration.
Accession Numbers
The accession numbers for the FRO1 orthologs mentioned in this article are NP_002486.1 (human) and Q02375 (Bos taurus).
Acknowledgments
We thank Becky Stevenson and Mike Dellinger for excellent technical assistance, Robert McDaniel for helpful advice, Albrecht von Arnim at the University of Tennessee for providing the pAVA393 vector, Csaba Konz at the Max Plank Institute for providing Agrobacterium GV3101 cells, and David C. Logan at the University of Oxford for providing Arabidopsis β-ATPase:GFP seeds. This work was supported by U.S. Department of Agriculture National Research Initiative Grant 2000-00664 and National Science Foundation Grant IBN-9808398 to J.-K.Z.
Article, publication date, and citation information can be found at www.plantcell.org/cgi/doi/10.1105/tpc.010433.
References
- Alvarez, M.E., Pennell, R.I., Meijer, P.J., Ishikawa, A., Dixon, R.A., and Lamb, C. (1998). Reactive oxygen intermediates mediate a systemic signal network in the establishment of plant immunity. Cell 92, 773–784. [DOI] [PubMed] [Google Scholar]
- Artus, N.N., Uemura, M., Steponkus, P.L., Gilmour, S.J., Lin, C.T., and Thomashow, M.F. (1996). Constitutive expression of the cold-regulated Arabidopsis thaliana COR15a gene affects both chloroplast and protoplast freezing tolerance. Proc. Natl. Acad. Sci. USA 93, 13404–13409. [DOI] [PMC free article] [PubMed] [Google Scholar]
- Baker, S.S., Wilhelm, K.S., and Thomashow, M.F. (1994). The 5′-region of Arabidopsis thaliana COR15a has cis-acting elements that confer cold-regulated, drought-regulated and ABA-regulated gene expression. Plant Mol. Biol. 24, 701–713. [DOI] [PubMed] [Google Scholar]
- Bell, C.J., and Ecker, J.R. (1994). Assignment of 30 microsatellite loci to the linkage map of Arabidopsis. Genomics 19, 137–144. [DOI] [PubMed] [Google Scholar]
- Biswas, G., Adebanjo, O.A., Freedman, B.D., Anandatheerthavarada, H.K., Vijayasarathy, C., Zaidi, M., Kotlikoff, M., and Avadhani, N.G. (1999). Retrograde Ca2+ signaling in C2C12 skeletal myocytes in response to mitochondrial genetic and metabolic stress: A novel mode of inter-organelle crosstalk. EMBO J. 18, 522–533. [DOI] [PMC free article] [PubMed] [Google Scholar]
- Claros, M.G., and Vincens, P. (1996). Computational method to predict mitochondrially imported proteins and their targeting sequences. Eur. J. Biochem. 241, 779–786. [DOI] [PubMed] [Google Scholar]
- Coe, E.H. (1983). Maternally inherited abnormal plant types in maize. Maydica 28, 151–167. [Google Scholar]
- De Santis, A., Landi, P., and Genchi, G. (1999). Changes of mitochondrial properties in maize seedlings associated with selection for germination at low temperature: Fatty acid composition, cytochrome c oxidase, and adenine nucleotide translocase activities. Plant Physiol. 119, 743–754. [DOI] [PMC free article] [PubMed] [Google Scholar]
- Finkel, T., and Holbrook, N.J. (2000). Oxidants, oxidative stress and the biology of ageing. Nature 408, 239–247. [DOI] [PubMed] [Google Scholar]
- Gilmour, S.J., Artus, N.N., and Thomashow, M.F. (1992). cDNA sequence analysis and expression of two cold-regulated genes of Arabidopsis thaliana. Plant Mol. Biol. 18, 13–21. [DOI] [PubMed] [Google Scholar]
- Gilmour, S.J., Zarka, D.G., Stockinger, E.J., Salazar, M.P., Houghton, J.M., and Thomashow, M.F. (1998). Low temperature regulation of the Arabidopsis CBF family of AP2 transcriptional activators as an early step in cold-induced COR gene expression. Plant J. 16, 433–442. [DOI] [PubMed] [Google Scholar]
- Gonzalez-Meler, M.A., Ribas-Carbo, M., Giles, L., and Siedow, J.N. (1999). The effect of growth and measurement temperature on the activity of the alternative respiratory pathway. Plant Physiol. 120, 765–772. [DOI] [PMC free article] [PubMed] [Google Scholar]
- Gutierres, S., Sabar, M., Lelandais, C., Chetrit, P., Diolez, P., Degand, H., Boutry, M., Vedel, F., de Kouchkovsky, Y., and De Paepe, R. (1997). Lack of mitochondrial and nuclear-encoded subunits of complex I and alteration of the respiratory chain in Nicotiana sylvestris mitochondrial deletion mutants. Proc. Natl. Acad. Sci. USA 94, 3436–3441. [DOI] [PMC free article] [PubMed] [Google Scholar]
- Guy, C.L. (1990). Cold acclimation and freezing stress tolerance: Role of protein metabolism. Annu. Rev. Plant Physiol. Plant Mol. Biol. 41, 187–223. [Google Scholar]
- Hayat, M.A. (2000). Principles and Techniques of Electron Microscopy: Biological Applications. (New York: Cambridge University Press).
- Huq, S., and Palmer, J.M. (1978). Superoxide and hydrogen peroxide production in cyanide resistant Arum maculatum mitochondria. Plant Sci. Lett. 11, 351–358. [Google Scholar]
- Ishitani, M., Xiong, L., Lee, H.J., Stevenson, B., and Zhu, J.K. (1998). HOS1, a genetic locus involved in cold-responsive gene expression in Arabidopsis. Plant Cell 10, 1151–1161. [DOI] [PMC free article] [PubMed] [Google Scholar]
- Ishitani, M., Xiong, L., Stevenson, B., and Zhu, J.K. (1997). Genetic analysis of osmotic and cold stress signal transduction in Arabidopsis: Interactions and convergence of abscisic acid–dependent and abscisic acid–independent pathways. Plant Cell 9, 1935–1949. [DOI] [PMC free article] [PubMed] [Google Scholar]
- Jaglo-Ottosen, K.R., Gilmour, S.J., Zarka, D.G., Schabenberger, O., and Thomashow, M.F. (1998). Arabidopsis CBF1 overexpression induces COR genes and enhances freezing tolerance. Science 280, 104–106. [DOI] [PubMed] [Google Scholar]
- Jia, Y.K., Rothermel, B., Thornton, J., and Butow, R.A. (1997). A basic helix-loop-helix-leucine zipper transcription complex in yeast functions in a signaling pathway from mitochondria to the nucleus. Mol. Cell. Biol. 17, 1110–1117. [DOI] [PMC free article] [PubMed] [Google Scholar]
- Kagan, V.E. (1988). Lipid Peroxidation in Biomembranes. (Boca Raton, FL: CRC Press).
- Knight, H., Trewavas, A.J., and Knight, M.R. (1996). Cold calcium signaling in Arabidopsis involves two cellular pools and a change in calcium signature after acclimation. Plant Cell 8, 489–503. [DOI] [PMC free article] [PubMed] [Google Scholar]
- Knight, H., Veale, E.L., Warren, G.J., and Knight, M.R. (1999). The sfr6 mutation in Arabidopsis suppresses low-temperature induction of genes dependent on the CRT/DRE sequence motif. Plant Cell 11, 875–886. [DOI] [PMC free article] [PubMed] [Google Scholar]
- Konieczny, A., and Ausubel, F.M. (1993). A procedure for mapping Arabidopsis mutations using codominant ecotype specific PCR based markers. Plant J. 4, 403–410. [DOI] [PubMed] [Google Scholar]
- Kovtun, Y., Chiu, W.L., Tena, G., and Sheen, J. (2000). Functional analysis of oxidative stress-activated mitogen-activated protein kinase cascade in plants. Proc. Natl. Acad. Sci. USA 97, 2940–2945. [DOI] [PMC free article] [PubMed] [Google Scholar]
- Kurkela, S., and Franck, M. (1990). Cloning and characterization of a cold- and ABA-inducible Arabidopsis gene. Plant Mol. Biol. 15, 137–144. [DOI] [PubMed] [Google Scholar]
- Lee, B.-h., Stevenson, B., and Zhu, J.K. (2002). High-throughput screening of Arabidopsis mutants with deregulated stress-responsive luciferase gene expression using a CCD camera. In Luminescence Biotechnology: Instruments and Applications, K. Van Dyke, C. Van Dyke, and K. Woodfork, eds (Boca Raton, FL: CRC Press), pp. 557–564.
- Leterme, S., and Boutry, M. (1993). Purification and preliminary characterization of mitochondrial complex I (NADH:ubiquinone reductase) from broad bean (Vicia faba L.). Plant Physiol. 102, 435–443. [DOI] [PMC free article] [PubMed] [Google Scholar]
- Levitt, J. (1980). Responses of Plants to Environmental Stress, Vol. 1: Chilling, Freezing, and High Temperature Stress. (New York: Academic Press).
- Liao, X.S., and Butow, R.A. (1993). RTG1 and RTG2: Two yeast genes required for a novel path of communication from mitochondria to the nucleus. Cell 72, 61–71. [DOI] [PubMed] [Google Scholar]
- Liao, X.S., Small, W.C., Srere, P.A., and Butow, R.A. (1991). Intramitochondrial functions regulate nonmitochondrial citrate synthase (CIT2) expression in Saccharomyces cerevisiae. Mol. Cell. Biol. 11, 38–46. [DOI] [PMC free article] [PubMed] [Google Scholar]
- Lin, C.T., and Thomashow, M.F. (1992). DNA sequence analysis of a complementary DNA for cold-regulated Arabidopsis gene Cor15 and characterization of the Cor15 polypeptide. Plant Physiol. 99, 519–525. [DOI] [PMC free article] [PubMed] [Google Scholar]
- Liu, J., and Zhu, J.K. (1997). Proline accumulation and salt-stress-induced gene expression in a salt-hypersensitive mutant of Arabidopsis. Plant Physiol. 114, 591–596. [DOI] [PMC free article] [PubMed] [Google Scholar]
- Liu, Q., Kasuga, M., Sakuma, Y., Abe, H., Miura, S., Yamaguchi-Shinozaki, K., and Shinozaki, K. (1998). Two transcription factors, DREB1 and DREB2, with an EREBP/AP2 DNA binding domain separate two cellular signal transduction pathways in drought- and low-temperature-responsive gene expression, respectively, in Arabidopsis. Plant Cell 10, 1391–1406. [DOI] [PMC free article] [PubMed] [Google Scholar]
- Liu, Y.G., Shirano, Y., Fukaki, H., Yanai, Y., Tasaka, M., Tabata, S., and Shibata, D. (1999). Complementation of plant mutants with large genomic DNA fragments by a transformation-competent artificial chromosome vector accelerates positional cloning. Proc. Natl. Acad. Sci. USA 96, 6535–6540. [DOI] [PMC free article] [PubMed] [Google Scholar]
- Logan, D.C., and Leaver, C.J. (2000). Mitochondria-targeted GFP highlights the heterogeneity of mitochondrial shape, size and movement within living plant cells. J. Exp. Bot. 51, 865–871. [PubMed] [Google Scholar]
- Lynch, D.V., and Steponkus, P.L. (1987). Plasma membrane lipid alterations associated with cold acclimation of winter rye seedlings (Secale cereale L. cv Puma). Plant Physiol. 83, 761–767. [DOI] [PMC free article] [PubMed] [Google Scholar]
- Lyons, J.M., and Raison, J.K. (1970). Oxidative activity of mitochondria isolated from plant tissues sensitive and resistant to chilling injury. Plant Physiol. 45, 386–389. [DOI] [PMC free article] [PubMed] [Google Scholar]
- Mackenzie, S., and McIntosh, L. (1999). Higher plant mitochondria. Plant Cell 11, 571–585. [DOI] [PMC free article] [PubMed] [Google Scholar]
- Marienfeld, J.R., and Newton, K.J. (1994). The maize NCS2 abnormal growth mutant has a chimeric nad4-nad7 mitochondrial gene and is associated with reduced complex I function. Genetics 138, 855–863. [DOI] [PMC free article] [PubMed] [Google Scholar]
- Miquel, M., James, D., Dooner, H., and Browse, J. (1993). Arabidopsis requires polyunsaturated lipids for low-temperature survival. Proc. Natl. Acad. Sci. USA 90, 6208–6212. [DOI] [PMC free article] [PubMed] [Google Scholar]
- Monroy, A.F., and Dhindsa, R.S. (1995). Low-temperature signal transduction: Induction of cold acclimation-specific genes of alfalfa by calcium at 25 degrees C. Plant Cell 7, 321–331. [DOI] [PMC free article] [PubMed] [Google Scholar]
- Murashige, T., and Skoog, F. (1962). A revised medium for rapid growth and bioassays with tobacco tissue culture. Physiol. Plant. 15, 473–497. [Google Scholar]
- Newton, K.J., and Coe, E.H. (1986). Mitochondrial DNA changes in abnormal growth (nonchromosomal stripe) mutants of maize. Proc. Natl. Acad. Sci. USA 83, 7363–7366. [DOI] [PMC free article] [PubMed] [Google Scholar]
- Palm, C.J., Federspiel, N.A., and Davis, R.W. (2000). DAtA: Database of Arabidopsis thaliana annotation. Nucleic Acids Res. 28, 102–103. [DOI] [PMC free article] [PubMed] [Google Scholar]
- Parikh, V.S., Conradwebb, H., Docherty, R., and Butow, R.A. (1989). Interaction between the yeast mitochondrial and nuclear genomes influences the abundance of novel transcripts derived from the spacer region of the nuclear ribosomal DNA repeat. Mol. Cell. Biol. 9, 1897–1907. [DOI] [PMC free article] [PubMed] [Google Scholar]
- Parikh, V.S., Morgan, M.M., Scott, R., Clements, L.S., and Butow, R.A. (1987). The mitochondrial genotype can influence nuclear gene expression in yeast. Science 235, 576–580. [DOI] [PubMed] [Google Scholar]
- Prasad, T.K., Anderson, M.D., Martin, B.A., and Stewart, C.R. (1994. a). Evidence for chilling-induced oxidative stress in maize seedlings and a regulatory role for hydrogen peroxide. Plant Cell 6, 65–74. [DOI] [PMC free article] [PubMed] [Google Scholar]
- Prasad, T.K., Anderson, M.D., and Stewart, C.R. (1994. b). Acclimation, hydrogen peroxide, and abscisic acid protect mitochondria against irreversible chilling injury in maize seedlings. Plant Physiol. 105, 619–627. [DOI] [PMC free article] [PubMed] [Google Scholar]
- Prasad, T.K., Anderson, M.D., and Stewart, C.R. (1995). Localization and characterization of peroxidases in the mitochondria of chilling-acclimated maize seedlings. Plant Physiol. 108, 1597–1605. [DOI] [PMC free article] [PubMed] [Google Scholar]
- Price, A.H., Taylor, A., Ripley, S.J., Griffiths, A., Trewavas, A.J., and Knight, M.R. (1994). Oxidative signals in tobacco increase cytosolic calcium. Plant Cell 6, 1301–1310. [DOI] [PMC free article] [PubMed] [Google Scholar]
- Rasmusson, A.G., Heiser, V., Zabaleta, E., Brennicke, A., and Grohmann, L. (1998). Physiological, biochemical and molecular aspects of mitochondrial complex I in plants. Bioenergetics 1364, 101–111. [DOI] [PubMed] [Google Scholar]
- Rich, P.R., Boveris, A., Bonner, W.D., and Moore, A.L. (1976). Hydrogen peroxide generation by alternate oxidase of higher plants. Biochem. Biophys. Res. Commun. 71, 695–703. [DOI] [PubMed] [Google Scholar]
- Ristic, Z., and Ashworth, E.N. (1993). Changes in leaf ultrastructure and carbohydrates in Arabidopsis thaliana L (Heynh) cv. Columbia during rapid cold acclimation. Protoplasma 172, 111–123. [Google Scholar]
- Sabar, M., De Paepe, R., and de Kouchkovsky, Y. (2000). Complex I impairment, respiratory compensations, and photosynthetic decrease in nuclear and mitochondrial male sterile mutants of Nicotiana sylvestris. Plant Physiol. 124, 1239–1249. [DOI] [PMC free article] [PubMed] [Google Scholar]
- Saltveit, M.E., Jr., and Morris, L.L. (1990). Overview on chilling injury of horticultural crops. In Chilling Injury of Horticultural Crops, C.Y. Wang, ed (Boca Raton, FL: CRC Press), pp. 3–15.
- Steponkus, P.L., Uemura, M., Joseph, R.A., Gilmour, S.J., and Thomashow, M.F. (1998). Mode of action of the COR15a gene on the freezing tolerance of Arabidopsis thaliana. Proc. Natl. Acad. Sci. USA 95, 14570–14575. [DOI] [PMC free article] [PubMed] [Google Scholar]
- Stockinger, E.J., Gilmour, S.J., and Thomashow, M.F. (1997). Arabidopsis thaliana CBF1 encodes an AP2 domain-containing transcriptional activator that binds to the C-repeat/DRE, a cis-acting DNA regulatory element that stimulates transcription in response to low temperature and water deficit. Proc. Natl. Acad. Sci. USA 94, 1035–1040. [DOI] [PMC free article] [PubMed] [Google Scholar]
- Strand, A., Hurry, V., Gustafsson, P., and Gardestrom, P. (1997). Development of Arabidopsis thaliana leaves at low temperatures releases the suppression of photosynthesis and photosynthetic gene expression despite the accumulation of soluble carbohydrates. Plant J. 12, 605–614. [DOI] [PubMed] [Google Scholar]
- Sukumara, N.P., and Weiser, C.J. (1972). Freezing injury in potato leaves. Plant Physiol. 50, 564–567. [DOI] [PMC free article] [PubMed] [Google Scholar]
- Thomashow, M.F. (1994). Arabidopsis thaliana as a model for studying mechanisms of plant cold tolerance. In Arabidopsis, E.M. Meyerowitz and C.R. Somerville, eds (Cold Spring Harbor, NY: Cold Spring Harbor Laboratory Press), pp. 807–834.
- Thomashow, M.F. (1999). Plant cold acclimation: Freezing tolerance genes and regulatory mechanisms. Annu. Rev. Plant Physiol. Plant Mol. Biol. 50, 571–599. [DOI] [PubMed] [Google Scholar]
- Vanlerberghe, G.C., and McIntosh, L. (1997). Alternative oxidase: From gene to function. Annu. Rev. Plant Physiol. Plant Mol. Biol. 48, 703–734. [DOI] [PubMed] [Google Scholar]
- von Arnim, A.G., Deng, X.W., and Stacey, M.G. (1998). Cloning vectors for the expression of green fluorescent protein fusion proteins in transgenic plants. Gene 221, 35–43. [DOI] [PubMed] [Google Scholar]
- Walker, J.E., Arizmendi, J.M., Dupuis, A., Fearnley, I.M., Finel, M., Medd, S.M., Pilkington, S.J., Runswick, M.J., and Skehel, J.M. (1992). Sequences of 20 subunits of NADH:ubiquinone oxidoreductase from bovine heart mitochondria: Application of a novel strategy for sequencing proteins using the polymerase chain reaction. J. Mol. Biol. 226, 1051–1072. [DOI] [PubMed] [Google Scholar]
- Xiong, L.M., David, L., Stevenson, B., and Zhu, J.K. (1999). High throughput screening of signal transduction mutants with luciferase imaging. Plant Mol. Biol. Rep. 17, 159–170. [Google Scholar]
- Yamaguchi-Shinozaki, K., and Shinozaki, K. (1993). Characterization of the expression of a desiccation-responsive rd29 gene of Arabidopsis thaliana and analysis of its promoter in transgenic plants. Mol. Gen. Genet. 236, 331–340. [DOI] [PubMed] [Google Scholar]
- Yamaguchi-Shinozaki, K., and Shinozaki, K. (1994). A novel cis-acting element in an Arabidopsis gene is involved in responsiveness to drought, low-temperature, or high-salt stress. Plant Cell 6, 251–264. [DOI] [PMC free article] [PubMed] [Google Scholar]


