Abstract
Recent theoretical work suggests that protein folding involves an ensemble of pathways on a rugged energy landscape. We provide direct evidence for heterogeneous folding pathways from single-molecule studies, facilitated by a recently developed immobilization technique. Individual fluorophore-labeled molecules of the protein adenylate kinase were trapped within surface-tethered lipid vesicles, thereby allowing spatial restriction without inducing any spurious interactions with the environment, which often occur when using direct surface-linking techniques. The conformational fluctuations of these protein molecules, prepared at the thermodynamic midtransition point, were studied by using fluorescence resonance energy transfer between two specifically attached labels. Folding and unfolding transitions appeared in experimental time traces as correlated steps in donor and acceptor fluorescence intensity. The size of the steps, in fluorescence resonance energy transfer efficiency units, shows a very broad distribution. This distribution peaks at a relatively low value, indicating a preference for small-step motion on the energy landscape. The time scale of the transitions is also distributed, and although many transitions are too fast to be time-resolved here, the slowest ones may take >1 sec to complete. These extremely slow changes during the folding of single molecules highlight the possible importance of correlated, non-Markovian conformational dynamics.
How do proteins spontaneously find their native structure? Some 40 years after this question was first posed by Anfinsen et al. (1), it is still the subject of intense research. Current theoretical understanding of the folding reaction stresses the role of competing interactions in the formation of a complex and rugged energy landscape (2–6). The stabilizing effect of native contacts confers an overall downhill gradient to the energy landscape, forming a funnel-shaped surface. It is predicted that a protein on such a surface may fold via a number of available pathways. Some experimental support for heterogeneous folding comes from fast kinetic experiments, where folding reactions initiated by a temperature jump (7, 8) or optical triggering (9) show nonexponential kinetics, sometimes highly dependent on initial conditions. Further evidence of multiple folding pathways is offered by kinetic partitioning (10), i.e., the separation of the ensemble of molecules into fast and slow folders, as has been seen experimentally in the case of lysozyme (11). It has been suggested that single-molecule experiments, where individual folding trajectories are measured, can provide direct evidence for heterogeneous folding (12). It is the purpose of this article to present an experimental realization of this idea.
In principle, reversible folding/unfolding transitions of single protein molecules can be studied at equilibrium. One should be able to choose experimental conditions under which each protein molecule spends (on the average) an equal amount of time on the two sides of the folding barrier. For a strictly two-state folder this happens at the thermodynamic midtransition. The choice of a suitable observable allows for the motion of the protein on its energy landscape to be followed in real time. A few recent studies have used fluorescence resonance energy transfer (FRET) as a distance probe to look at protein folding on a single-molecule level. Weiss and coworkers (13) studied the folding of chymotrypsin inhibitor 2 by allowing protein molecules, prepared in the presence of a chemical denaturant, to diffuse in and out of a probing laser beam. Subpopulations of folded and unfolded molecules were clearly resolved in this experiment, and their relative contributions under varied denaturant concentrations matched the ensemble denaturation curve. The short (≈1-msec) residence time of each molecule in the beam did not allow for the measurement of temporal trajectories. Hochstrasser and coworkers (14, 15) chemically tethered a 20-mer polypeptide to a glass surface, making it possible to obtain temporal trajectories of individual molecules. Correlation analysis of the single-molecule trajectories showed that the ensemble kinetics could be reproduced, although it was noted that interaction with the surface significantly altered the properties of the unfolded state. Eaton and coworkers (16) used the technique of Weiss and coworkers to obtain a detailed picture of the folded and unfolded distributions of a cold-shock protein. They analyzed the width of these distributions to extract limits on polypeptide-reconfiguration times and calculate limits on the free-energy barrier to folding.
These experiments bring to light one of the major challenges to single-molecule protein-folding studies, namely to find a way to restrict the molecules spatially such that temporal folding trajectories can be measured without modifying the conformational dynamics of the protein. We recently developed an immobilization method that overcomes this problem. This method enables us to watch individual protein molecules, unperturbed by surface effects, as they fold and unfold over periods of many seconds.
Our method involves trapping single protein molecules in surface-tethered unilamellar lipid vesicles (17). The vesicles are large enough (≈120 nm in diameter) to allow encapsulated protein molecules to diffuse freely within them. Yet because the vesicles are immobilized to the surface, the proteins remain localized within the illuminating laser beam such that it is possible to follow their folding over time.
The vesicle-encapsulation technique is used here to allow for the study of guanidine hydrochloride (Gdn⋅HCl)-facilitated folding and unfolding of adenylate kinase (AK). AK is a 214-aa protein, the bulk folding reaction of which has been studied by several groups (18–21). The equilibrium unfolding of this protein deviates from a simple two-state behavior, as evidenced by variations between equilibrium traces obtained with different methods (intrinsic fluorescence, circular dichroism, 8-anilino-1-naphthalene sulfonate binding, and FRET between different pairs of sites). Kinetic studies further point to the occurrence of at least one intermediate state in the folding reaction of AK (19, 21). In the current study we monitored the folding fluctuations of AK from Escherichia coli (22) using FRET between probes located in the core domain of the enzyme.
Materials and Methods
Samples.
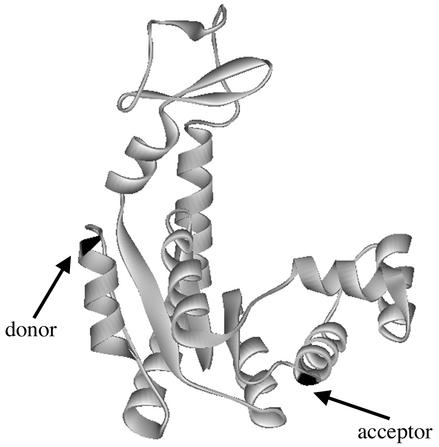
Cysteine residues were inserted at positions 73 and 203 (Fig. 1, marked with arrows) in the mutant C77A of AK from E. coli (20). Fluorescence labeling was carried out in two steps following procedures described (20) and leading to molecules specifically labeled with the acceptor fluorophore (Texas red C2 maleimide, Molecular Probes) at position 73 and the donor fluorophore (Alexa Fluor 488 C5 maleimide, Molecular Probes) at position 203. Vesicles were prepared as described (17). AK molecules at a concentration of 3 μM were included in the hydration buffer, ensuring less than one molecule per vesicle on the average. The vesicles were separated from unencapsulated protein on a Sepharose 2B gel-filtration column. The vesicles then were tethered to a lipid membrane supported on a glass coverslip by using biotin–avidin chemistry (17).
Figure 1.
Ribbon representation of the structure of AK from E. coli (22). Positions 73 and 203 (labeled by acceptor and donor fluorophores, respectively) are marked with arrows.
Spectroscopy.
All measurements were done by using a home-built sample-scanning confocal microscope as described in detail in ref. 17. Individual AK molecules trapped in lipid vesicles were excited with a 488-nm laser beam. The laser intensity was kept very low (300 nW) to increase the life of the fluorophores. For fluorescence polarization studies, donor-only-labeled AK was excited with circularly polarized light, and its emission was split by a cube polarizer into vertical (IV) and horizontal (IH) components, detected with two avalanche photodiodes. The fluorescence polarization, P, was calculated by using P = (IV − IH)/(IV + IH). For FRET studies, a dichroic mirror (565DCLP, Chroma Technology, Brattleboro, VT) was used to separate the fluorescence signals emitted by the donor and acceptor. Bandpass filters (D535/40 for donor and D620/60 for acceptor, both from Chroma Technology) positioned in front of the detectors ensured minimal cross talk between the two channels. The data were corrected for a small leak of donor signal into the acceptor channel, and FRET efficiency (EET) values were calculated according to EET = IA/(IA + ηID), where IA and ID are the acceptor and donor intensities, respectively, and η is a correction factor that depends on the quantum yields of the donor and the acceptor and on the detection efficiencies of the two channels. η was obtained directly from single-molecule data by comparing donor intensities before and after acceptor photobleaching events.
Results and Discussion
Polarization Studies of AK Molecules Trapped in Vesicles.
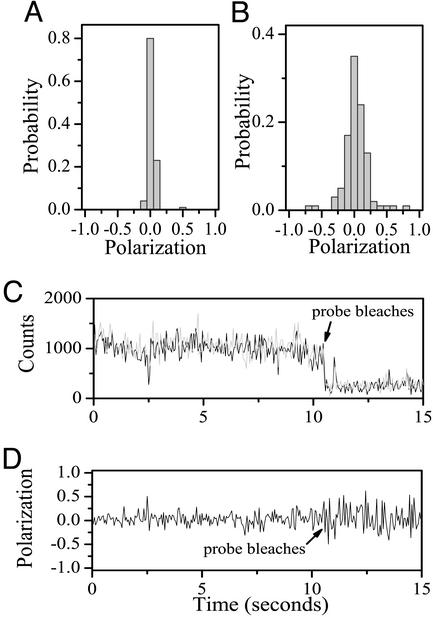
Our initial experiments focused on using polarization spectroscopy to confirm that AK molecules immobilized within lipid vesicles, particularly under partially denaturing conditions, were not interacting significantly with vesicular walls and thus were able to freely diffuse and orient inside the vesicles. To test this, we measured the distribution of fluorescence polarization values of single vesicle-encapsulated AK molecules labeled with the donor only after excitation with circularly polarized light. As described in detail in ref. 17, a very narrow polarization distribution is indicative of unhindered rotational motion of the molecules within the vesicles, because it shows that the molecules randomize their orientation between consecutive photon-emission events. The polarization distributions for both labeled AK under native conditions (data not shown) and labeled AK in 0.4 M Gdn⋅HCl (Fig. 2A) were extremely narrow when compared with labeled AK adsorbed to glass (Fig. 2B), thereby confirming that the vesicle-trapped AK molecules reside in the water compartment of the liposomes and are free to diffuse and rotate. Furthermore, slow polarization changes, which might have indicated interaction of the molecules with the vesicular walls, were not observed in single-molecule trajectories (Fig. 2 C and D).
Figure 2.
(A and B) Distributions of average fluorescence polarization values of single AK molecules labeled with the donor only obtained after excitation with circularly polarized light. The distribution shown in A is for molecules trapped in vesicles at 0.4 M Gdn⋅HCl, and the one shown in B is for molecules adsorbed directly on glass. The very narrow width of the polarization distributions of vesicle-trapped molecules, compared with the width of the distribution of glass-adsorbed molecules, indicates freedom of rotation of the trapped molecules, as discussed in detail by Boukobza et al. (17). A similar experiment performed with acceptor-labeled AK molecules and showing analogous results was presented in that article. The polarization distribution of molecules trapped in vesicles under native conditions (data not shown) is indistinguishable from the one shown in A. (C) A typical time-dependent fluorescence polarization trajectory of a single AK molecule labeled with the donor only and trapped in a lipid vesicle. The vertically polarized (IV) and horizontally polarized (IH) components of the fluorescence are shown in gray and black, respectively. (D) The fluorescence polarization calculated from the data in C. The lack of any long-term jumps in the polarization indicates that this protein molecule does not become static (e.g., due to adsorption on the vesicle wall) for any considerable amount of time. Very similar time traces were obtained from many individual molecules.
FRET Distributions of AK in Vesicles Under Native and Midtransition Conditions.
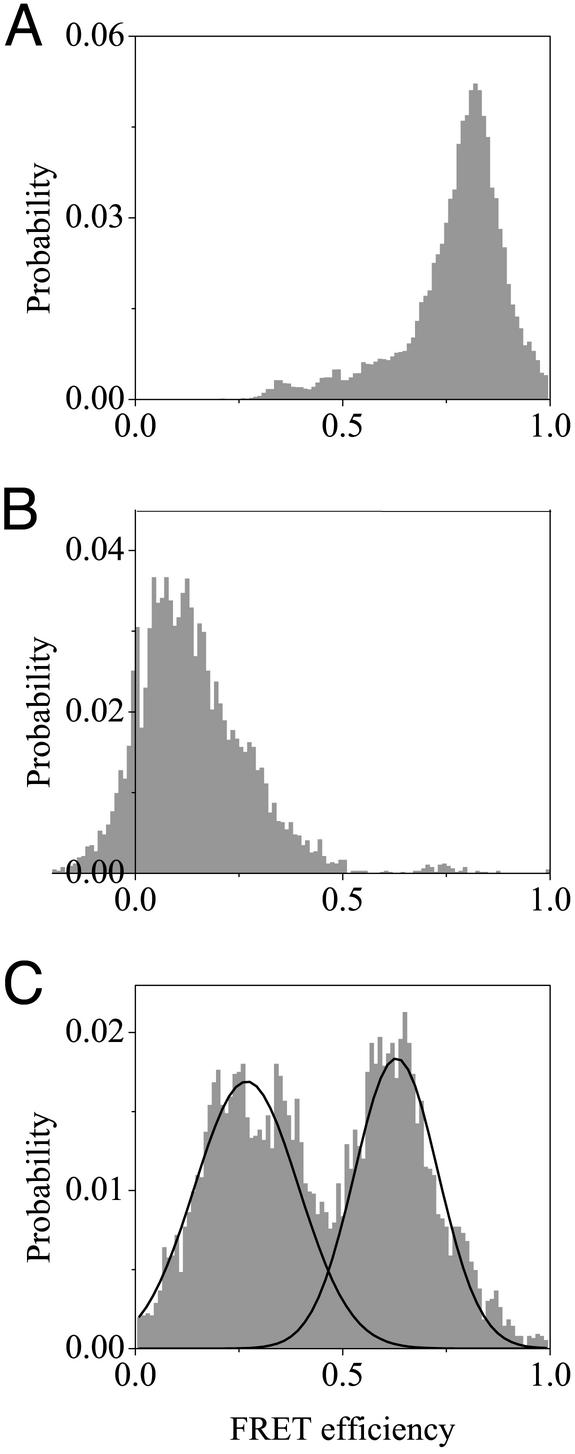
The EET distributions of vesicle-encapsulated labeled AK molecules measured under native conditions (Fig. 3A) and denaturing conditions (2 M Gdn⋅HCl, Fig. 3B) have average values (0.8 and 0.14, respectively) that match quite well the bulk EET values of the labeled protein under the same conditions (the distribution was constructed from all data points in time-dependent trajectories after filtration by using the procedure described in the Fig. 4 legend). Interestingly, the EET distribution obtained for AK molecules passively adsorbed on a glass surface displayed a large fraction of molecules with a smaller EET than in the native state, probably due to partial denaturation after adsorption (data not shown). This is a further indication for the importance of a proper immobilization method.
Figure 3.
(A and B) Distributions of EET values obtained from single-molecule trajectories of labeled AK molecules trapped in vesicles under native and denaturing (2 M Gdn⋅HCl) conditions, respectively. The distributions are essentially unimodal, and their average values, 0.8 and 0.14, are close to the ensemble values. (C) Distribution of EET values obtained from single-molecule trajectories of encapsulated AK molecules prepared in 0.4 M Gdn⋅HCl (near midtransition conditions) that showed folding/unfolding transitions. The distribution can be roughly divided into two subdistributions, one due to the “denatured” ensemble, with EET values <≈0.45, and one due to the “folded” ensemble, with EET values larger than that value, as illustrated by the black lines, which are Gaussian fits. The distribution of FRET efficiencies of all the trajectories measured for molecules in 0.4 M Gdn⋅HCl (data not shown) has peaks at the same values as the distribution made from molecules that only showed transitions (C), with a greater proportion of the distribution in the folded ensemble. Additionally, the average value of this single-molecule distribution (0.6) matches quite well with the measured ensemble value. All distributions were obtained from trajectories first smoothed with the nonlinear filter described in the Fig. 4 legend.
Figure 4.
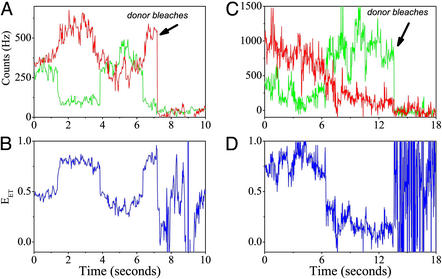
(A and C) Time traces of individual vesicle-trapped AK molecules under midtransition conditions with the acceptor signal in red and the donor in green. The traces were collected with 20-msec time bins. They then were smoothed by using the forward–backward nonlinear filter developed by Chung and Kennedy (31) for ion-channel current analysis. In this filter, predictors derived from the data are adaptively weighted to ensure that fast intensity jumps will not be smeared, as happens when standard rolling-average procedures are used. The nonlinear filter as used here reduces the noise in the trajectories by a factor of ≈4 while correctly preserving intensity transitions. (B and D) EET trajectories calculated from the signals in A and C, respectively. In A and B several transitions occur between states that are essentially within the “folded” ensemble, whereas in C and D a single transition takes the molecule from the folded to the “denatured” ensemble. Note that transitions can be strictly recognized by an anticorrelated change in the donor and acceptor fluorescence intensities as opposed to uncorrelated fluctuations sometimes appearing in one of the signals.
As noted above, a protein molecule is expected to move between folded and unfolded states at midtransition equilibrium conditions. The midtransition point for AK, ≈0.55 M Gdn⋅HCl, was obtained from an ensemble equilibrium denaturation curve (using FRET as the experimental probe, data not shown) and is quite similar to that reported by Zhang et al. (18). Because both the denaturation curve and the literature information discussed above point to a deviation from two-state folding, we performed measurements on vesicle-encapsulated AK molecules at several Gdn⋅HCl concentrations around the nominal midtransition point. Similar overall behavior was observed in all these points. The data reported here was taken primarily at 0.4 or 0.6 M Gdn⋅HCl. More than half of the time-traces obtained from individual vesicle-trapped AK molecules under these conditions showed at least one transition between two different EET values, recognized by a clear anticorrelated change in the donor and acceptor fluorescence intensities. The number of transitions seen in each trajectory varied widely. Many of the time traces showed no transitions, an expected result based on the time window of the experiment, which is limited by fluorophore photobleaching to 10–20 sec, compared with the ensemble folding time of ≈4 min [measured on the same mutant used here (20)].
Fig. 3C shows the distribution of EET values obtained from all trajectories taken at 0.4 M Gdn⋅HCl that displayed transitions (the distribution was constructed as described above). It is seen that the conformational space of the molecules can be roughly divided into two groups: the “denatured” ensemble, with EET values <≈0.45, and the “folded” ensemble, with EET values larger than that value. The valley between the two subdistributions indicates a large free-energy barrier, which may be equated with the folding barrier. The chemical denaturant actually distorts the shape of the energy surface, compared with native and denaturing conditions, because it stabilizes collapsed and partially folded conformations (intermediate states) (23, 24). This is likely the reason for the shift of the peak values of the two distributions from the values expected for fully folded or fully denatured protein (0.75 and 0.12, respectively). An analogous peak shift, albeit only in the denatured subpopulation, was found by Deniz et al. (13) and by Schuler et al. (16).
Observation of Heterogeneous Folding Pathways.
Fig. 4 shows two examples of single-molecule temporal trajectories, including calculated EET values. The trajectories chosen for Fig. 4 show some of the observed variability in behavior. The transitions seen in these curves indicate that a molecule may move from one conformation to another within the same ensemble (Fig. 4B, several transitions within the folded ensemble) or transfer from one ensemble to the other (Fig. 4D, transition from the folded ensemble to the denatured ensemble).
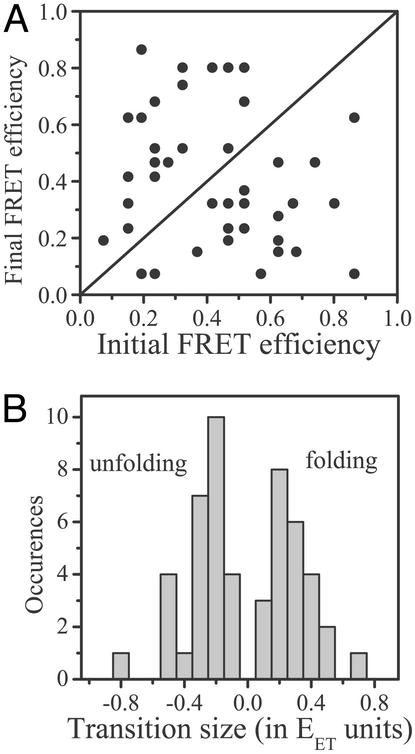
To further characterize the observed transitions, they were mapped to a two-dimensional plot, with the initial EET value (i.e., the value before the transition) on the ordinate and the final EET value (the value after the transition) on the abscissa (Fig. 5A). The map shows a very large spread of the transitions, which can essentially start and end at any value of the FRET efficiency. This dispersion provides a strong indication for the large heterogeneity of the folding reaction of AK. A histogram of the transition step sizes (i.e., the differences between final and initial EET efficiencies) shows two similar peaks (Fig. 5B), one for folding (final efficiency larger than initial) and one for unfolding (final efficiency smaller than initial). The histogram shows that there is a preference for steps that change EET by 0.2–0.3. Thus it is found that AK molecules do not typically change from a fully folded to a fully unfolded conformation (or vice versa) in one step. Rather, they tend to jump through several intermediate steps. A rather similar picture of folding in steps was found by Zocchi (25) by using a micromechanical technique to probe a small number (≈1) of albumin molecules at a time. Discrete steps were also seen in a simulation of the folding of a model four-helix bundle by Guo and Thirumalai (26). In the present experiment, the exact sequence of intermediates changes from one molecule to another, indicating that each AK molecule takes a different folding/unfolding pathway. The multiplicity of folding pathways is at the heart of energy-landscape theories and in principle should show up even in proteins that present a two-state folding reaction at the ensemble level.
Figure 5.
(A) Map of folding/unfolding transitions obtained from single-molecule trajectories. Each point represents the final vs. initial FRET efficiency for one transition. The line is drawn to distinguish folding and unfolding transitions; above the line are folding transitions (efficiency increases), and below the line are unfolding transitions (efficiency decreases). (B) Distribution of transition sizes (i.e., final minus initial efficiencies) as obtained from the map in A. The two branches of the distribution represent unfolding and folding transitions, respectively. The overall similarity of the shape of the two branches indicates uniform sampling of the energy landscape. They both peak at a low efficiency value, signifying a preference for small-step transitions.
Slow Transitions and the Role of Correlated Motion.
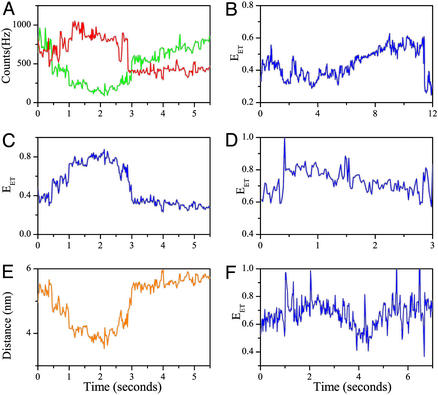
Although the slow folding reaction of AK does not allow us to measure the folding/unfolding times directly from our single-molecule trajectories, we find that the time scale for the transitions themselves can in many cases be determined. In fact, although many of the transitions are too abrupt to be time-resolved accurately in our experiment, some trajectories show slow transitions either in the folding or the unfolding direction, many of which take >1 sec to conclude. An example of such a slow folding transition (followed later by a fast unfolding jump) is shown in detail in Fig. 6 A–C. In particular, Fig. 6C presents the time dependence of the donor–acceptor (interprobe) distance as calculated from the EET trajectory (Fig. 6B). Assuming that the interprobe distance can represent the overall dimension of the molecule, it is remarkable that chain compaction by only ≈20% takes as much as 1.5 sec. Several additional EET trajectories showing slow transitions are presented in Fig. 6 D–F.
Figure 6.
Time-dependent signals from single molecules showing slow folding or unfolding transitions. (A) Signals showing a slow folding transition starting at ≈0.5 sec and ending at ≈2 sec. The same signals display a fast unfolding transition as well (at ≈3 sec). The acceptor signal is shown in red, and the donor is shown in green. (B) EET trajectory calculated from the signals in A. (C) The interprobe distance trajectory showing that the slow transition involves a chain compaction by only 20%. The distance was computed from the curve in B (32) by using a Förster distance (R0) of 49 Å. This Förster distance was calculated by assuming an orientational factor (κ2) of 2/3. However, the point discussed here (and in the text) does not depend on the exact value of κ2 or R0. (D–F) Additional EET trajectories demonstrating slow transitions. These transitions were identified, as already noted, by anticorrelated donor–acceptor intensity changes.
The surprising occurrence of transitions showing a slow, gradual change of EET is an indication of directed motion on the energy landscape, possibly slowed down by local traps. Such directed motion might be seen as the outcome of highly correlated, non-Markovian chain dynamics. Alternatively, a slow transition might be the result of slow growth (or dissolution) of a folding nucleus. Slowing down of nucleation dynamics at the transition temperature is a well known phenomenon in crystal science (27). It is notable, however, that both fast and slow transitions appear in the same molecule; this is in fact the single-molecule counterpart of kinetic partitioning (28). Interestingly, the slow transitions are not preceded by a fast jump, suggesting that some of the barriers sampled by these molecules are entropic rather then enthalpic. When a barrier is enthalpic in nature, it should involve a very fast transition, i.e., a jump, even on the single-molecule level. However, when a barrier is entropic, it implies the existence of a large set of local states through which an individual molecule has to diffuse before it finds that state that can lead it to a new region of the free-energy surface. The motion in this case is continuous, lacking a fast jump. The role of entropy in the formation of transition states on the energy landscape of folding proteins has been discussed extensively (23, 29).
Other Possibilities for Signal Heterogeneity.
Alternative sources of heterogeneity other than the occurrence of multiple folding pathways need to be considered. One possibility is interaction of the protein, particularly of the partially denatured protein, with the vesicle walls. However, as discussed earlier, we used fluorescence polarization to confirm that the AK molecules were moving freely within the vesicles and not associating significantly with the vesicle walls. A second, related possibility is that the fluorescent labels jump between several rigid orientations on the protein, thereby modifying the FRET efficiency. The steady-state fluorescence anisotropy values for the two labels (≈0.2) indicate partial rotational freedom but do not give information on the possible occurrence of slow orientational jumps. On the other hand, polarization measurements of labeled individual protein molecules directly adsorbed on glass (instead of being trapped in vesicles) can be used to estimate the freedom of motion of the attached dye molecules (17); in the absence of slow orientational jumps, the width of the polarization distribution carries information about the size of the cone of rotation of a tethered fluorophore. From polarization distributions obtained for both donor- and acceptor-labeled proteins on glass (Fig. 2B and ref. 17, respectively), it was concluded that the probes rotate in a large cone and average their orientations on a time scale shorter than the binning time of the single-molecule experiment and therefore do not contribute to the transitions through orientational jumps. Note also that no FRET transitions were seen under native conditions, where orientational jumps of the probes should, in principle, be just as abundant.
Finally, the occurrence of one cis-proline residue in the native state might lead to some heterogeneity in the folding kinetics of AK (18). However, the large spread of folding transitions as well as the preference for small-step transitions evidenced in this study cannot be explained by a single proline-isomerization event [or, for that matter, by a small predicted contribution from nonprolyl isomerization events (30)] and therefore must be a more general feature of the energy landscape of this protein.
Conclusions.
This work provides experimental evidence for the existence of multiple pathways available to a protein as it folds. Using FRET to monitor conformational changes of single AK molecules at midtransition conditions, we were able to observe folding and unfolding transformations directly. Two striking features emerged from the results. The first is the preference for small, partial folding/unfolding jumps, which are indicative of the abundance of local traps on the free-energy surface of the protein. The second feature is the occurrence of slow, directed transitions, which by necessity involve correlated motions of protein chain segments. Correlated conformational dynamics are important for the function of many proteins, and it is rather interesting to find this feature in the case of folding as well. Overall, our findings stress the importance of a global view of the energy landscape for understanding the folding reaction and provide further justification for the application of statistical methods in the analysis of folding pathways. It will be interesting to determine the universality of the picture revealed here by studying other mutants of AK as well as additional proteins, in particular two-state folders.
Acknowledgments
We gratefully acknowledge Dr. M. Sinev for AK mutant preparation. We thank Professor Elisha Haas for constant support and many discussions. This work was supported in part by grants from the Israel Science Foundation and the Minerva Foundation. E.R. thanks the National Science Foundation International Research Fellowship Program and Math and Physical Sciences Directorate's Office of Multidisciplinary Activities for a postdoctoral fellowship. G.H. is the incumbent of the Benjamin H. Swig and Jack D. Weiler Career Development Chair.
Abbreviations
- FRET
fluorescence resonance energy transfer
- Gdn⋅HCl
guanidine hydrochloride
- AK
adenylate kinase
References
- 1.Anfinsen C, Haber E, Sela M, White F H. Proc Natl Acad Sci USA. 1961;47:1309–1314. doi: 10.1073/pnas.47.9.1309. [DOI] [PMC free article] [PubMed] [Google Scholar]
- 2.Dill K A, Chan H S. Nat Struct Biol. 1997;4:10–19. doi: 10.1038/nsb0197-10. [DOI] [PubMed] [Google Scholar]
- 3.Onuchic J N, Luthey-Schulten Z, Wolynes P G. Annu Rev Phys Chem. 1997;48:545–600. doi: 10.1146/annurev.physchem.48.1.545. [DOI] [PubMed] [Google Scholar]
- 4.Thirumalai D, Klimov D K. Curr Opin Struct Biol. 1999;9:197–207. doi: 10.1016/S0959-440X(99)80028-1. [DOI] [PubMed] [Google Scholar]
- 5.Shea J-E, Brooks C L. Annu Rev Phys Chem. 2001;52:499–535. doi: 10.1146/annurev.physchem.52.1.499. [DOI] [PubMed] [Google Scholar]
- 6.Mirny L, Shaknovich E. Annu Rev Biophys Biomol Struct. 2001;30:361–396. doi: 10.1146/annurev.biophys.30.1.361. [DOI] [PubMed] [Google Scholar]
- 7.Sabelko J, Ervin J, Gruebele M. Proc Natl Acad Sci USA. 1999;96:6031–6036. doi: 10.1073/pnas.96.11.6031. [DOI] [PMC free article] [PubMed] [Google Scholar]
- 8.Huang C-Y, Getahun Z, Zhu Y, Klemke J W, DeGrado W F, Gai F. Proc Natl Acad Sci USA. 2002;99:2788–2793. doi: 10.1073/pnas.052700099. [DOI] [PMC free article] [PubMed] [Google Scholar]
- 9.Goldbeck R A, Thomas Y G, Chen E, Esquerra R M, Kliger D S. Proc Natl Acad Sci USA. 1999;96:2762–2787. doi: 10.1073/pnas.96.6.2782. [DOI] [PMC free article] [PubMed] [Google Scholar]
- 10.Thirumalai D, Klimov D K, Woodson S A. Theor Chem Acc. 1997;96:14–22. [Google Scholar]
- 11.Matagne A, Dobson C M. Cell Mol Life Sci. 1998;54:363–371. doi: 10.1007/s000180050165. [DOI] [PMC free article] [PubMed] [Google Scholar]
- 12.Wolynes P G. Proc Natl Acad Sci USA. 1997;94:6170–6175. doi: 10.1073/pnas.94.12.6170. [DOI] [PMC free article] [PubMed] [Google Scholar]
- 13.Deniz A A, Laurence T A, Beligere G S, Dahan M, Martin A B, Chemla D S, Daswon P E, Schultz P G, Weiss S. Proc Natl Acad Sci USA. 2000;97:5179–5184. doi: 10.1073/pnas.090104997. [DOI] [PMC free article] [PubMed] [Google Scholar]
- 14.Jia Y, Talaga D S, Lau W L, Lu H S M, DeGrado W F, Hochstrasser R M. Chem Phys. 1999;247:69–83. [Google Scholar]
- 15.Talaga D S, Lau W L, Roder H, Tang J Y, Jia Y W, DeGrado W F, Hochstrasser R M. Proc Natl Acad Sci USA. 2000;97:13021–13026. doi: 10.1073/pnas.97.24.13021. [DOI] [PMC free article] [PubMed] [Google Scholar]
- 16.Schuler B, Lipman E A, Eaton W A. Nature. 2002;419:743–747. doi: 10.1038/nature01060. [DOI] [PubMed] [Google Scholar]
- 17.Boukobza E, Sonnenfeld A, Haran G. J Phys Chem B. 2001;105:12165–12170. [Google Scholar]
- 18.Zhang Y-L, Zhou J-M, Tsou C-L. Biochim Biophys Acta. 1996;1295:239–244. doi: 10.1016/0167-4838(96)00044-1. [DOI] [PubMed] [Google Scholar]
- 19.Zhang H J, Sheng X R, Pan X M, Zhou J M. Biochem J. 1998;333:401–405. doi: 10.1042/bj3330401. [DOI] [PMC free article] [PubMed] [Google Scholar]
- 20.Ratner V, Sinev M, Haas E. J Mol Biol. 2000;299:1363–1371. doi: 10.1006/jmbi.2000.3814. [DOI] [PubMed] [Google Scholar]
- 21.Ruan Q, Ruan K, Balny C, Glaser M, Mantulin W W. Biochemistry. 2001;40:14706–14714. doi: 10.1021/bi010308i. [DOI] [PubMed] [Google Scholar]
- 22.Muller C W, Schulz G E. J Mol Biol. 1992;224:159–177. doi: 10.1016/0022-2836(92)90582-5. [DOI] [PubMed] [Google Scholar]
- 23.Onuchic J N, Socci N D, Luthey-Schulten Z, Wolynes P G. Folding Des. 1996;1:441–450. doi: 10.1016/S1359-0278(96)00060-0. [DOI] [PubMed] [Google Scholar]
- 24.Chan H S, Dill K A. Proteins. 1998;30:2–33. doi: 10.1002/(sici)1097-0134(19980101)30:1<2::aid-prot2>3.0.co;2-r. [DOI] [PubMed] [Google Scholar]
- 25.Zocchi G. Proc Natl Acad Sci USA. 1997;94:10647–10651. doi: 10.1073/pnas.94.20.10647. [DOI] [PMC free article] [PubMed] [Google Scholar]
- 26.Guo Z, Thirumalai D. J Mol Biol. 1996;263:323–343. doi: 10.1006/jmbi.1996.0578. [DOI] [PubMed] [Google Scholar]
- 27.Ubbelohde A R. The Molten State of Matter. Chichester, U.K.: Wiley; 1978. [Google Scholar]
- 28.Guo Z Y, Thirumalai D. Biopolymers. 1995;36:83–102. [Google Scholar]
- 29.Bicout D J, Szabo A. Protein Sci. 2000;9:452–465. doi: 10.1110/ps.9.3.452. [DOI] [PMC free article] [PubMed] [Google Scholar]
- 30.Pappenberger G, Aygun H, Engels J W, Reimer U, Fischer G, Kiefhaber T. Nat Struct Biol. 2001;8:452–458. doi: 10.1038/87624. [DOI] [PubMed] [Google Scholar]
- 31.Chung S H, Kennedy R A. J Neurosci Methods. 1991;40:71–86. doi: 10.1016/0165-0270(91)90118-j. [DOI] [PubMed] [Google Scholar]
- 32.dos Remedios C G, Moens P D J. In: Resonance Energy Transfer. Andrews D L, Demidov A A, editors. Chichester, U.K.: Wiley; 1999. pp. 1–64. [Google Scholar]


