Abstract
Molecular dynamics simulations of the protein chymotrypsin inhibitor 2 in 8 M urea at 60°C were undertaken to investigate the molecular basis of chemical denaturation. The protein unfolded rapidly under these conditions, but it retained its native structure in a control simulation in water at the same temperature. The overall process of unfolding in urea was similar to that observed in thermal denaturation simulations above the protein's Tm of 75°C. The first step in unfolding was expansion of the hydrophobic core. Then, the core was solvated by water and later by urea. The denatured structures in both urea and at high temperature contained residual native helical structure, whereas the β-structure was completely disrupted. The average residence time for urea around hydrophilic groups was six times greater than around hydrophobic residues and in all cases greater than the corresponding water residence times. Water self-diffusion was reduced 40% in 8 M urea. Urea altered water structure and dynamics, thereby diminishing the hydrophobic effect and encouraging solvation of hydrophobic groups. In addition, through urea's weakening of water structure, water became free to compete with intraprotein interactions. Urea also interacted directly with polar residues and the peptide backbone, thereby stabilizing nonnative conformations. These simulations suggest that urea denatures proteins via both direct and indirect mechanisms.
Small organic molecules in aqueous solution can have profound effects on protein stability, structure, and function. The use of these solutions to stabilize or destabilize proteins, depending on the cosolvent, is commonplace. In fact, protein studies are conducted almost exclusively in complex solutions. Chemical denaturation, with an agent such as urea, is one of the primary ways to assess protein stability, the effects of mutations on stability, and protein unfolding (1). Despite its widespread use, the molecular basis for urea's ability to denature proteins remains unknown. Urea may exert its effect directly, by binding to the protein, or indirectly, by altering the solvent environment (2–20). Most versions of the direct interaction model posit that urea binds to, and stabilizes, the denatured state (D), thereby favoring unfolding. But this interpretation does not explain how the protein surmounts the kinetic barrier to unfolding. In this regard, urea could bind to the protein and compete with native interactions, thereby actively participating in the unfolding process. Alternatively, it has been proposed that urea acts indirectly by altering the solvent environment, thereby mitigating the hydrophobic effect and facilitating the exposure of residues in the hydrophobic core. It is also possible that the mechanism of urea-promoted unfolding depends on the urea concentration. Unfortunately, it seems unlikely that experimental approaches will provide the molecular details of how urea denatures proteins, so we are employing atomic-resolution molecular dynamics (MD) simulations to address this issue.
The use of realistic cosolvents in MD simulations of proteins is uncommon. There have been few such studies reported to date: ubiquitin in 60% methanol (21), barnase in 8 M urea (22, 23), γ-chymotrypsin in hexane (24), and subtilisin in dimethyl formamide (25). The first of these studies was able to demonstrate solvent-dependent conformational behavior, yielding a partially unfolded state of ubiquitin consistent with NMR studies under the same solvent conditions. The studies of barnase in urea aimed to address the basis of chemical denaturation, as we do here, but, unfortunately, their simulations were far too short (0.9–2 ns), even given the elevated temperature used (87°C), to denature the protein. The last two studies were different and, instead, contained a small number of waters and were nearly neat organic solvents, because the authors were addressing protein function in organic media. Thus, there is still a need for further investigation of urea's effect on proteins, and it is now possible to perform much longer simulations to view the entire unfolding-reaction coordinate.
In preparation for the simulations described here, we have addressed the effect of urea on water structure and dynamics, particularly around alkanes (26) and cyclic dipeptides (27). Urea has little effect on water structure with respect to radial distribution functions (26). Consequently, we used the number of hydrogen bonds per water molecule as a metric to distinguish the solutions and the strength of the hydrogen bond (28), because they can reveal subtle differences not seen in other ensemble-averaged properties. The number of hydrogen bonds per water is lower in the hydration shell of nonpolar molecules, such as octane, and these waters are restricted because of their efforts to maximize interactions with neighboring waters while minimizing interactions with hydrocarbon (26).
Urea leads to a similar decrease in water–water interactions and hydrogen bond strength, as well as local ordering of water around urea's polar atoms, thereby lowering the penalty for exposure of nonpolar groups to solvent relative to pure water (27). Interestingly, the number of hydrogen bonds per water fails to converge to a constant value until a radius of 6 Å from hydrocarbon or urea is reached. Thus, projection of the urea on the surrounding aqueous environment results in a 6 Å “radius of influence.” The sphere of influence is notable: at concentrations as low as 4 M, 76% of the water is in contact with at least one urea molecule. Thus, urea appears to better solubilize hydrophobic solutes by, in effect, perturbing water and thereby preloading the solvent to accept nonpolar groups by subtle disruption of water's preferred structure and reorientation of the waters around its polar atoms (27). At higher concentrations, there are more direct interactions between the urea and solute. Therefore, our previous model studies suggest that urea acts both directly and indirectly on model compounds, but we do not know whether this is applicable to proteins.
To address the mechanism of urea denaturation of proteins, we have performed simulations of chymotrypsin inhibitor 2 (CI2) in 8 M urea. CI2 was chosen for this study because of the extensive amount of information available regarding its folding/unfolding behavior from both theoretical and experimental studies (29). Previous simulation studies have focused on the unfolding pathway of thermal denaturation (30–35). Here, we describe simulations of CI2 in an 8 M urea solution and in pure water (control) at 60°C [which is below the Tm of the protein (36)], focusing on the unfolding process. The results are compared with its unfolding behavior at high temperature (125°C) in water (35).
Methods
MD simulations were performed by using encad (37). The protocols and protein (38), water (39), and urea (27) potential functions have been described. The simulations began with the crystal structure of CI2 [1ypc (40)]. The 125°C simulation in water has been described (35).
A control trajectory of CI2 in pure water was prepared for MD by solvating the protein with water molecules extending at least 8 Å from any protein atom, yielding 2,596 waters. The box volume was adjusted to reproduce the experimental density of 0.983 g/ml at 60°C (41). Several steps were performed to further prepare the system for MD. First, water alone was minimized for 1,001 steps, followed by 1,001 steps of MD and another 1,001 steps of minimization. The protein then was subjected to 1,001 steps of minimization. Finally, the entire system was minimized for 1,001 steps. Production simulations then were performed. A nonbonded cutoff of 8 Å with smooth, force-shifted truncation was used, and the nonbonded list was updated every two to five steps. Periodic boundary conditions and the minimum image convention were used to reduce edge effects within the microcanonical ensemble. The simulations then were performed for 20 ns by using a 2-fs time step. Structures were saved every 0.2 ps for analysis, resulting in 100,000 structures for each simulation.
Urea systems (8 M; mole fraction of 0.186) were constructed by randomly replacing water molecules with urea, resulting in 2,103 waters and 493 urea molecules. The box volume was adjusted to give the experimental density for 60°C, 1.103 g/ml (42). Three independent 8 M urea simulations were performed: UR1, UR2, and UR3. These systems were prepared for MD by altering the preparatory protocol described above for CI2 in pure water to generate independent trajectories. The following changes were made: in UR1 2,001 (instead of 1,001) initial steps of minimization of the solvent system were performed; in UR2, 2,001 steps (instead of 1,001) of dynamics were performed on the solvent; and the UR3 simulation used the base protocol described above. Production MD simulations were performed as described above.
Results
Properties of the Protein in Different Solvent Environments.
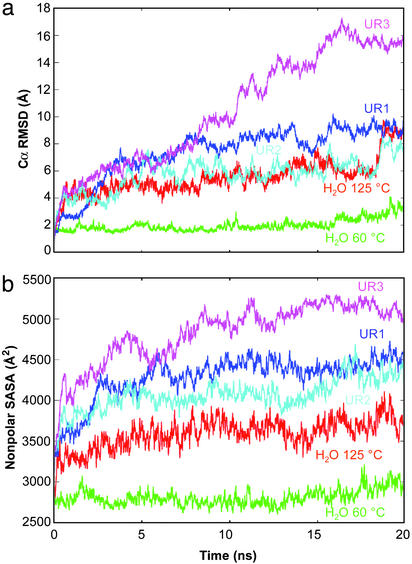
Several global properties of CI2 and the solvent were monitored during the simulations. Comparison of the Cα rms deviation (rmsd) for all of the trajectories reveals a striking contrast between CI2 in water and 8 M urea at 60°C (Fig. 1a). The protein began to unfold within the first few nanoseconds in urea, resembling what occurred during thermal denaturation at 125°C (Fig. 1a).
Figure 1.
General properties of CI2 as a function of simulation conditions. (a) Cα rmsd from the crystal structure. (b) Time evolution of the nonpolar side-chain solvent accessible surface area as calculated by using a modified version of NACCESS (43).
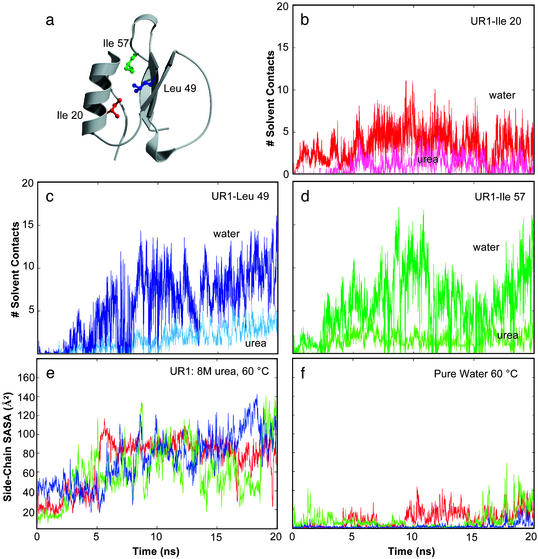
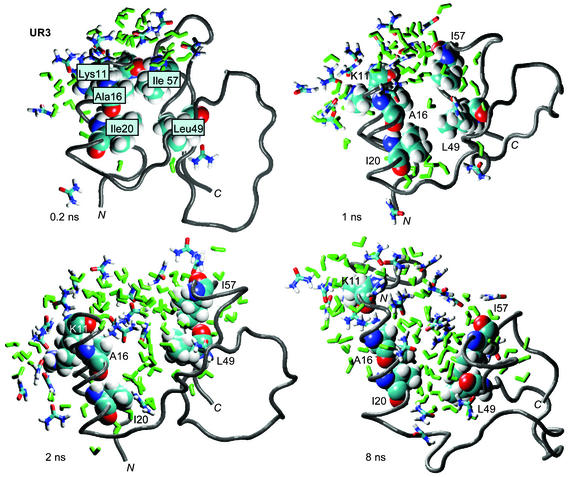
The nonpolar solvent-accessible surface area was greater in the urea simulations than in water (Fig. 1b). The exposure of key residues (Ile-20, Leu-49, and Ile-57) in the hydrophobic core of CI2 is displayed in Fig. 2. In each case, the core hydrophobic residues first were solvated by water and then by urea (Fig. 2). The solvent-accessible surface areas of these key residues increased substantially in 8 M urea while they remained buried in the 60°C water simulation (Fig. 2). Several groups of residues experienced significant increases in solvation over the first 2–3 ns in urea (Fig. 3). Two of these groups define the upper edge of the hydrophobic core (residues 9–11 and 55–58), and they form key hydrogen bonds in the native state (N). Fig. 3 shows snapshots of several of these core residues being solvated between 0.2 and 8 ns of the UR3 simulation. The side chains of these hydrophobic edge residues were steadily solvated by water and then urea until the nonpolar, intraprotein interactions were completely screened by solvent. The main-chain hydrogen bond in this region between residues 11 and 57 provides an example of direct competition of stabilizing native interactions by solvent. This hydrogen bond was broken within ≈1 ns, and water and, eventually, urea molecules became the new hydrogen-bonding partners of these residues (Fig. 3).
Figure 2.
Solvent–protein interactions in the hydrophobic core of CI2. (a) Ribbon representation of the crystal structure, constructed by using MOLSCRIPT (44) and RASTER3D (45). (b) Water (red) and urea (magenta) contacts for Ile-20 are plotted as a function of time for CI2 in 8 M urea at 60°C (UR1). Contacts were counted when heavy atoms were within 4.6 Å, or 5.4 Å for aliphatic carbons. (c) Water (dark blue) and urea (light blue) contacts for Leu-49. (d) Water (dark green) and urea (light green) contacts for Ile-57. (e) Side-chain (using the coloring in a) solvent-accessible surface area as a function of time for these three hydrophobic core residues in the UR1 simulation and in water (f).
Figure 3.
Solvation of the hydrophobic core. Snapshots from the UR3 simulation showing water and urea within 5.4 Å of residues 11, 16, 20, 49, and 57 (shown in space-filling representation). Water (green) is shown penetrating the top edge of the hydrophobic core at 1 ns. By 2 ns, urea (colored by atom) entered the hydrophobic core. The main-chain hydrogen bond of residue 57 and carbonyl oxygen atom of residue 11 is also shown at the top of the structures. The figure was made by using VMD (46) and rendered with RASTER3D (45).
Properties of Water in Different Environments.
Water self-diffusion was monitored to measure possible changes in solvent dynamics at high temperature and in the presence of urea. Water diffusion decreased slightly on addition of protein from 0.46 to 0.41 Å2/ps at 60°C, but it dropped dramatically in 8 M urea to 0.18 and 0.17 Å2/ps with and without CI2, respectively. For comparison, the experimental diffusion constant of water at this temperature is 0.47 Å2/ps (47), in good agreement with the value from MD (0.46). Residence times of solvent molecules around the protein surface also were monitored for polar and nonpolar groups. Urea residence times were uniformly longer than those of water. For example, for UR1, the average urea residence times were 25 ps around polar residues and 3.6 ps around nonpolar groups, and the complementary values for water were 2.8 and 2.6 ps, respectively.
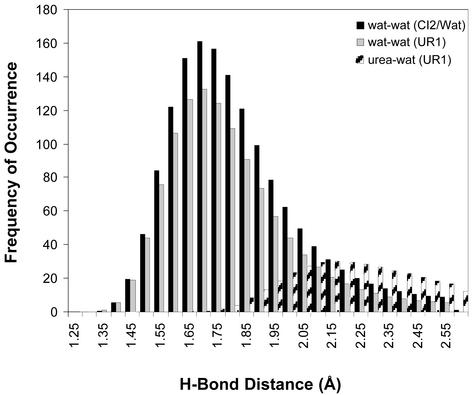
The effect of urea on water is illustrated in Fig. 4. Although the overall number of solvent hydrogen bonds was similar for CI2 in water and 8M urea, 1,818 and 1,956, respectively, there was a shift to longer hydrogen bonds in urea. Consequently, there was a drop in the number of strong (≤1.8 Å) water–water hydrogen bonds by 136. These shifts led to weakening of water structure.
Figure 4.
Hydrogen bond distributions for CI2 in water and in 8 M urea. The probability of different hydrogen bond lengths during a 200-ps time interval from 0.8 to 1.0 ns, before unfolding, is displayed for water–water and water–urea interactions. The values are given for the bulk solvent (>3.5 Å from polar atoms and >4.5 Å from nonpolar atoms) and normalized by the average number of bulk molecules. Hydrogen bond criteria are provided in the legend to Table 1.
Urea and water contacts also were monitored for key hydrophobic core residues throughout the simulations. As shown in Fig. 2, when urea was in contact with a hydrophobic residue, water contacts also were present. Water and urea contacts increased around 2 ns (Fig. 2), coinciding with passing through the transition state (TS). In general, water preceded urea in solvating the hydrophobic core. The number of water–protein hydrogen bonds increased ≈50% during the early stages of unfolding from the N to TS (Table 1). In contrast, the change in the number of urea–protein hydrogen bonds was more variable over this same time period. In one case (UR1), the number of urea–protein hydrogen bonds changed little from N to TS and, instead, increased later in unfolding after the secondary structure disintegrated. In the other two simulations, there was a greater number of urea–protein hydrogen bonds in the TS, particularly in UR3. Overall, 30–35% of the main-chain groups interacted with urea >40% of the time in the TS ensembles.
Table 1.
Intra- and intermolecular hydrogen bonds as a function of conformational state and solvent environment
| Simulation | Number of hydrogen bonds
|
||
|---|---|---|---|
| N | TS | D | |
| Pure water | |||
| 60°C | |||
| Water–protein | 96 | NA | NA |
| Protein–protein | 53 | NA | NA |
| 125°C | |||
| Water–protein | 82 | 119 (6) | 118 (6) |
| Protein–protein | 55 | 36 (2) | 33 (3) |
| 8 M urea, 60°C | |||
| UR1 | |||
| Water–protein | 70 | 102 (4) | 108 (7) |
| Urea–protein | 30 | 32 (2) | 41 (7) |
| Protein–protein | 49 | 26 (2) | 25 (2) |
| UR2 | |||
| Water–protein | 70 | 94 (5) | 103 (7) |
| Urea–protein | 30 | 37 (3) | 40 (5) |
| Protein–protein | 48 | 30 (1) | 26 (2) |
| UR3 | |||
| Water–protein | 74 | 109 (3) | 110 (7) |
| Urea–protein | 22 | 43 (3) | 52 (7) |
| Protein–protein | 52 | 24 (3) | 23 (2) |
Hydrogen bonds were considered to be intact when donor and acceptor atoms were within 2.6 Å and 35° of linearity. The N values are for t = 0 ns for each simulation. The TS values are averages over the following time intervals: UR1, 2.085–2.090 ns; UR2, 1.845–1.850 ns; UR3, 1.805–1.810 ns; and 125°C in pure water, 8.245–8.250 ns. The TS ensemble regions were identified by using a conformational clustering procedure described by Li and Daggett (23, 24). The D values are averages from 15–20 ns. SDs are given in parentheses. NA, not applicable.
On average, the number of water–protein hydrogen bonds increased little in the process of going from TS to D (Table 1). This result is due at least in part to the relative enrichment of urea at the protein surface; the ratio of water to urea in the first solvation shell was less than in bulk (3.6 vs. 4.2, based on 3 Å heavy atom contact distance). Overall, CI2 gained 50 hydrogen bonds with solvent in the N → D process and lost ≈25 intraprotein hydrogen bonds.
Solvent-Induced Conformational Properties.
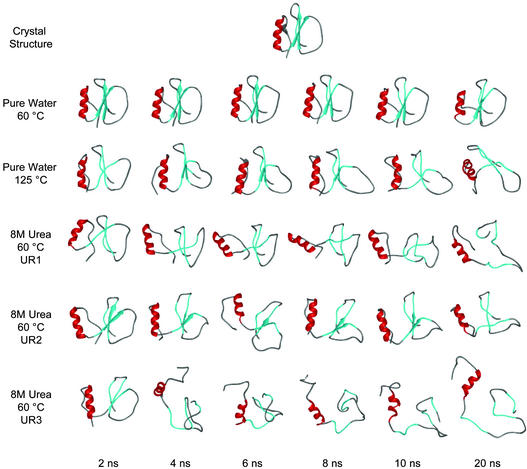
Fig. 5 contains snapshots of CI2 at various time points to illustrate the effects of urea on the overall fold of the protein. The structures from the unfolding simulations share some basic characteristics, such as a completely solvated hydrophobic core and the degree of disruption of the α-helix and β-sheet. Hydrophobic contacts between the helix and β-sheet were lost, allowing the core-defining residues Ala-16, Ile-20, Leu-49, and Ile-57 to become solvated (Figs. 2 and 3), as well as Trp 5 (data not shown), the spectroscopic probe used experimentally to monitor unfolding. Helical structure was not completely lost in 8 M urea, although unwinding and refolding of the helix occurred (Fig. 5). The β-structure, in contrast, was abolished. Overall, the conformational properties of CI2 in 8 M urea differed dramatically from that of the control simulation of CI2 in water at the same temperature, and, instead, they were similar to what was observed in the 125°C denaturation trajectory (Fig. 5).
Figure 5.
Structural changes of CI2 as a function of time and environment. The positions of native secondary structure are colored in red (helix) and cyan (β-strands).
Discussion
Many studies have sought to explain the action of denaturants such as urea (2–20, 48). These studies suggest three possible mechanisms: (i) direct interactions of urea with the protein, particularly the D; (ii) indirect effects via perturbation of the solvent environment to favor solvation of the hydrophobic residues; and (iii) a combination of direct and indirect effects. MD simulations with appropriate solvent models can shed light on the atomic details of chemical denaturation by urea. Two groups in particular have used such an approach to study urea interactions with the enzyme barnase (22, 23). Both of these studies focused on describing direct protein–urea interactions with the N of the protein, because the simulations were too short to observe unfolding. In addition, although their results were in general agreement, they did not address possible indirect effects of urea through analysis of the solvent. Here, we have followed up on these earlier studies by taking unfolding to completion and analyzing not only direct urea–protein interactions but also the properties of the solvent to yield an atomic description of chemical denaturation.
Based on the results of our CI2 simulations in 8 M urea, urea-catalyzed denaturation occurred by a combination of direct and indirect mechanisms. First, water structure and dynamics were perturbed by urea, yielding weakened water–water interactions and decreased water diffusion. The water diffusion constants in 8 M urea at 60°C were similar to those of pure water at 25°C, which was entirely unexpected. Many of the early explanations of urea-dependent denaturation relied on chaotropic arguments: urea disorders water structure so that hydrophobic molecules are more easily solvated. Our previous studies of urea concentrations of ≤4 M are consistent with this idea (27).
At high concentrations, such as described here, this effect on water is magnified and contributes to the “chaotropic” properties of urea and allows for easier solvation of nonpolar residues. Also, the hydrophobic effect increases with temperature (49, 50), reflecting the increasing disparity between perturbed waters forced to align themselves around nonpolar groups (48) and those free to interact with bulk solvent. In 8 M urea, the hydrophobic effect is mitigated by the decrease in water dynamics at 60°C. In effect, the solvent environment is better able to solvate hydrophobic groups and the exclusion of nonpolar side chains from solvent offers little advantage; thus, the indirect effects of urea act to stabilize non-N of the protein, including the TS, thereby accelerating protein unfolding.
The second part of our model includes direct interactions between solvent and CI2, which are clearly evident in the simulations. Disruption of water structure by urea diminished the cohesion of the water, freeing it to be the primary denaturant early in unfolding, thereby providing a link between the direct and indirect mechanisms. The number of water–protein hydrogen bonds increased ≈50% from N to TS, with less of a change in urea interactions. However, urea also interacted directly with the protein, particularly after disruption of the secondary structure. The number of urea hydrogen bonds with the peptide backbone increased from TS to D, whereas water hydrogen bonds remained relatively constant, but there was considerable variability in these numbers. The increase in “bound” urea on unfolding is in agreement with estimates based on transition curves of ≈10–15 additional bound molecules (2) and the values of Makhatadze and Privalov (5) of ≈30 for proteins twice the size of CI2. The extent of interaction of the main chain with urea in the TS in the simulations (30–35% of the residues) is also in good agreement with estimates based on experiment (36%) (9).
Solvent not only participated in specific electrostatic interactions with the protein, it also screened hydrophobic interactions. For example, residues comprising the edge of the hydrophobic core interacted with urea and water until stabilizing hydrophobic and hydrogen-bonding interactions were broken, which led to the influx of water and then urea to the hydrophobic core (Figs. 2 and 3). As the protein exposed more backbone atoms to solvent, urea interacted preferentially with these atoms and excluded water in the process, which is consistent with previous calorimetric (51, 52), solubility (19), and solvation studies (11, 53, 54) and recent work by Timasheff (10, 11). Relative enrichment of urea around the protein has been observed in previous simulations (4, 22, 23). Moreover, calculation of the local-bulk partition coefficient Kp (the ratio of molal concentrations of cosolvent near the protein vs. bulk) from our simulations gives an average value of 1.2, which is in good agreement with experiment (1.1–1.4; refs. 7 and 8). The short residence times of urea around nonpolar residues (≈4 ps) compared with polar residues (25 ps) supports the direct-interaction part of our model. Also, urea residence times were longer than those in water, in agreement with NMR studies (55). The protein contained residual structure in the form of dynamic, native helical structure and hydrophobic side-chain clusters, in agreement with experiment (34).
Conclusions
Simulations of CI2 in 8 M urea indicate that urea promotes unfolding by both indirect and direct mechanisms. Direct urea interactions consisted of hydrogen bonding to the polar moieties of the protein, particularly peptide groups, leading to screening of intramolecular hydrogen bonds. Solvation of the hydrophobic core proceeded via the influx of water molecules, then urea. Urea also promoted protein unfolding in an indirect manner by altering water structure and dynamics, as also occurs on the introduction of nonpolar groups to water, thereby diminishing the hydrophobic effect and facilitating the exposure of the hydrophobic core residues. Overall, urea-induced effects on water indirectly contributed to unfolding by encouraging hydrophobic solvation, whereas direct interactions provided the pathway.
Acknowledgments
We thank Drs. Bin Li, Darwin Alonso, and Keith Laidig for helpful discussions. This work was supported by National Institutes of Health Grant GM50789 (to V.D.) and National Institutes of Health Pharmacological Sciences Training Grant GM07750 (to B.J.B.).
Abbreviations
- CI2
chymotrypsin inhibitor 2
- MD
molecular dynamics
- N
native state
- TS
transition state
- D
denatured state
Footnotes
This paper was submitted directly (Track II) to the PNAS office.
References
- 1.Pace C N. Methods Enzymol. 1986;134:266–280. doi: 10.1016/0076-6879(86)31045-0. [DOI] [PubMed] [Google Scholar]
- 2.Schellman J A. Biopolymers. 1978;17:1305–1322. doi: 10.1002/bip.1978.360170510. [DOI] [PubMed] [Google Scholar]
- 3.Timasheff S N. Biophys Chem. 2002;101–102:99–111. doi: 10.1016/s0301-4622(02)00188-6. [DOI] [PubMed] [Google Scholar]
- 4.Tobi D, Elber R, Thirumalai D. Biopolymers. 2003;68:359–369. doi: 10.1002/bip.10290. [DOI] [PubMed] [Google Scholar]
- 5.Makhatadze G I, Privalov P L. J Mol Biol. 1992;226:491–505. doi: 10.1016/0022-2836(92)90963-k. [DOI] [PubMed] [Google Scholar]
- 6.Anderson C F, Felitsky D J, Hong J, Record M T. Biophys Chem. 2002;101:497–511. doi: 10.1016/s0301-4622(02)00159-x. [DOI] [PubMed] [Google Scholar]
- 7.Felitsky D J, Record M T. Biochemistry. 2003;42:2202–2217. doi: 10.1021/bi0270992. [DOI] [PubMed] [Google Scholar]
- 8.Courtenay E S, Capp M W, Record M T. Protein Sci. 2001;10:2485–2497. doi: 10.1110/ps.ps.20801. [DOI] [PMC free article] [PubMed] [Google Scholar]
- 9.Schellman J A. Biophys Chem. 2002;96:91–101. doi: 10.1016/s0301-4622(02)00009-1. [DOI] [PubMed] [Google Scholar]
- 10.Timasheff S N. Adv Protein Chem. 1998;51:355–432. doi: 10.1016/s0065-3233(08)60656-7. [DOI] [PubMed] [Google Scholar]
- 11.Timasheff S N. Proc Natl Acad Sci USA. 2002;99:9721–9726. doi: 10.1073/pnas.122225399. [DOI] [PMC free article] [PubMed] [Google Scholar]
- 12.Schellman J A. Biopolymers. 1987;26:549–559. doi: 10.1002/bip.360260408. [DOI] [PubMed] [Google Scholar]
- 13.Arakawa T, Timasheff S N. Biochemistry. 1984;23:5924–5929. doi: 10.1021/bi00320a005. [DOI] [PubMed] [Google Scholar]
- 14.Arakawa T, Timasheff S N. Biochemistry. 1984;23:5912–5923. doi: 10.1021/bi00320a004. [DOI] [PubMed] [Google Scholar]
- 15.Tanford C. Adv Protein Chem. 1970;24:1–95. [PubMed] [Google Scholar]
- 16.Creighton T E. Curr Opin Struct Biol. 1991;1:5–16. [Google Scholar]
- 17.Tanford C. Adv Protein Chem. 1968;23:121–282. doi: 10.1016/s0065-3233(08)60401-5. [DOI] [PubMed] [Google Scholar]
- 18.Alonso D O V, Dill K A. Biochemistry. 1991;30:5974–5985. doi: 10.1021/bi00238a023. [DOI] [PubMed] [Google Scholar]
- 19.Robinson D R, Jencks W P. J Am Chem Soc. 1965;87:2462–2470. doi: 10.1021/ja01089a028. [DOI] [PubMed] [Google Scholar]
- 20.von Hippel H, Schleich T. Acc Chem Res. 1969;2:257–265. [Google Scholar]
- 21.Alonso D O V, Daggett V. J Mol Biol. 1995;247:501–520. doi: 10.1006/jmbi.1994.0156. [DOI] [PubMed] [Google Scholar]
- 22.Tirado-Rives J, Orozco M, Jorgensen W L. Biochemistry. 1997;36:7313–7329. doi: 10.1021/bi970096i. [DOI] [PubMed] [Google Scholar]
- 23.Caflisch A, Karplus M. Struct Fold Des. 1999;7:477–488. doi: 10.1016/s0969-2126(99)80064-1. [DOI] [PubMed] [Google Scholar]
- 24.Toba S, Hartsough D S, Merz K M. J Am Chem Soc. 1996;118:6490–6498. [Google Scholar]
- 25.Colombo G, Toba S, Merz K M. J Am Chem Soc. 1999;121:3486–3493. [Google Scholar]
- 26.Laidig K E, Daggett V. J Phys Chem. 1996;100:5616–5619. [Google Scholar]
- 27.Zou Q, Bennion B J, Daggett V, Murphy K. J Am Chem Soc. 2002;124:1192–1202. doi: 10.1021/ja004206b. [DOI] [PubMed] [Google Scholar]
- 28.Muller N. Acc Chem Res. 1990;23:23–28. [Google Scholar]
- 29.Fersht A R, Daggett V. Cell. 2002;108:573–582. doi: 10.1016/s0092-8674(02)00620-7. [DOI] [PubMed] [Google Scholar]
- 30.Daggett V, Li A, Itzhaki L S, Otzen D E, Fersht A R. J Mol Biol. 1996;257:430–440. doi: 10.1006/jmbi.1996.0173. [DOI] [PubMed] [Google Scholar]
- 31.Ladurner A G, Itzhaki L S, Daggett V, Fersht A R. Proc Natl Acad Sci USA. 1998;95:8473–8478. doi: 10.1073/pnas.95.15.8473. [DOI] [PMC free article] [PubMed] [Google Scholar]
- 32.Li A, Daggett V. Proc Natl Acad Sci USA. 1994;91:10430–10434. doi: 10.1073/pnas.91.22.10430. [DOI] [PMC free article] [PubMed] [Google Scholar]
- 33.Li A, Daggett V. J Mol Biol. 1996;257:412–429. doi: 10.1006/jmbi.1996.0172. [DOI] [PubMed] [Google Scholar]
- 34.Kazmirski S L, Wong K B, Freund S M V, Tan Y J, Fersht A R, Daggett V. Proc Natl Acad Sci USA. 2001;98:4349–4354. doi: 10.1073/pnas.071054398. [DOI] [PMC free article] [PubMed] [Google Scholar]
- 35.Day R, Bennion B J, Ham S, Daggett V. J Mol Biol. 2002;322:189–203. doi: 10.1016/s0022-2836(02)00672-1. [DOI] [PubMed] [Google Scholar]
- 36.Jackson S E, Fersht A R. Biochemistry. 1991;30:10428–10435. doi: 10.1021/bi00107a010. [DOI] [PubMed] [Google Scholar]
- 37.Levitt M. encad, Energy Calculations and Dynamics. Rehovat, Israel: Yeda; 1990. [Google Scholar]
- 38.Levitt M, Hirshberg M, Sharon R, Daggett V. Comput Phys Commun. 1995;91:215–231. [Google Scholar]
- 39.Levitt M, Hirshberg M, Sharon R, Laidig K E, Daggett V. J Phys Chem. 1997;101:5051–5061. [Google Scholar]
- 40.Harpaz Y, Elmasry N, Fersht A R, Henrick K. Proc Natl Acad Sci USA. 1994;91:311–315. doi: 10.1073/pnas.91.1.311. [DOI] [PMC free article] [PubMed] [Google Scholar]
- 41.Kell G S. J Chem Eng Data. 1967;12:66–69. [Google Scholar]
- 42.Weast R, Astle M J. Handbook of Chemistry and Physics. Boca Raton, FL: CRC; 1980. [Google Scholar]
- 43.Hubbard S J, Thorton J M. naccess (Department of Biochemistry and Molecular Biology, Univ. College, London) 1993. [Google Scholar]
- 44.Kraulis P J. J Appl Crystallogr. 1991;24:945–949. [Google Scholar]
- 45.Merritt E A, Murphy M E P. Acta Crystallogr D. 1994;50:869–873. doi: 10.1107/S0907444994006396. [DOI] [PubMed] [Google Scholar]
- 46.Humphrey W, Dalke A, Schulten K. J Mol Graphics. 1996;14:33–38. doi: 10.1016/0263-7855(96)00018-5. [DOI] [PubMed] [Google Scholar]
- 47.Krynicki K, Green C D, Sawyer D W. Faraday Discuss Chem Soc. 1978;66:199–208. [Google Scholar]
- 48.Tanford C. Adv Protein Chem. 1968;23:218–283. doi: 10.1016/s0065-3233(08)60401-5. [DOI] [PubMed] [Google Scholar]
- 49.Kauzmann W. Adv Protein Chem. 1959;14:1–63. doi: 10.1016/s0065-3233(08)60608-7. [DOI] [PubMed] [Google Scholar]
- 50.Tanford C, De P K. J Biol Chem. 1961;236:1711–1715. [PubMed] [Google Scholar]
- 51.Zou Q, Habermann-Rottinghaus S M, Murphy K P. Proteins. 1998;31:107–115. [PubMed] [Google Scholar]
- 52.Wang A J, Bolen D W. Biochemistry. 1997;36:9101–9108. doi: 10.1021/bi970247h. [DOI] [PubMed] [Google Scholar]
- 53.Timasheff S N. Biochemistry. 1992;31:9857–9864. doi: 10.1021/bi00156a001. [DOI] [PubMed] [Google Scholar]
- 54.Timasheff S N. Annu Rev Biophys Biomol Struct. 1993;22:67–97. doi: 10.1146/annurev.bb.22.060193.000435. [DOI] [PubMed] [Google Scholar]
- 55.Dotsch V, Wider G, Siegal G, Wuthrich K. FEBS Lett. 1995;366:6–10. doi: 10.1016/0014-5793(95)00459-m. [DOI] [PubMed] [Google Scholar]


