

Abstract
Expression of the FSH receptor (Fshr) is restricted to testicular Sertoli cells and ovarian granulosa cells, thereby limiting the direct targets of FSH action to these somatic cells of the gonads. Earlier studies indicate that transcription of Fshr in the gonads requires elements outside the gene’s immediate 5′ flanking sequence. To help uncover candidate regulatory sequences, comparative genomics and deoxyribonuclease I hypersensitivity mapping were employed. A total of 156 evolutionarily conserved sequences were found, and partial deoxyribonuclease I hypersensitivity mapping across 45 kb of 5′ flanking sequence and the first intron identified four hypersensitive sites, DHS1–4. Notably, DHS1 and DHS2 localized to conserved sites in the promoter region and exon 1 and correlated with the active state of the gene. DHS3 also corresponded to a conserved site (site 7) but was more pronounced in nonexpressing myoid cells, suggesting a role in gene silencing. Transient transfection analysis of DHS3 confirmed its role in gene silencing, a function that was promoter, cell type, and position dependent. Protein-DNA binding studies on DHS3 revealed that octamer transcription factor 1 (OCT-1) and GATA-4 bound site 7, in vitro, and transient transfection analysis showed that their binding sites were required for silencing activity. Furthermore, chromatin immunoprecipitation revealed that OCT-1 bound to site 7 in the endogenous gene, but only in myoid cells. In contrast, GATA-1 bound site 7 predominantly in Sertoli cells, suggesting that it attenuates silencer activity. The findings reveal that OCT-1 binds within DHS3 to silence Fshr transcription and implicate members of the GATA family in the modulation of this activity.
Abbreviations: C/EBP, CCAAT/enhancer binding protein; ChIP, chromatin immunoprecipitation; DNase, deoxyribonuclease; EST, expressed sequence tag; Fshr, FSH receptor; GFI-1, growth factor independence 1; NCBI, National Center for Biotechnology Information; OCT-1, octamer transcription factor 1; POU, Pit1 Oct and Unc86; SDS, sodium dodecyl sulfate; SV40, simian virus 40; Usf, upstream stimulatory factor
WITHIN THE HYPOTHALAMIC-pituitary-gonad axis, FSH plays a critical role in regulating the initiation and maintenance of reproductive function (reviewed in Ref. 1). From observations in Sertoli cells, increased protein phosphorylation is the primary cellular action of FSH, resulting in additional structural, enzymatic, and transcriptional modifications that are important for establishing the total population and the functional repertoire of Sertoli cells (reviewed in Ref. 2). In granulosa cells, FSH-dependent protein phosphorylation leads to alterations in cell cycle regulation and changes in gene expression important for granulosa cell proliferation and differentiation during follicular growth (reviewed in Ref. 3). Studies that examined mice carrying null mutations for Fshβ and Fshr, along with spontaneous inactivating mutations in human FSHβ and FSHR, have shown that FSH action is necessary for pubertal timing, follicular recruitment, ovulation, and quantitatively normal spermatogenesis in mice and humans (1, 4–15). This biological activity of FSH requires that it bind to and activate a cell surface receptor, Fshr, which, because of its highly restricted expression profile, limits FSH activity to Sertoli and granulosa cells of the testis and ovary, respectively (16–19).
Given the role of Fshr in specifying FSH action and its remarkable cell specificity, understanding the mechanisms that control its expression will offer insight into FSH signaling and cell-specific gene regulation in granulosa and Sertoli cells. The gene encoding Fshr has been examined in a number of species and is characterized by a 10-exon, 9-intron structure, and a high degree of homology in the exons and the immediate 5′ flanking sequence (20–27). To date, the focus of studies examining Fshr transcriptional regulation has been limited to the 5′flanking sequence of the gene and, more specifically, to the first 5000 bp. These studies have uncovered important regulatory elements and transcription factors that establish basal promoter activity. Most notably, a conserved E-box element (5′-CACGTG-3′ or 5′-CACATG-3′) is located close to the transcriptional start sites and is bound by the ubiquitous basic helix-loop-helix transcription factors upstream stimulatory factor 1 (Usf1) and upstream stimulatory factor 2 (Usf2) (28–30). Additional studies showed that the orphan nuclear receptor steroidogenic factor-1 induced murine, rat, and ovine Fshr promoter activity; a response that required the Usf proteins, the E-box and steroidogenic factor-1 response elements (31–33). Although these experiments have provided important insight into the elements and proteins regulating Fshr transcription, in vitro, the experimental constraints imposed by transient transfection have limited accurate evaluation of the transcriptional elements contributing to cell specificity.
Transgenic strategies have been employed to help overcome this limitation and better assess the promoter’s ability to direct cell-specific expression. One study used a β-galactosidase reporter under control of the 5000-bp rat Fshr promoter and observed transgene expression in the testis and ovary and no expression in Fshr-negative tissues, suggesting that the promoter directed gonadal expression (34). However, due to the limited number of available transgenic lines and the lack of cellular expression data, this study could not fully address the promoter’s ability to direct cell specificity. Data from a second transgenic study, which examined expression of Cre recombinase driven by either the 5000-bp rat Fshr promoter or a core 198-bp promoter, led to a generally different conclusion (30). In all, ten tissues were evaluated in 16 distinct transgenic lines and revealed that promoter activity was not limited to testes and ovaries for either the 5000- or 198-bp promoters. Furthermore, temporal expression of the transgenes in the testes did not match that of the endogenous gene. These findings and the identification of Cre transcripts primarily in the germ cell population led to the conclusion that the 5000- and 198-bp Fshr promoters did not recapitulate Fshr expression, thereby implicating key regulatory elements outside of the first 5000 bp of 5′ flanking sequence in proper cell-specific and temporal regulation of Fshr.
Interestingly, recent studies using global deoxyribo-nuclease (DNase) I hypersensitivity mapping revealed that approximately 70% of all cis-regulatory sequences are located more that 5 kb from a gene’s transcriptional start site (35). Thus, data generated from such global transcriptional analyses, together with the rapidly expanding genome sequence information, are contributing to a developing transcriptional scheme that emphasizes the importance of distal regulatory elements acting in cooperation with the promoter to control gene expression. Furthermore, other studies examining distal cis-regulatory sequences, such as those on the Sox9 and Shh genes, demonstrate that distal elements can function at distances as far away as 1 Mb from the transcriptional start site (36, 37). These findings emphasize the experimental complexity of locating cis-regulatory sequences due to the appreciable amount of potentially relevant sequence. The search for such sequences, however, has been greatly advanced by the recent availability of multiple genome sequences and bioinformatics tools that allow the use of comparative genomics to expedite the identification of putative regulatory elements by virtue of their conserved sequence characteristics (38–44). Because such sequences have been maintained through selective evolutionary pressure, they represent likely sites of functional importance. Therefore, sequence comparison of the Fshr gene from different species should facilitate the search for key regulatory elements by focusing studies to only the conserved portion of the gene locus. In this study, we describe a novel regulatory element that silences Fshr promoter activity, which was initially identified using direct comparison of the rat and human Fshr genes.
RESULTS
Fshr Resides within a Gene-Poor Region Containing Multiple Clusters of Highly Conserved Noncoding Sequences
Using genome assembly builds for human (34.2) and rat (2.1), the National Center for Biotechnology Information (NCBI) GenomeView and MapView browsers localized the human and rat Fshr loci to syntenic regions of the 16.6 band on the short arm of chromosome 2 and the 12 band of the long arm of chromosome 6, respectively. In both species, this chromosomal region is characteristic of a gene desert, a region with large intergenic distances that are thought to house long-range regulatory elements (37, 42). The gene that codes for Neurexin 1, Nrxn1, is the closest identified gene 5′ to Fshr, at a distance of more than 766 and 1037 kb in humans and rats, respectively (Fig. 1A). Likewise, the 3′ intergenic distance from Fshr to the next known gene, Lhcgr, which codes for the LH/chorionic gonadotropin hormone receptor, is nearly 207 and 275 kb in humans and rats, respectively (Fig. 1A). Interestingly, Lhcgr is a paralog of Fshr that is thought to have arisen by gene duplication (20, 45).
Fig. 1. Alignment of the Human and Rat Fshr Genes.
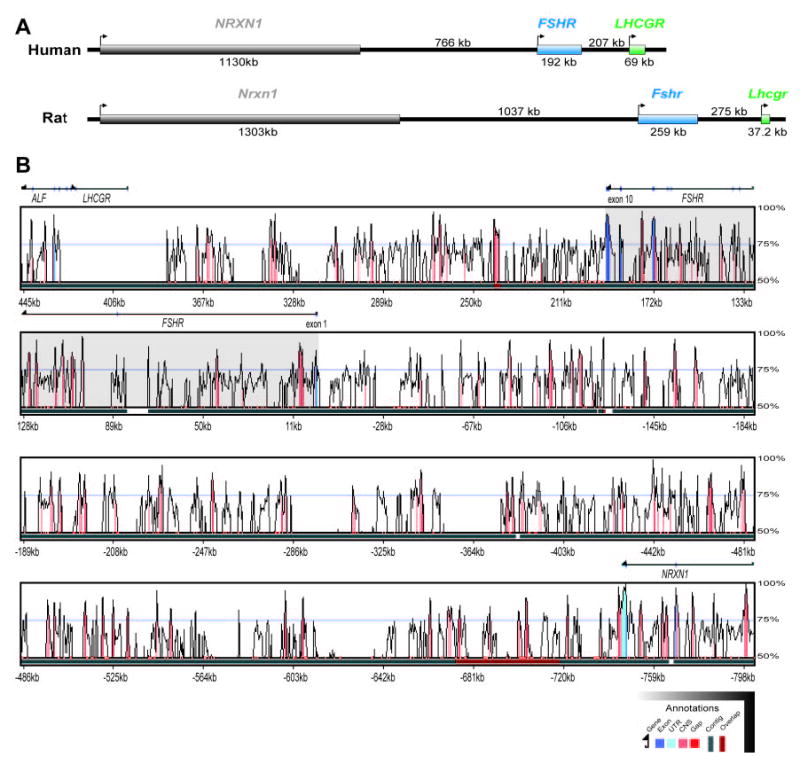
A, Chromosomal location of the rat and human Fshr loci on 6q12 and 2p16.6, respectively, within a gene desert between the genes coding for Neurexin 1 and Lhcgr; B, The LAGAN alignment of rat and human Fshr genes is displayed using a VISTA percent identity curve. The y-axis shows the percent conservation between the two organisms at any given coordinate along the x-axis (DNA sequence) relative to the human sequence. Coloring below the VISTA curve corresponds to annotated exons (dark blue), UTRs (light blue), and conserved noncoding sequences (red) of at least 70% identity over at least 100 bp. Gaps in the base sequence are signified by red sections of the black line beneath the plot. The unidirectional arrow drawn above the plot signifies gene orientation, with exons also annotated on this arrow.
Despite the gene-poor nature of the Fshr locus, examination of the sequence conservation of this region indicated the presence of numerous functionally important segments. Direct comparison of human FSHR and the corresponding segment of the rat genome was performed using precompiled LAGAN alignments and viewed within the VISTA genome browser (46–48) (Fig. 1B). As expected with an evolutionary distance of 96,000,000 yr, the majority (roughly 97%) of the sequence within this locus is less than 75% conserved or repetitive in nature (49) (Fig. 1B and data not shown). However, the remaining 3% represented conserved sequences (≥75% identity over ≥100 bp) that were interspersed across the 1268 kb analyzed and corresponded to both coding (exons) and noncoding regions (Fig. 1B; red, noncoding; blue, coding). Because functional sequences evolve more slowly than nonfunctional sequences, these conserved sites have the greatest probability of being biologically important, and therefore, the noncoding sequences in the vicinity of Fshr are the most likely sites to house important elements that control Fshr transcription.
To help extend the analysis for potential regulatory regions, the Fshr locus sequences were subjected to pairwise analysis, which identifies conserved sequences without the inherent colinearity bias of global alignment, thereby allowing detection of conserved sequences that are not constrained by order or orientation within a gene (50). The genomic region for the rat and human Fshr loci were identified from contigs cataloged in GenBank. The 1164.7-kb of sequence for the human FSHR gene, spanning from the 3′ end of NRXN1 exon 21 to the 5′ end of LHCGR exon 1, was identified from within a single 68.4-Mb chromosome 2 genomic contig (NT_022184). Similarly, the 1399.3-kb of rat genomic sequence used for analysis was identified within a single 6.8-Mb rat supercontig (NW_047755). Sequences for both species were nearly complete with the exception of several small unsequenced segments in the rat gene. Inspection of the two loci revealed that intron sizes were consistently shorter in the human gene, accounting for its significantly smaller size (191 vs. 259 kb) [Fig. 2 and supplemental Fig S1 (published as supplemental data on The Endocrine Society’s Journals Online web site at http://mend.endojournals.org)]. These sequences, which contain not only Fshr but considerable 5′ and 3′ flanking regions, were used for additional analysis of the gene.
Fig. 2. Conserved Sequences between the Human and Rat Fshr Genes.
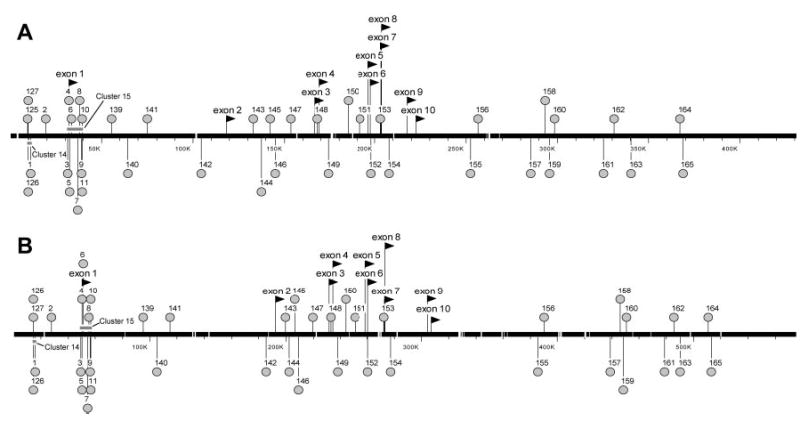
Sites of high sequence conservation (>75% identity) identified by pairwise sequence analysis between −50 kb and exon 1 of Lhcgr are annotated on a segment of the (A) human and (B) rat Fshr gene assemblies (NT_022184 and NW_04775). Exons were assigned using the Spidey mRNA-to-genomic alignment program and displayed the expected ten exon genomic structure and are noted with raised arrows above the sequence (20, 23). Each conserved sequence is annotated with a balloon that is matched on the sequence assembly for both species. The positions of masked LINE repeats are also shown as white gaps on the sequence bar and conserved site clusters are indicated as shaded rectangles above or below the base sequence.
After masking all known repetitive sequences, the alignments identified 161 conserved sequences (supplemental Table S1). To determine whether the conserved sites corresponded to any known genes or expressed sequences, the sequence of each was subjected to BLASTN analysis using both the nonredundant and expressed sequence tag (EST) databases. Of the 161 sites, only five (sites 128, 130, 131, 153, and 163) showed significant homology to entries from either GenBank database (supplemental Table S1). Spidey mRNA (http://www.ncbi.nlm.nih.gov/Sitemap/index.html) to genomic sequence alignment using ESTs homologous to sites 128, 130, and 131 demonstrated that these sites are located within Nrxn1 exons that extend further 3′ than previously identified. The conserved sequence of site 153 is nearly identical with a portion of a fetal bovine EST (BM482281) (human, 90% over 185 bp; rat, 88% over 134 bp) (supplemental Table S1). However, the remaining sequence of this EST did not align with the human or rat Fshr loci, indicating that it is not a conserved gene located within the Fshr locus. Similar analysis confirmed that a 463-bp human endochondral bone EST (CA436529) was nearly identical with a portion of site 163 (human, 98% identity over 175 bp; rat, 92% identity over 50 bp). The entire sequence of the human EST, including the conserved segment corresponding to site 163, localized to a single region in the human gene and a smaller single region of the rat gene, suggesting it may be a novel gene located within the Fshr locus. The remaining 156 noncoding, nonrepetitive sites were considered potential regulatory elements and annotated (Fig. 2, A and B, and supplemental Fig. S1).
Comparison of the annotated sequences across a representative region from 50 kb 5′ to the Fshr transcriptional start site to the first exon of the Lhcgr illustrated that the conserved sites share the same relative position on both genes and correspond to the conserved regions and colinearity observed in the global alignment of the Fshr locus (Figs. 1B and 2, A and B). Notably, the properties observed in the annotated sequences were upheld across the entire sequence (supplemental Fig. S1). In contrast to the preservation of site order, spacing between conserved sites was frequently different between the two species. For example, site 141 is 5′ to site 142 in both human and rat genes but the distance between them differs by more than 40 kb (29 kb in human vs. 71 kb in rat, Fig. 2, A and B). The level of conservation observed in the 156 sites ranged from 76–96% identity, whereas, for comparison, identity between exons ranged from 83–93% (supplemental Table S1). Beyond sequence conservation as an identifier of potential regulatory sites, another characteristic of functional importance is clustering of these sites (35, 51). Results from the pairwise analysis were used to evaluate the Fshr locus for clusters of conserved sites, defined as three or more conserved sites per 5 kb, and identified 15 clusters, all of which are located 5′ to or overlapping exon 1 (Fig. 2, A and B, and Table 1).
Table 1.
Clusters of Conserved Sequences Were Defined as at Least Three Conserved Sites Per 5-Kilobase Pairs of Genomic Sequence on both the Human and Rat Fshr Genes
| Cluster Size (bp)
|
|||
|---|---|---|---|
| Cluster | Sites | Human | Rat |
| 1 | 128, 129, 130, 131 | 1520 | 1458 |
| 2 | 34, 35, 36 | 1603 | 1601 |
| 3 | 41, 42, 43 | 1896 | 2649 |
| 4 | 45, 46, 47, 48 | 4677 | 5156 |
| 5 | 49, 50, 51 | 3117 | 3970 |
| 6 | 61, 62, 63, 64 | 4728 | 5331 |
| 7 | 67, 68, 69 | 2097 | 2773 |
| 8 | 70, 71, 72, 73 | 6054 | 8609 |
| 9 | 78, 79, 80 | 4636 | 4134 |
| 10 | 99, 100, 101, 102, 103, 104 | 7408 | 7236 |
| 11 | 110, 111, 112, 113 | 4312 | 7322 |
| 12 | 116, 117, 118, 119 | 4399 | 3641 |
| 13 | 121, 122, 123, 124 | 4732 | 5025 |
| 14 | 125, 126, 127, 1 | 2027 | 1991 |
| 15 | 3, 4, 5, 6, 7, 8, 9, 10, 11 | 8300 | 7608 |
Identification of DNase I Hypersensitivity Sites in Fshr
To further assist in the identification of potential regulatory elements, DNase I hypersensitivity mapping was used to detect regions of open chromatin that are associated with sites of protein-DNA interaction and transcriptional control. Initial mapping was performed within the 5′ flanking and intron 1 segments because this region commonly houses important regulatory elements and, in the case of Fshr, also contains the largest conserved site cluster (Table 1 and Fig. 3A). Hypersensitivity was compared between nuclei isolated from primary cultures of d 15 rat Sertoli cells, which express Fshr, and peritubular myoid cells, a nonexpressing cell type. Four hypersensitive regions were observed within the first 35 kb of 5′ flanking sequence and the first 10 kb of intron 1 (Fig. 3A). Both DHS1 and the series of eight sites designated as DHS2 were observed by Southern blot analysis of BamHI/HindIII digested DNA hybridized with Southern probe #1 (SP1; Fig. 3, A and B). DHS1 mapped to the Fshr proximal promoter region and DHS2 extended from the 3′ end of exon 1 into the first intron over approximately 400 bp of genomic sequence. Importantly, both sites were only observed in Sertoli cell samples, correlating the sites to active transcription. DHS1 and DHS2 were also observed as two closely migrating bands in PstI digested DNA hybridized with Southern probe #2 (SP2; Fig. 3, A and C). DHS3 was detected in DNA samples digested with PstI/BamHI and hybridized with Southern probe #2 (SP2; Fig. 3, A and D). Interestingly, this site, located approximately 4 kb downstream of exon 1, was observed in samples from both Sertoli and myoid cells, but the signal was more prominent in the myoid cell nuclei. DHS4 was noted in DNA samples digested with EcoRI that were detected with Southern probe #8 (SP8; Fig. 3, A and E). This site was specific to Sertoli cells and situated approximately 22 bp upstream of exon 1. Notably, no additional hypersenstitive sites were observed between the proximal promoter and DHS4, which, together with the paucity of conserved sites, suggests that few or no regulatory elements reside in this region (Fig. 3A and data not shown). Comparison of the locations for the DNase I hypersensitive and conserved sites revealed that three of the four hypersensitive sites (DHS1, DHS2, and DHS3) mapped to sites of sequence conservation (sites 4, 5, and 7) (Fig. 3A). Colocalization of hypersensitivity and sequence conservation, two hallmarks of regulatory regions, strongly implicates DHS1–3 in the transcriptional regulation of Fshr.
Fig. 3. DNase I Hypersensitivity Mapping.
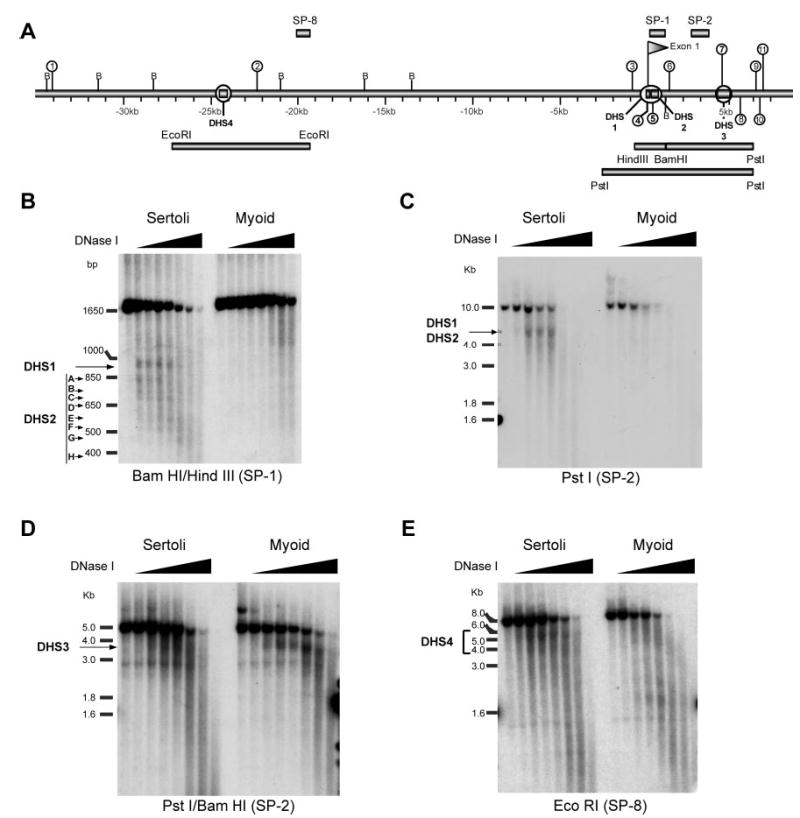
A, A 45-kb segment of the rat Fshr gene containing 35 kb of 5′ flanking sequence, exon 1 and 10 kb of the first intron was examined for sites of DNase I hypersensitivity. Probe fragments used for Southern blot analysis are shown above the gene (SP1, SP2, SP8). Restriction digest fragments examined are shown as rectangles below the gene. Conserved noncoding sequence sites located in this region are annotated as in Fig. 2. DNase I hypersensitive sites identified in this experiment are also annotated on the gene with a magnified circle (e.g. DHS1). Sertoli cell and myoid cell DNA treated with DNase I was digested with the indicated restriction endonuclease and examined by Southern blot using the indicated probe. B, BamHI and HindIII digest analyzed by Southern blot with SP1; C, PstI digest analyzed by Southern blot with SP2; D, PstI and BamHI digest analyzed by Southern blot with SP2; E, EcoRI digest analyzed by Southern blot with SP8. The positions of molecular weight markers are shown to the left of each autoradiogram. DHS sites are indicated to the left of each autoradiogram.
DHS3 and Site 7 Have Transcriptional Repressor Activity
A region containing DHS3 and site 7, one of the most highly conserved sites identified (97%), was chosen for further functional characterization using transient transfection analysis. A 700-bp fragment that contains DHS3 or a 29-bp oligodeoxynucleotide corresponding to site 7 was inserted into reporter plasmids containing either the −5-kb Fshr promoter, the core −220-bp Fshr promoter, or the simian virus 40 (SV40) promoter at different positions (5′ or 3′) relative to the promoter-reporter sequences (Fig. 4). The resulting chimeric clones were assayed by transient transfection in primary Sertoli and myoid cells. Both Fshr promoters had reduced activity in myoid cells when DHS3 was placed at the 3′ end of luciferase, but this effect was much less pronounced in Sertoli cells (Fig. 4, A and B). Site 7 repressed activity of the −5000 promoter only in myoid cells and in the 3′ position, but this silencing activity was not observed with the −220 promoter (Fig. 4, A and B). Interestingly, promoter activity was slightly elevated in Sertoli cells when site 7 was located at the 5′ end of either Fshr promoter, whereas activity of the corresponding DHS3 clone was modestly reduced (Fig. 4, A and B). Notably, reporter activity of clones containing the SV40 promoter was significantly reduced by both site 7 and DHS3 located in either the 5′ or 3′ position, but was most effected when site 7 was located in the 5′ position and tested in Sertoli cells (Fig. 4C). Taken together, these data imply that both site 7 and DHS3 house elements that repress transcriptional activity in a manner that is dependent on the promoter context, position of the elements, and the cellular environment.
Fig. 4. DHS3 and Site 7 Functional Analysis by Transient Transfection.
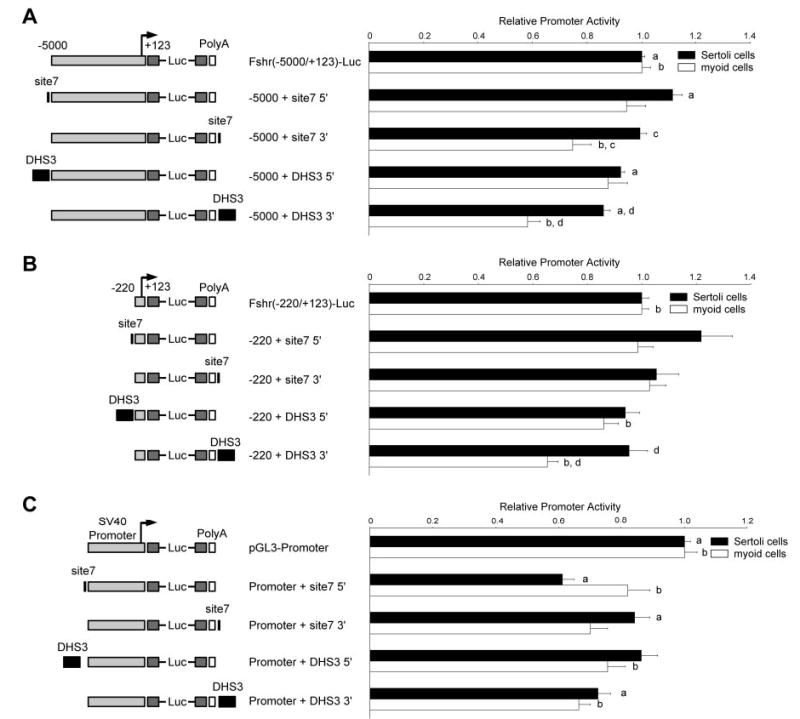
Chimeric reporter plasmids of the Fshr or SV40 promoters containing either site 7 oligodeoxynucleotides or a 700-bp DHS3 fragment were generated and activity of these reporter clones was analyzed by transient transfection into primary Sertoli cells (solid bars) and myoid cells (open bars). Activity of chimeric plasmids with inserts placed at the 5′ end of the promoter or the 3′ end of the polyadenylation (PolyA) signal is relative to A, Fshr (−5000/−123) Luc; B, Fshr (−220/−123) Luc; or C, pGL3-Promoter (SV40 promoter). Error bars reflect the se. Annotations above the bars, a, b, c, d, reflect statistically significant difference, P ≤ 0.01.
Nuclear Proteins Bind within DHS3
To facilitate identification of transcriptional repressors that bind within DHS3, in vitro DNase I footprint analysis was performed using Sertoli cell nuclear extracts. Three overlapping probe sets were generated and used to identify regions protected from DNase I digestion in the presence of Sertoli cell nuclear extracts (Fig. 5A). Protected regions were observed on both the sense and antisense strands within and immediately 5′ to the conserved sequence of site 7 (Fp1; Fig. 5B). Three additional footprinted sites were observed 5′ to site 7 on the antisense strand of probe 2 (Fp2, Fp3, and Fp4; Fig. 5C). An additional footprinted site was observed 3′ to site 7 on both the sense and antisense strands of probe 3 DHS3 (Fp5; Fig. 5D). Computer-assisted sequence analysis predicted binding sites for several transcription factors in Fp1, Fp2, Fp3, and Fp5 (Table 2). Although each of the footprinted sequences can be considered candidate sites for DHS3 activity, we chose to further investigate the proteins binding Fp1 (site 7) because its high sequence conservation and associated transcriptional activity implicates its binding proteins in the regulation of Fshr.
Fig. 5. In Vitro Footprinting of DHS3 in Sertoli Cells.
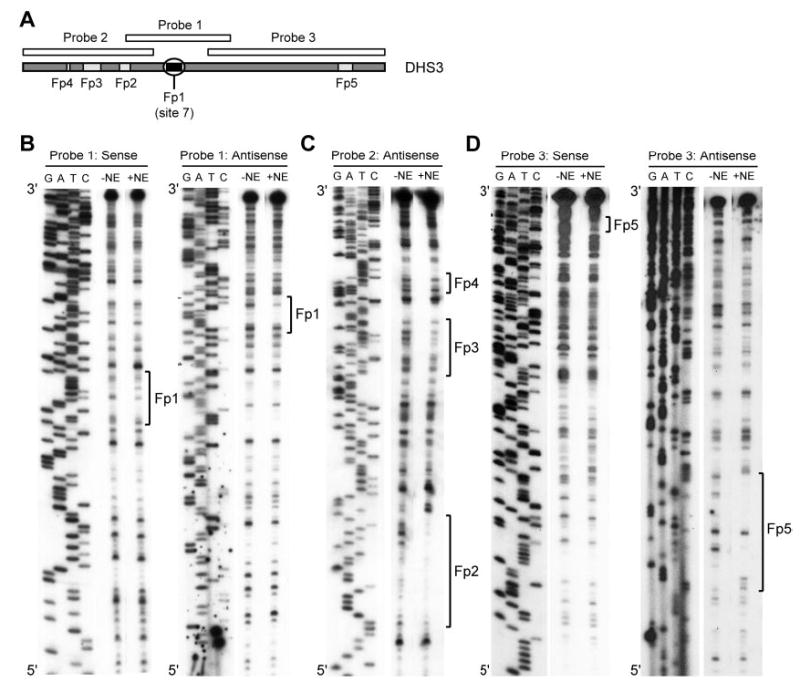
A, DNase I footprinting was performed using three probe sets with and without Sertoli cell nuclear extracts and compared with the associated sequencing ladder. Positions and relative scale of footprinted sites in DHS3 are indicated. Fp1-Fp5; footprinted sites 1–5. B, Probe set 1 with labeled sense or antisense strands; C, probe set 2 with a labeled antisense strand; D, probe set 3 with labeled sense or antisense strands.
Table 2.
Sequence of Potential Transcription Factor Binding Sites Identified in DHS3 by in Vitro DNase I Footprinting with Sertoli Cell Nuclear Extracts
| Footprint | Sequence | Notes | % Identity |
|---|---|---|---|
| 1 | AGTTGCAATCTCTTTTGA | Gata, − strand | 97 |
| C/EBP, − strand | |||
| OCT-1, − strand | |||
| GFI-1, + strand | |||
| 2 | CTGATATCATTCTTGATTTAGG | HNF6, − strand | 74 |
| 3 | AAATCTAGAAGATACTCTGGATACAATCCTTTCCT | 2 Gata-1 sites, + strand | 58 |
| Progesterone R, − strand | |||
| Oct-1, − strand | |||
| Gata-3, − strand | |||
| SRY/SOX5, + strand | |||
| 4 | AGTAAAC | N/A | 71 |
| 5 | GGGTTAAGATCCCATAGACAGATACTTTG | Meis 1, + strand | 72 |
| Gata-1, + strand | |||
| Ikaros 2, − strand | |||
| Gata-3, − strand |
The percentage of identity of each site between the rat and human sequence was determined using mVISTA alignment.
GATA-4 and OCT-1 Bind to Site 7
EMSAs using a site 7 probe identified five major binding complexes in nuclear extracts from either Sertoli cells or myoid cells (Fig. 6, A–D). Complexes 2–4 migrate to a similar position on the gel and were only clearly revealed as individual complexes when specific competitor sequences were added to the reactions (see below). Sequence analysis of site 7 (Fp1) predicted binding sites for several transcription factors, including CCAAT/enhancer binding protein (C/EBP), GATA, OCT-1, and growth factor independence 1 (GFI-1) (Fig. 6A and Table 2). Mutations within the OCT site failed to compete for complexes 1, 2 and 4 in both Sertoli and myoid cell extracts, suggesting that the proteins in these complexes bind to the OCT site (m1, m2, m7–10; Fig. 6, B–D, and G). Competition using a consensus octamer binding site (OCT) competed with complexes 1, 2, and 4 and partially with complexes 3 and 5, when combined with either Sertoli or myoid cell extracts, but not as efficiently as a wild-type site 7 competitor (Fig. 6, E and F, and Table 3) (52). Competition was eliminated by a point mutation in the OCT-1 binding site (μOCT), indicating that binding occurred within the consensus OCT site (Fig. 6, E and F, and Table 3). Therefore, complexes 1, 2, and 4 bind the OCT site in both Sertoli and myoid cells.
Fig. 6. Site 7 Transcription Factor Binding.
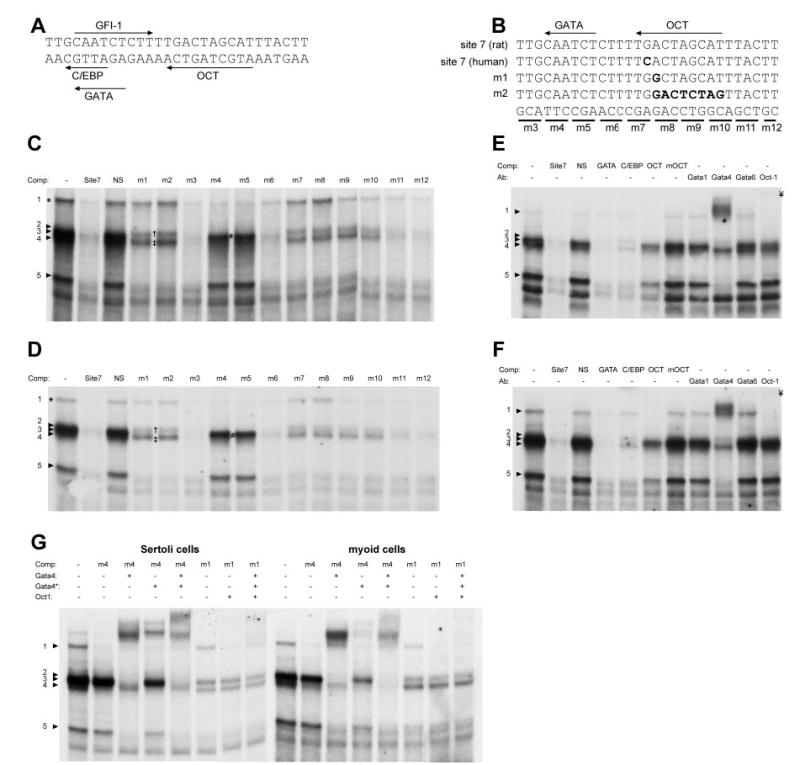
A, Binding sites in site 7 based on computer-assisted sequence analysis included GATA, OCT, C/EBP and GFI-1; B, mutations were introduced into site 7 oligodeoxynucleotides to map relevant the binding sites (see Table 3). EMSA analysis of protein binding to site 7 was performed using (C and D) Sertoli cell nuclear extracts and (E and F) myoid cell nuclear extracts. Competitor oligodeoxynucleotides and antibodies were added as noted above each autoradiogram; G, EMSAs including both mutant competitor oligodeoxynucleotides and antibodies were used to further evaluate specific binding to either the GATA or OCT sites in site 7. Two different antibodies against GATA-4 were included in these studies, GATA-4 (C-20) and GATA-4* (H-112), which recognize overlapping epitopes on the carboxy terminus of GATA-4. Numbered arrowheads, Specific binding complexes; lowercase letters, supershifted binding complexes. NS, Nonspecific oligodeoxynucleotide competitor. †, Complex 2. #, Complex 3. ‡, Complex 4. ¥, OCT-1 supershift.
Table 3.
Sequence of Oligodeoxynucleotide Probes and Competitors Used in EMSA Reactions
| Competitor | Sequence (5′–3′) |
|---|---|
| Site 7 (rat) | TTGCAATCTCTTTTGACTAGCATTTACTT |
| Site 7 (human) | TTGCAATCTCTTTTCACTAGCATTTACTT |
| m1 | TTGCAATCTCTTTTGGCTAGCATTTACTT |
| m2 | TTGCAATCTCTTTTGGACTCTAGTTACTT |
| m3 | GCACAATCTCTTTTGACTAGCATTTACTT |
| m4 | TTGTTCTCTCTTTTGACTAGCATTTACTT |
| m5 | TTGCAACGACTTTTGACTAGCATTTACTT |
| m6 | TTGCAATCTACCTTGACTAGCATTTACTT |
| m7 | TTGCAATCTCTTCGAACTAGCATTTACTT |
| m8 | TTGCAATCTCTTTTGGACAGCATTTACTT |
| m9 | TTGCAATCTCTTTTGACTCTGATTTACTT |
| m10 | TTGCAATCTCTTTTGACTAGCGCATACTT |
| m11 | TTGCAATCTCTTTTGACTAGCATTGCTTT |
| m12 | TTGCAATCTCTTTTGACTAGCATTTACGC |
| OCT consensus | TGTCGAATGCAAATCACTAGA |
| μOCT consensus | TGTCGAATGCAAGCCACTAGA |
| GATA consensus | CACTTGATAACAGAAAGTGATAACTCT |
| C/EBP consensus | TGCAGATTGCGCAATCTGCA |
| NS | CTAGAGTCGACCTGCAGGCATGCAAGCTTGGCATTC |
Mutations are shown in bold. Divergent sequence between rat and human site 7 and core binding sites in consensus competitors are underlined.
Site 7 competitors with mutations in the predicted C/EBP, GFI-1, and GATA sites (m4 and m5) failed to compete for complexes 3 and 5 in Sertoli and myoid cell extracts, revealing that an intact binding site is required for binding by these complexes (Fig. 6, B–D). With both Sertoli and myoid cell nuclear extracts, a GATA consensus site competed for complexes 2–5 as well or better than wild-type site 7 and partially competed for complex 1 (Fig. 6, E and F, and Table 3). A C/EBP consensus competitor eliminated complexes 3 and 5 but did not affect the OCT complexes (Fig. 6, E and F, and Table 3). The C/EBP competitor also contains a GATA site identical with wild-type site 7 (5′ -AGATTG-3′, − strand), suggesting that competition for complex 3 and 5 occurred through the GATA site. These data indicate that complexes 3 and 5 bind specifically to the site 7 GATA site and demonstrate that binding of complexes 1, 2, and 4 to the OCT site is diminished in the presence of the consensus GATA competitor, suggesting an affinity for sequence outside the GATA site in this competitor.
Antibodies to several GATA factors, OCT-1 and C/EBPβ, were included in the binding reactions to help identify the site 7 complexes. In both Sertoli cells and myoid cells, complex 1 cross-reacted with the OCT-1 antibody, whereas complexes 3 and 5 cross-reacted with the GATA-4 antibody (Fig. 6, E and G). To better resolve the complexes in bands 2–4 and further evaluate binding to the GATA site, additional EMSA experiments were performed combining mutant competitors and two different GATA-4 antibodies (Fig. 6G). This combination revealed two distinct bands within complex 3 (observed with the m4 competitor) that differentially interacted with the two GATA-4 antibodies (Fig. 6G). Titration of the two GATA-4 antibodies was sufficient to eliminate the lower band within complex 3 (data not shown). Binding to the OCT site was also analyzed by combining a mutant OCT site competitor (m1) with OCT-1 and GATA-4 antibodies, revealing that complexes 2 and 4 do not cross-react with these antibodies (Fig. 6G). Thus, complexes 1, 2, and 4 bind the OCT site, but only complex 1 cross-reacted with the OCT-1 antibody, leaving complexes 2 and 4 currently unidentified. Furthermore, complexes 3 and 5 bind the GATA site and GATA-4 antibodies cross-react with both complexes in both cell types.
Antibodies against C/EBPβ, GATA-1, GATA-2, GATA-3, and GATA-6 did not cross-react with any of the site 7 complexes (Fig. 6, E and F, and data not shown). Overall, the EMSA experiments implicate OCT-1, GATA-4, and two unknown OCT binding complexes in the regulation of Fshr transcription via site 7.
Different Proteins Bind Site 7, in Vivo
Chromatin immunoprecipitation (ChIP) analysis was employed to analyze transcription factor binding to the site 7/DHS3 silencer, in vivo. Formaldehyde cross-linked chromatin from d 15 primary rat Sertoli cells and myoid cells was used for immunoprecipitation with antibodies to several members of the GATA transcription factor family, OCT-1, and CCAAT/enhancer binding protein β (C/EBPβ). With chromatin prepared from myoid cells, eluate from OCT-1 immunoprecipitation was significantly enriched for DNA containing site 7 (Fig. 7A). In contrast, no such enrichment was observed with chromatin prepared from Sertoli cells (Fig. 7B). Immunoprecipitation for OCT-1 did not enrich eluates with DNA from sequences located 6 kb upstream of the Fshr transcriptional start site in either cell type, demonstrating the specificity of the site 7 interaction (Fshr-6kb; Fig. 7). In addition, eluates from immunoprecipitation of GATA-1 were consistently enriched for site 7 DNA in Sertoli cell chromatin (Fig. 7). Although less consistent, enrichment of site 7 was observed in both cell types with GATA-4 immunoprecipitation and in myoid cells with GATA-1 immunoprecipitation (data not shown).
Fig. 7. Differential Transcription Factor Binding to Site 7, in Vivo.
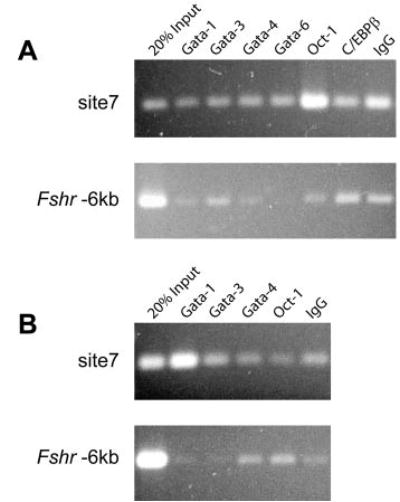
ChIP was employed to analyze transcription factor binding to site 7/DHS3 in (A) primary rat myoid cells and (B) Sertoli cells, in vivo. A region located 6 kb upstream of the Fshr transcriptional start site was analyzed as a negative control in (A) myoid cells and (B) Sertoli cells. Antibodies to several members of the GATA family of transcription factors, OCT-1, and C/EBPβ were compared with normal goat IgG in separate immunoprecipitations in both cell types.
Mutations in Site 7 Eliminate Repression
To test the relevance of the implicated transcription factors to site 7 function, activity of reporter plasmids containing mutations within site 7 were compared with their wild-type counterparts (Fig. 8A). Activity of chimeric reporters derived from the Fshr (−5000/−123) promoter containing mutations in either DHS3 or site 7 was analyzed by transient transfection in both primary Sertoli cells and myoid cells. Mutation in either the GATA site (m4) or OCT site (m8) significantly attenuated the silencing activity of site 7 when tested in myoid cells but had no impact on promoter activity in Sertoli cells (Fig. 8A). Likewise, silencing activity was attenuated when these same mutations (m4, m8) were introduced into DHS3, but promoter activity was not completely restored with either mutation alone (Fig. 8B). Transient transfection experiments in two additional cell types, mouse MA-10 Leydig cells and αT3 gonadotropes, revealed that DHS3 functioned as a silencer in chimeric reporters containing the SV40 promoter (Fig. 8C). Furthermore, this activity was attenuated by mutation in the GATA site (m4) or OCT site (m8). The results indicate that gene silencing by DHS3 and site 7 occurs in multiple Fshr nonexpressing cell types, involves a GATA factor and OCT-1, and requires either combined contributions from these factors or other proteins that bind the silencing element.
Fig. 8. Silencing Activity Requires the GATA and OCT Sites.
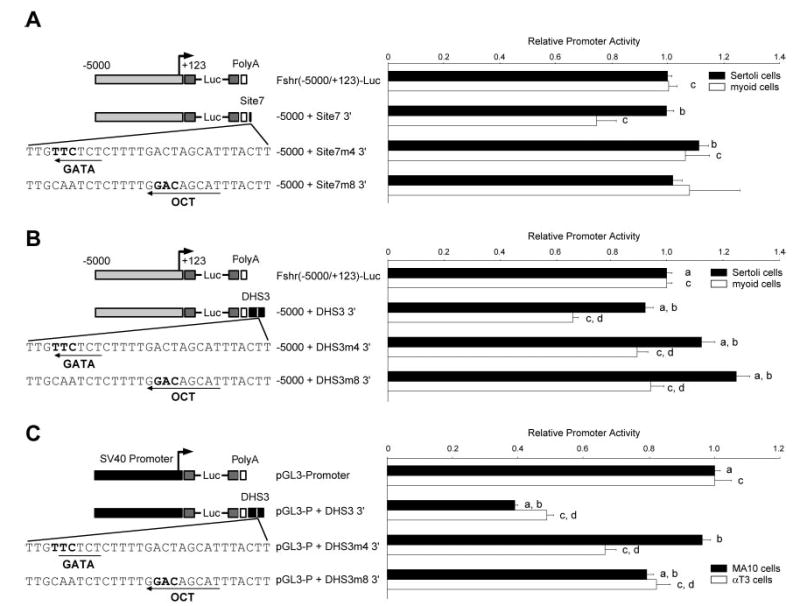
Chimeric reporter plasmids of the Fshr (−5000/−123) promoter containing either wild-type or mutant (A) site 7 oligode-oxynucleotides or (B) DHS3 positioned at the 3′ end of the polyadenylation (PolyA) signal were analyzed by transient transfection into primary Sertoli cells (solid bars) and myoid cells (open bars). C, Silencing activity was also analyzed using chimeric reporter plasmids of the SV40 promoter (pGL3-Promoter) and DHS3 in the MA-10 leydig and αT3 gonadotrope cell lines. Promoter activity is relative to Fshr (−5000/−123) Luc or pGL3-promoter. Error bars reflect sem. Annotations above the bars, a, b, c, d, reflect statistically significant difference, P ≤ 0.05.
DISCUSSION
The current availability of whole-genome sequences for various species and advances in computational sequence analysis has greatly expanded our ability to understand genomic structure, function, and evolution. Comparative genomics, the direct comparison of sequences from evolutionarily distinct species, helps identify important genome features based on sequence similarity (reviewed in Ref. 41). Because conserved sequences coincide with functional regions of the genome, such comparative data provide important insight into the relevance of gene location and the roles of coding and noncoding sequences. In terms of gene regulation, the same evolutionary pressures that maintain coding sequence also preserve cis-regulatory sequence. The characteristic of sequence conservation, together with the growing expanse of genome data, has propelled the use of comparative genomics as a means to identify novel cis-regulatory sequences (42, 44). It is certain that application of such computational approaches will facilitate rapid sorting of the functional and nonfunctional segments of the genome and identify critical elements important for transcriptional control.
Classically, DNase I hypersensitivity has been the experimental strategy of choice for mapping gene regulatory elements, and in particular this approach has been very useful for identifying promoter regions, matrix-attachment regions, enhancers, locus control regions, silencers, and insulators (53–57). But, the difficulty of identifying adequate southern blot probes and obtaining accurate restriction endonuclease maps have been major technical limitations of this technique, making DNase I hypersensitivity mapping experiments exceptionally time-consuming and tedious (58). However, with complete genome sequences now available for various species, restriction maps can be computer generated and Southern blot probes selected and generated based on their position and sequence properties. So, with the current genome sequence information, DNase I hypersensitivity mapping is now technically much easier and can be applied across significantly larger genomic regions.
Two recent studies have applied DNase I hypersensitivity on a genome-wide scale to map the positions of transcriptional regulatory elements across every gene, which provided valuable data for predicting the location of regulatory elements within any given gene locus (35, 51). Both of these studies clearly demonstrated that clusters of focal chromatin perturbations (active chromatin sites) can predict DNase I hypersensitive sites (DHSs), and thus, genetic regulatory elements. Precedent for this connection between clustering of active chromatin sites, DHSs, and transcriptional control in metazoan gene regulation is found in studies in Drosophila melanogaster that linked clustering of computationally predicted transcription factor binding sites to bona fide regulatory sites, in vivo (59–61). Sabo et al. (35) extended computational and cluster-based prediction of regulatory sites using conserved noncoding sequences to predict the location of DHSs, especially those found distal to the transcriptional start site of a gene. These studies provide convincing evidence that the ease and accuracy of identifying novel gene regulatory elements can be bolstered using a combination of comparative genomics, conserved sequence clustering and DNase I hypersensitivity mapping.
The transcriptional regulatory mechanisms controlling cell-specific and temporal expression of Fshr have been elusive to date. Previous studies have focused on the first 5000 bp of 5′ flanking sequence (5000-bp Fshr promoter) and identified several regulatory elements and transcription factors essential for basal transcription of Fshr (28–33). These and other studies have also shown that this region is insufficient to regulate Fshr expression in the proper cell-specific and temporal fashion (29, 30, 34). Therefore, critical elements needed for appropriate Fshr expression must be located outside of this region. This finding is not surprising considering recent studies that indicate cis-regulatory sequences are often located outside the immediate 5′ flanking region of a gene, with many positioned quite distal to the promoter (>50 kb) (35). To help identify such distal regulatory sequences, we employed comparative genomics to define all evolutionarily conserved sites spanning the Fshr locus. Outside of the 5000-bp promoter, a tremendous number of conserved sites (153) were identified in the nearly 1.4 and 1.2 Mb of rat and human genomic sequence examined, respectively.
Although comparative genomics is an invaluable initial screen for regulatory element identification, the number of potential sequences can, as with the Fshr locus, still be formidable. Therefore, including additional criteria to select important functional sites is necessary, especially when the sequence of the locus is so large. In the case of Fshr, we used two additional criteria to help select sites of greatest interest and, therefore, those that would be studied further. The first requirement was the presence of clusters of conserved sites, 15 of which were found across the Fshr locus, comprising 62 of the 156 conserved sites identified by comparative genomics. The second condition was the presence of sites hypersensitive to DNase I cleavage, which, thus far, has been applied to a small portion of the Fshr locus. DNase I hypersensitivity mapping was only employed on a 45-kb segment at the 5′ end of the Fshr locus for the purpose of confirming the selection criteria, but this analysis continues and is expected to identify additional regulatory sites.
DHS1–3 were found to fit the criteria for both sequence conservation and location within conserved clusters and are therefore all good candidates for further evaluation. DHS1 and DHS2 were only found in expressing cells, suggesting they participate in Fshr transcription. More specifically, DHS1 corresponds to the proximal promoter and has been studied extensively, making further analysis unnecessary (30). The series of eight hypersensitive sites within DHS2 overlap conserved sequence site 5, hinting that they correspond to a series of distinct transcription factor binding sites, which are occupied when Fshr is expressed, including those found within conserved site 5. Computer-assisted sequence analysis predicted numerous transcription factor binding sites at distinct foci across DHS2, confirming that this site is a good candidate regulatory site. Further evaluation of DHS2 and site 5 is needed confirm to their role in Fshr regulation. The lack of conserved sequence colocalization with DHS4 demonstrates that initial selection based solely on regulatory sequence conservation is insufficient to predict the location of all hypersensitive sites. In this case, DHS4 may represent a regulatory element that is unique to the rat or a transcription factor binding site that contains divergent sequence between human and rat.
Application of our selection criteria provided strong support for site 7 and DHS3 in transcriptional control of Fshr. DHS3 was prominent in nonexpressing myoid cells, which suggests that it participates in the mechanisms that restrict Fshr expression. The combination of the high degree of sequence conservation in site 7 and hypersensitivity properties of this region made it of particular interest for additional functional studies. Therefore, this region was selected for further characterization, which demonstrated its importance in silencing of Fshr transcription. Transcriptional analysis of DHS3 and site 7 by transient transfection revealed their silencing activity that, interestingly, was dependent upon three specific conditions. First, activity of both the 5000- and 220-bp Fshr promoters was repressed by DHS3 in nonexpressing myoid cells, but repression was significantly less in Sertoli cells. This finding suggests that silencing activity of DHS3/site 7 is absent or blocked in Sertoli cells (Figs. 4, 8, and 9). Second, activity of the heterologous SV40 promoter is repressed by DHS3 in both in Sertoli and myoid cells, suggesting that the lack of silencing observed for the Fshr promoter in Sertoli cells is dependent upon the promoter sequence. Thus, it appears that the SV40 promoter lacks regulatory elements in the Fshr promoter that block promoter repression by DHS3/site 7 in Sertoli cells. Lastly, maximal silencing of the Fshr promoter was observed when DHS3 was placed 3′ to the luciferase reporter, indicating that element position relative to the promoter was relevant to silencer function.
Fig. 9. Model of Fshr Transcriptional Silencing by Site 7/DHS3.
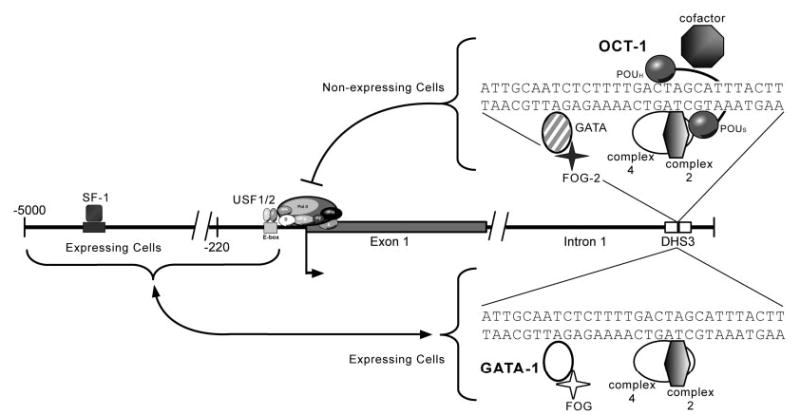
Transcription factors binding to site 7 within DHS3 play a role in silencing transcription of Fshr. A repressor complex, including OCT-1 and a GATA family member, binds the silencer element and silences Fshr transcription in nonexpressing cells, likely involving the action of cofactors. Recent studies in yeast suggest that silencing is accomplished by reducing the occupancy of RNA polymerase II transcription factors B and E (TFIIB and TFIIE) at the transcriptional start site. Conversely, in expressing cells, site 7/DHS3 is not bound by the OCT-1 repressor, but instead is bound by GATA-1. In this case, OCT-1 binding is prohibited by proteins bound to the Fshr promoter and GATA-1 binds passively, although the role of GATA-1 is unclear. Thus, selective silencer attenuation in Sertoli cells and granulosa cells occurs via interaction between the silencer element and the Fshr promoter and is an essential component of the mechanism that restricts Fshr transcription to those two cell types.
Because DHS3/site 7 silencing activity was observed in both myoid and Sertoli cells, it was not surprising that the profile of proteins binding the silencer was similar in the two cell types, in vitro. Within site 7, two complexes bound to the GATA site, and three complexes bound to the OCT site. EMSA analysis using a combination of binding site competition and antibodies determined that GATA-4, OCT-1, and two unidentified proteins bind to site 7, suggesting that silencing activity may involve any of these transcription factors (Figs. 6 and 9). The competitions, however, revealed some apparent inconsistencies in that consensus C/EBP and OCT sequences also competed for GATA-4 binding to site 7. However, GATA-4 efficiently bound each of these competitors in EMSA experiments, making it unlikely that OCT-1 or C/EBP bind the site 7 GATA site (data not shown).
To help validate the role of the implicated transcription factors, ChIP was employed to examine OCT-1 and GATA-4 binding in vivo. We found that proteins binding to site 7 differed between myoid and Sertoli cells, suggesting that differential protein binding is responsible for differences in transcriptional activity of endogenous Fshr and in silencing activity observed by transient transfection analysis (Figs. 4 and 7–9). In myoid cells, only OCT-1 was consistently observed bound to site 7, whereas in Sertoli cells, GATA-1, not OCT-1, was bound to the silencer region (Fig. 7). The finding that OCT-1 binding was restricted to the Fshr-negative cells further supports its role in gene silencing and also suggests that the less prominent hypersensitivity of DHS3 in Sertoli cells reflects the absence of OCT-1 and attenuated silencing activity of the endogenous gene. On the other hand, GATA-1 binding to site 7/DHS3 was largely limited to Sertoli cells, wherein Fshr is transcriptionally active, suggesting that GATA-1 protects Fshr from silencing. Moreover, the observation that OCT-1 is absent from site 7 in Sertoli cells suggests its binding is blocked. The block in OCT-1 binding may be induced by proteins bound to the proximal promoter, which is consistent with the transient transfection data, or by GATA-1, which is bound to the endogenous site 7 in Sertoli cells. The transfection data showed that promoter and cell context strongly influence silencing and indicated that, in Sertoli cells, the Fshr promoter is not permissive for silencing. The finding that mutation of the GATA site had no impact on silencing the Fshr promoter in Sertoli cells (Fig. 8) suggests that GATA-1 does not act to block OCT-1 binding, but rather plays more of a protective role in maintaining attenuated silencing in Sertoli cells. Although additional studies are clearly needed to identify the precise mechanism of site 7 silencing, the data currently support a mechanism whereby, in Sertoli cells, Fshr promoter-bound proteins prevent OCT-1 binding and limit silencing, whereas other promoters (i.e. SV40) permit binding of OCT-1, which acts together with GATA proteins to induce silencing (Fig. 9). In other cellular contexts (Fshr nonexpressing cells), OCT-1 is free to bind regardless of the promoter.
Despite the robust binding observed in vitro, in vivo binding of GATA-4 was not consistently observed in either cell type (Figs. 6 and 7 and data not shown). One possible explanation for this finding is that other GATA factors play a role in Fshr transcriptional regulation, in vivo, despite the observed GATA-4 binding, in vitro. This prediction is supported by the observation that GATA-1 was bound in vivo to site 7 in Sertoli cells (Fig. 7). Alternatively, the inconsistent GATA-4 ChIP data may reflect technical problems with the assay. In particular, inadequate efficacy of the GATA-4 antibody may have limited efficient GATA-4 immunoprecipitation under the employed conditions, making detection of bound complexes difficult. This may be especially relevant if GATA-4 binds the silencer weakly or its occupancy level is low. Thus, GATA-4 may be relevant to site 7/DHS3 silencing, but the inconsistent ChIP results preclude confirmation of its importance. Consequently, the inconsistent ChIP analysis of GATA factors in myoid cells, necessitates further studies to identify the relevant site 7-binding GATA protein in these cells.
The observation that silencing activity was present in several nonexpressing cell types (peritubular myoid cells, αT3 gonadotropes, MA10 Leydig cells) suggest that the functioning repressor complex is also widely expressed. The primary component of the repressor is OCT-1. Other proteins that are implicated in this complex by virtue of in vitro binding to site 7 are GATA-4 and two other unidentified factors that bind the OCT site (Fig. 6). Although GATA-4 is present in several embryonic and adult tissues, including testis and ovary, it is not ubiquitously expressed (Ref. 62; mouse GATA-4 UniGene). In fact, known GATA-4 target genes have highly restricted expression patterns (63–65). Therefore, any GATA-4 binding to site 7 is likely involved in the repression of Fshr only in a subset of tissues through interactions with other transcription factors and cofactors that also have restricted expression patterns. In particular, friend of GATA-1 and -2 (FOG-1 and -2), cofactors for GATA-4 have been shown to mediate GATA-4-dependent repression of target genes (64). In tissues that are GATA-4 negative, however, other GATA binding factors likely substitute for GATA-4, binding to site 7, by virtue of nearly identical DNA binding properties, and silencing Fshr transcription (66, 67). Therefore, the site 7 repressor complex is likely to contain different GATA family members in different tissues, each of which contributes to Fshr gene silencing in a given tissue.
Unlike GATA-4, OCT-1 is expressed ubiquitously, but like GATA-4, it also plays a role in both gene activation and silencing (68). As an activator, OCT-1 is critical for expression of housekeeping genes such as histone H2B and thymidine kinase (reviewed in Ref. 69). As a repressor, OCT-1 participates in the regulation of cell- and tissue-specific genes. For example, OCT-1 has been implicated in silencing of TSHβ subunit, GnRH, GnRH receptor, pituitary transcription factor 1 (PIT1)/GH factor 1 (GHF1), von Willebrand factor and B29 (Igβ) expression through a C-terminal ala-nine-rich repressor domain (70–75). Cross talk with other transcription factors that have more restricted expression patterns, such as GATA family members and C/EBP binding factors, is key to modulating OCT-1 repressor activity and likely contributes to regulated Fshr silencing through site 7 (75, 76).
Another key component of the mechanism that modulates OCT-1 functional activity is DNA binding conformation. OCT-1 is a member of the POU homeodomain family of transcription factors, a group of modular proteins containing two separate DNA binding domains, the Pit1 Oct and Unc86 (POU)-specific domain (POUS) and POU homeodomain (POUH) which bind separately and cooperatively to the octamer site (reviewed in Ref. 69). In some cases, tissue-specific coactivation of OCT-1 target genes occurs as a result of alternative DNA binding conformations of POUS and POUH facilitated by cofactor recruitment (reviewed in Ref. 69). A similar mechanism involving corepressors must also potentiate OCT-1 repressor activity in a tissue-specific manner. Thus, the mechanism of Fshr transcriptional silencing by DHS3/site 7 likely involves binding of a repressor complex in non-expressing cells, including OCT-1 and a GATA family member (Fig. 9). Based on recent studies in yeast, the repressor complex likely mediates transcriptional silencing by reducing RNA polymerase II transcription factors B and E (TFIIB and TFIIE) occupancy at the transcriptional start site (77). In cells that express Fshr, GATA-1 binds the endogenous silencer and OCT-1 does not. Moreover, silencer function, as indicated by transient transfection, is influenced by proteins bound to the proximal promoter, suggesting an effect on either protein binding or function. A mechanism consistent with both the in vitro and in vivo data predicts that proteins bound to the Fshr proximal promoter limit binding of OCT-1 to site 7 in Sertoli cells and prevent silencing. In these cells, GATA-1 appears to play a more passive role, perhaps in maintaining a protective chromatin confirmation to prevent silencing because its binding to the silencer in transient transfections did not impact Fshr promoter activity (Fig. 9). However, when the promoter or the cellular context is changed, the repertoire of proteins at the promoter does not antagonize silencing, OCT-1 is free to bind, and together with a GATA protein, it silences gene activity.
In summary, this study provides the first comparative sequence analysis of the Fshr locus and identified 156 conserved sequences that serve as candidate regulatory sites to provide an important starting point for future studies examining Fshr transcriptional regulation. It also has important implications for elucidating the mechanisms involved in regulating genes in Sertoli and granulosa cells, implying that one mechanism for restricting expression of genes to these cells involves derepression of globally silenced genes. For a given Sertoli cell-specific gene, silencing may be reversed only in these cells as a means to ensure complete restriction of the gene’s expression. Thus, cell specificity likely involves the coordinate efforts of gene activation and attenuated silencing. Extension of our analysis of the Fshr gene and application of this approach to other genes in Sertoli cells should provide similar insight and facilitate our understanding of the regulatory mechanisms that establish the characteristics of Sertoli cells and granulosa cells.
MATERIALS AND METHODS
Experimental Animals
All experiments in this study using animals were performed in accordance with the National Institutes of Health guidelines for the care and use of laboratory animals.
Whole Genome Alignment Analysis
The LAGAN precomputed whole genome alignment of the human assembly (April 2003 Human Genome Assembly, NCBI Build 33, UCSC: hg15) and the rat assembly (January 2003) available on the VISTA Genome Browser (http://pipe-line.lbl.gov) through the Berkeley Genome Pipeline was used to visualize the windowed-average sequence identity score for alignment of the Fshr locus between Lhcgr and Nrxn1 using the program’s default parameters (46–48). A roughly 1.27-Mb segment of the rat and human alignment is shown in Fig. 1 (chromosome 2, bases 48894289–50162401).
Assembly and Annotation of the Rat and Human Fshr Gene Sequences
The sequence of the rat Fshr gene spanning from the 5′ end of Lhcgr exon 1 to the 3′ end of the Nrxn1 exon 21 was extracted from a single genomic supercontig (accession no. NW_04775, bases 1605430–3004772) identified in GenBank by the NCBI Entrez Nucleotide search engine (http://www.ncbi.nlm.nih.gov/entrez/query.fcgi?db=Nucleotide). Human FSHR spanning the same region (LHCGR to NRXN1) was extracted from a single chromosome 2 genomic contig (accession no. NT_022184, bases 27798750–28963419). Repetitive sequences were identified using the Repeatmasker web server (http://www.repeatmasker.org/). Sequence alignments of the rat and human Fshr loci were performed using pairwise BLAST analysis through the NCBI web site (http://www.ncbi.nlm.nih.gov/; Ref. 78) and the program’s default parameters (cost to open a gap [5] cost to extend a gap [2], penalty for a mismatch [−2], reward for a match [1], expectation value (E) [10], Word size, 11 for BLASTN). All sequences having greater than 75% identity were annotated using the Discovery Studio Gene version 1.1 software (Accelrys, Inc., San Diego, CA) and indicated as sites 1–165. Each site was used individually as input sequence for BLASTN analysis using the nonredundant and EST databases of GenBank. All identified sequences are noted in supplemental Table S1. Exons were assigned using the Spidey mRNA-to-genomic alignment program within NCBI (http://www.ncbi.nlm.nih.gov/Sitemap/index.html#Spidey) and displayed the expected ten exon genomic structure as previously reported (20, 23) (Fig. 2 and supplemental Fig. S1). Conserved site clusters were identified manually with the threshold of three sites per 5-kb genomic sequence.
DNase I Hypersensitivity Mapping
Primary cultures of rat Sertoli and myoid cells were prepared as previously described (29, 79, 80). DNase I hypersensitivity mapping was performed as described with modifications (81, 82). Ten 150-mm plates of primary Sertoli cells (~5.5 × 10⁶ cells/plate), and four plates of myoid cells were used per experiment. Cells were rinsed with cold PBS, removed from the plate by scraping, and pelleted by centrifugation at 2100 rpm for 5 min at 4 C. The supernatant was removed and 14 ml of cold resuspension buffer solution [10 mm Tris (pH 7.5), 10 mM NaCl, 3 mM MgCl2] was added to the pellet. While slowly vortexing, the cell suspension 375 μl of 10% Nonidet P-40 was added drop-wise. Three 5-μl aliquots were diluted in 95 μl 1% sodium dodecyl sulfate (SDS), and the absorbance at 260 nm was determined for a rough estimate of DNA concentration. The nuclei were then pelleted at 2100 rpm for 10 min, the supernatant removed, and nuclei resuspended at a DNA concentration of 1 mg/ml in resuspension buffer. DNase I (Worthington DNase I DPRF LS006333) ranging from 0–5.0 U was added to 200 ml nuclei and incubated for 10 min at 37 C, and the reaction was stopped by adding 230 μl stop buffer [220 μl 2× lysis buffer; 1% SDS, 600 mm NaCl, 10 mm EDTA, 20 mm Tris (pH 7.5); 10 μl 20 mg/ml proteinase K]. Samples were then incubated overnight at 37 C and the DNA was extracted with phenol:chloroform (1:1) twice, collected by precipitation with 1 ml 100% EtOH and centrifugation, washed with 70% EtOH, resuspended in TE [10 mm Tris (pH 7.5), 0.25 mm EDTA], and heated to 55 C to bring the DNA into solution. The isolated DNA was subjected to restriction digestion followed by resolution using agarose gel electrophoresis, and the fragments were subjected to Southern blot analysis using various probes directed against rat Fshr (indicated in Fig. 3). DNA used for probes was labeled using the Random Primer Extension Labeling System (NEN Life Science Products, Inc., Boston, MA) and α-32P-deoxy-CTP according to the manufacturer’s recommendation. Southern blot analysis was performed as described using Magnagraph nylon membranes (GE Osmonics, Inc., Minnetonka, MN) (83, 84).
Reporter Clone Construction
A 700-bp fragment corresponding to DHS3 was amplified by PCR using the primers DHS3 For 5′-GCGCGGATCCGCT-TCAGTTGGAGGTAGCCGCC-3′ and DHS3 Rev 5′ -GCGCG-GATCCCTCATGGTTCCCGCCAAGAAG-3′ from rat genomic DNA using Bio-X-Act DNA polymerase and a touchdown cycle (94 C denaturing temperature, ramped annealing temperature from 70 C to 56 C over 26 cycles, 72 C extension; 10 additional cycles of amplification at 56 C annealing temperature). The DHS3 PCR product was digested with the restriction endonuclease BamHI and half of the reaction was reserved for cloning. In the remainder of the reaction, the BamHI overhangs were filled in with Klenow fragment (Roche Diagnostics, Basel, Switzerland) according to the manufacturer’s recommendations. Dousble-stranded site 7 oligos were generated by combining oligodeoxynucleotides site 7.1 5′ -TTGCAATCTCTTTTGACTAGCATTTACTT-3′ and site 7.2 5′-AAGTAAATGCTAGTCAAAAGAGATTGCAA-3′ at equimolar concentration in annealing buffer [10 mm Tris (pH 7.5), 0.1 m NaCl, 1 mm EDTA], boiled for 5 min, allowed to cool to 4 C and phosphorylated using T4 polynucleotide kinase (New England Biolabs, Beverly, MA) according to manufacturer’s recommendations. The Fshr(−5000/−123)Luc, Fshr(−220/−123)Luc (29), and pGL3-Promoter (Promega Corp., Madison, WI) reporter clones were linearized by digestion with either KpnI or BamHI, followed by blunting part of each reaction with Klenow (Roche) according to the manufacturer’s recommendations and treatment of all reactions with calf intestinal phosphatase (New England Biolabs) according to manufacturer’s recommendations. 5′ -End clones were generated by ligating either the blunted DHS3 PCR product or double-stranded site 7 oligo into KpnI-blunted reporter clones using Quick Stick Ligase (Bioline USA, Randolph, MA). 3′ -End clones were generated by ligating DHS3 in BamHI digested vectors or double-stranded site 7 oligos into BamHI-blunted vectors in the same way as 5′ -end clones.
Cell Culture and Transient Transfection
Preparation and transient transfection of d 15 primary rat Sertoli cells was performed as described elsewhere (85). Preparation and transient transfection of peritubular myoid cells was performed as described except that 1 μl of PLUS reagent (Invitrogen Corp., Carlsbad, CA) was included in each transfection (80). Preparation and transient transfection of mouse MA-10 Leydig cells (90) was performed as described, except that cells were plated at a density of 52,000 cells/well and an SV40-Renilla control plasmid was used (86). Preparation and transient transfection of the αT3 gonadotrope cells (87) was performed as described with modifications (88). Cells were plated at a density of 47,500/well in 24-well plated and transfected with 300 ng of luciferase reporter plasmid and 1.75 μl of lipofectamine (Invitrogen). Transfection efficiency was controlled for by including 20 ng (Sertoli cells) or 15 ng (myoid cells) of phRL-TK (Promega Corp.), or 10 ng (MA-10 cells and αT3 cells) of SV40-Renilla (Promega Corp.), which express Renilla luciferase from the hSV-TK and SV40 promoters, respectively. Unless otherwise stated, Sertoli and myoid cells were transfected with 0.2 and 0.1 μg, respectively, of Fshr-luciferase constructs or the SV40-luciferase constructs generated from pGL3-Promoter. Likewise, MA-10 and αT3 cells were transfected with 0.1 and 0.4 μg of luciferase reporter. Sixty hours after transfection, cells were lysed and assayed for both firefly and Renilla luciferase activities using the dual-luciferase reporter assay system (Promega Corp.) as described previously (85, 86). The data are presented as the firefly/Renilla luciferase activity ratio of chimeric Fshr or SV40-luciferase constructs relative to the firefly/Renilla luciferase activity ratio of the promoter-alone construct. Significance was determined using a two-tailed heteroscedastic Student’s t test comparing the relative data. All plasmid DNAs were prepared from overnight bacterial cultures using the QIAwell eight-plasmid kit according to the supplier’s recommendations and endotoxin-free reagents (QIAGEN, Valencia, CA).
DNase I Footprint Analysis
The preparation of nuclear extracts and the method to generate DNA probes were as described elsewhere (85, 86). To generate sense probes, the 5′ primers DHS3 for2, DHS3 for, and DHS3 for3 were radiolabeled by T4 polynucleotide kinase (New England Biolabs, Inc.) and used with the 3′ primers DHS3 rev3, DHS3 rev2, and DHS3 rev to amplify sense probe 1, 2, and 3, respectively (Table 4). For antisense probes, the 3′ primers primers DHS3 rev3, DHS3 rev2, and DHS3 rev were radiolabeled and used with the 5′ primer DHS3 for2, DHS3 for, and DHS3 for3 to amplify antisense probe 1, probe 2, and probe 3, respectively (Table 4). For both sense and antisense probes, PCR was performed using Fshr(−5000/−123)Luc + DHS3(3′) as template and Bio-X-ACT DNA polymerase, according to the manufacturer’s recommendations (Bioline). DNase I footprinting using nuclear extracts from primary cultures of Sertoli cells was performed as previously described (85). Computer-assisted sequence analysis of each footprinted site was performed using Mat-Inspector professional (version 7.0, Matrix Family Library version 4.0, November 2003), which is available online through Genomatix Suite (http://www.genomatix.de). Percent identity between the rat and human sequence of each footprinted site was determined using alignments generated with mVISTA (http://www.gsd.lbl.gov/vista/mvista/submit.shtml) across the entire DHS3 region.
Table 4.
Oligodeoxynucleotide Primers Used for Generating DNase I Footprinting Probe PCR Products and Sequencing Ladders
| Primer | Sequence (5′–3′) |
|---|---|
| DHS3 for | GCTTCAGTTGGAGGTAGCCGCC |
| DHS3 for2 | CTTGATTTAGGGAATGCTGAGC |
| DHS3 for3 | GTTGCTTGGATTAGCTCCTTC |
| DHS3 rev | CTCATGGTTCCCGCCAAGAAG |
| DHS3 rev2 | GAGAGAGTCCAACACAGGCAG |
| DHS3 rev3 | GCCTAGAGCTGTGGAATGTGG |
EMSA
EMSAs were performed as described elsewhere (85, 86). Cold competitor oligodeoxynucleotides at 100-fold molar excess (Table 3) and 2 μg of each antibody were included in the appropriate reaction mixtures before addition of nuclear extracts. Goat polyclonal anti-GATA-1 (N-1) IgG and anti-GATA-4 (C-20) IgG; mouse monoclonal anti-GATA-2 (CG2–96) IgG and anti-GATA-3 (HG3–31) IgG; rabbit polyclonal anti-GATA-4 (H-112), anti-GATA-6 (H-92) IgG, anti-OCT-1 (C-21) IgG and anti-C/EBPβ (C-19) IgG were purchased from Santa Cruz Biotechnology, Inc. (Santa Cruz, CA.).
ChIP
ChIP was performed essentially as described (89). Primary rat Sertoli cells were isolated as described (79), germ cells were removed by isotonic shock with 10 mm Tris-HCl for 2 min, washed twice with serum-free HAMS/F-12 and were resuspended in prewarmed 1× PBS. Peritubular myoid cells were plated and passaged once as described (80). To cross-link chromatin formaldehyde (Fisher Scientific, Pittsburgh, PA) was added directly to the Sertoli cell suspension or myoid cell culture media to a 1% final concentration and incubated at 37 C for 10 min. Sertoli cell cross-linking was quenched with 125 mm glycine, cells were washed twice with ice-cold 1× PBS containing the complete protease inhibitor cocktail (Roche Diagnostics, Indianapolis, IN) and resuspended in 200 μl ChIP lysis buffer [10 mm EDTA, 50 mm Tris (pH 8.1), 1% SDS, 1× complete protease inhibitor cocktail] per 106 cells. Myoid cell media was aspirated, washed twice with ice-cold 1× PBS containing the complete protease inhibitor cocktail, scraped and resuspended in 200 μl ChIP lysis buffer per 106 cells. Cell lysates were incubated on ice for 10 min and chromatin was sheared by sonication using a Vibracell VC130 ultrasonic processor (Sonics & Materials, Newtown, CT) and a stepped microtip at 40% output for ten 10-sec pulses on ice with a 5-sec cooling time on dry ice between each pulse. Sheared chromatin was cleared by centrifugation at 13K × g for 10 min at 4 C, diluted 1:10 in ChIP dilution buffer [16.7 mm Tris (pH 8.1), 167 mm NaCl, 1.22 mm EDTA, 1.1% Triton X-100, 0.01% SDS, 1× complete protease inhibitor cocktail] and stored at −80 C in 1-ml aliquots. Aliquots of undiluted chromatin were saved as 20% input samples. Diluted chromatin samples were thawed and cleared with 75 μl of salmon-sperm DNA preblocked 50% slurry of protein A-agarose (Upstate Biotechnology, Lake Placid, NY) with rotation at 4 C for 90 min. The following antibodies were purchased from Santa Cruz Biotechnology and used for immunoprecipitation: goat polyclonal αGATA-1 IgG (sc-1234X), mouse monoclonal αGATA-3 IgG (sc-268X), goat polyclonal αGATA-4 IgG (sc-1237X), rabbit polyclonal αGATA-6 IgG (sc-9055X), rabbit polyclonal αC/EBPβ IgG (sc-150X), rabbit polyclonal αOCT-1 IgG (sc-232), normal rabbit IgG (sc-2027), and normal goat IgG (sc-2028). A total of 5 μg of antibody was added to an immunoprecipitation and incubated at 4 C with rotation overnight. Immune complexes were precipitated with 60 μl salmon-sperm DNA preblocked 50% slurry protein A-agarose (Upstate) for 1 h at 4 C with rotation, washed 5 min at 4 C in 1 ml of each of the following: low-salt wash buffer [20 mm Tris (pH 8.1), 150 mm NaCl, 2 mm EDTA, 1% Triton X-100, 0.1% SDS, 1× complete protease inhibitor cocktail], high-salt wash buffer [20 mm Tris (pH 8.1), 500 mm NaCl, 2 mm EDTA, 1% Triton X-100, 0.1% SDS, 1× complete protease inhibitor cocktail], LiCl wash buffer [250 mm LiCl, 1% Nonidet P-40, 1% sodium deoxycholate, 10 mm Tris (pH 8.1), 1 mm EDTA, 1× complete protease inhibitor cocktail] and twice in TE [10 mm Tris (pH 8.0), 1 mm EDTA, 1× complete protease inhibitor cocktail]. Elution of immune complexes was performed by incubating twice in 250 μl fresh elution buffer (100 mm NaHCO3, 1% SDS) with rotation at room temperature for 15 min. To the pooled eluates and 20% input samples (diluted to 500 μl), NaCl was added to 200 mm and cross-links were reversed by incubating at 65 C for 4 h. Proteins were digested with 20 μg proteinase K for 1 h at 45 C in 9 mm EDTA, 36 mm Tris (pH 6.5). All samples were extracted once with 1 volume phenol-chloroform (1:1) and once with chloroform, precipitated with 10 μg glycogen (Ambion, Austin, TX; no. 9510) as a carrier, desalted with 70% EtOH and resuspended in 50 μl nuclease-free H2O. PCR analysis of ChIP DNA was performed using 5 μl of immunoprecipitated material or 1 μl of 20% input material using the primers site 7 ChIP3 (5′-CTGT-GTTGGACTCTCTCCTTAC-3′) and site 7 ChIP4 (5′-AAG-GAGCTAATCCAAGCAACC-3′) to detect site 7, the primers Fshr −6-kb ChIP3 (5′-GAAATAACGGGGTTGGGT-3′) and Fshr −6-kb ChIP4 (5′-GATACTTAGACTTCTTCCTTTACG-3′) to detect the negative control region, located 6 kb upstream of the transcriptional start site, with Platinum Taq DNA Polymerase (Invitrogen) and products from all reactions were resolved by agarose gel electrophoresis.
Supplementary Material
Acknowledgments
The authors thank Ning Lei, Daren Rice, Lane Christenson, and Kenneth Peterson for technical assistance and advice; Kaori Hornbaker for assistance with cell culture; and the Kansas Biomedical Research Infrastructure Network (K-BRIN) for providing access to DS Gene.
Footnotes
This work was supported by the National Institutes of Child Health & Human Development (HD35217 to L.L.H.) and a University of Kansas Medical Center Biomedical Training fellowship (to B.P.H.).
References
- 1.Themmen APN, Huhtaniemi IT. Mutations of gonadotropins and gonadotropin receptors: elucidating the physiology and pathophysiology of pituitary-gonadal function. Endocr Rev. 2000;21:551–583. doi: 10.1210/edrv.21.5.0409. [DOI] [PubMed] [Google Scholar]
- 2.Griswold MD 1993 Actions of FSH on mammalian Sertoli cells. In: Russell LD, Griswold MD, eds. The Sertoli cell. Clearwater, FL: Cache River Press; 493–508
- 3.Richards JS. Perspective: the ovarian follicle—a perspective in 2001. Endocrinology. 2001;142:2184–2193. doi: 10.1210/endo.142.6.8223. [DOI] [PubMed] [Google Scholar]
- 4.Aittomaki K, Lucena JL, Pakarinen P, Sistonen P, Tapanainen J, Gromoll J, Kaskikari R, Sankila EM, Lehvaslaiho H, Engel AR. Mutation in the follicle-stimulating hormone receptor gene causes hereditary hypergonadotropic ovarian failure. Cell. 1995;82:959–968. doi: 10.1016/0092-8674(95)90275-9. [DOI] [PubMed] [Google Scholar]
- 5.Gromoll J, Simoni M, Nordhoff V, Behre HM, De Geyter C, Nieschlag E. Functional and clinical consequences of mutations in the FSH receptor. Mol Cell En-docrinol. 1996;125:177–182. doi: 10.1016/s0303-7207(96)03949-4. [DOI] [PubMed] [Google Scholar]
- 6.Kumar TR, Wang Y, Lu N, Matzuk MM. Follicle stimulating hormone is required for ovarian follicle maturation but not male fertility. Nat Genet. 1997;15:201–204. doi: 10.1038/ng0297-201. [DOI] [PubMed] [Google Scholar]
- 7.Tapanainen JS, Aittomaki K, Min J, Vaskivuo T, Huhtaniemi IT. Men homozygous for an inactivating mutation of the follicle-stimulating hormone (FSH) receptor gene present variable suppression of spermatogenesis and fertility. Nat Genet. 1997;15:205–206. doi: 10.1038/ng0297-205. [DOI] [PubMed] [Google Scholar]
- 8.Beau I, Touraine P, Meduri G, Gougeon A, Desroches A, Matuchansky C, Milgrom E, Kuttenn F, Misrahi M. A novel phenotype related to partial loss of function mutations of the follicle stimulating hormone receptor. J Clin Invest. 1998;102:1352–1359. doi: 10.1172/JCI3795. [DOI] [PMC free article] [PubMed] [Google Scholar]
- 9.Dierich A, Sairam MR, Monaco L, Fimia GM, Gansmuller A, LeMeur M, Sassone-Corsi P. Impairing follicle-stimulating hormone (FSH) signaling in vivo: targeted disruption of the FSH receptor leads to aberrant game-togenesis and hormonal imbalance. Proc Natl Acad Sci USA. 1998;95:13612–13617. doi: 10.1073/pnas.95.23.13612. [DOI] [PMC free article] [PubMed] [Google Scholar]
- 10.Simoni M, Gromoll J, Hoppner W, Kamischke A, Krafft T, Stahle D, Nieschlag E. Mutational analysis of the follicle-stimulating hormone (FSH) receptor in normal and infertile men: identification and characterization of two discrete FSH receptor isoforms. J Clin Endocrinol Metab. 1999;84:751–755. doi: 10.1210/jcem.84.2.5500. [DOI] [PubMed] [Google Scholar]
- 11.Abel MH, Wootton AN, Wilkins V, Huhtaniemi I, Knight PG, Charlton HM. The effect of a null mutation in the follicle-stimulating hormone receptor gene on mouse reproduction. Endocrinology. 2000;141:1795–1803. doi: 10.1210/endo.141.5.7456. [DOI] [PubMed] [Google Scholar]
- 12.Danilovich N, Babu PS, Xing W, Gerdes M, Krishnamurthy H, Sairam MR. Estrogen deficiency, obesity, and skeletal abnormalities in follicle-stimulating hormone receptor knockout (FORKO) female mice. Endocrinology. 2000;141:4295–4308. doi: 10.1210/endo.141.11.7765. [DOI] [PubMed] [Google Scholar]
- 13.Krishnamurthy H, Danilovich N, Morales CR, Sairam MR. Qualitative and quantitative decline in spermatogenesis of the follicle-stimulating hormone receptor knockout (FORKO) mouse. Biol Reprod. 2000;62:1146–1159. doi: 10.1095/biolreprod62.5.1146. [DOI] [PubMed] [Google Scholar]
- 14.Krishnamurthy H, Babu PS, Morales CR, Sairam MR. Delay in sexual maturity of the follicle-stimulating hormone receptor knockout male mouse. Biol Reprod. 2001;65:522–531. doi: 10.1095/biolreprod65.2.522. [DOI] [PubMed] [Google Scholar]
- 15.Doherty E, Pakarinen P, Tiitinen A, Kiilavuori A, Huhtaniemi I, Forrest S, Aittomaki K. A novel mutation in the FSH receptor inhibiting signal transduction and causing primary ovarian failure. J Clin Endocrinol Metab. 2002;87:1151–1155. doi: 10.1210/jcem.87.3.8319. [DOI] [PubMed] [Google Scholar]
- 16.Camp TA, Rahal JO, Mayo KE. Cellular localization and hormonal regulation of follicle-stimulating hormone and luteinizaing hormone receptor messenger RNAs in the rat ovary. Mol Endocrinol. 1991;5:1405–1417. doi: 10.1210/mend-5-10-1405. [DOI] [PubMed] [Google Scholar]
- 17.Tilly JL, LaPolt PS, Hsueh AJ. Hormonal regulation of follicle-stimulating hormone receptor messenger ribonucleic acid levels in cultured rat granulosa cells. Endo-crinology. 1992;130:1296–1302. doi: 10.1210/endo.130.3.1311235. [DOI] [PubMed] [Google Scholar]
- 18.Rannikki AS, Zhang F-P, Huhtaniemi IT. Ontogeny of follicle-stimulating hormone receptor gene expression in the rat testis and ovary. Mol Cell Endocrinol. 1995;107:199–210. doi: 10.1016/0303-7207(94)03444-x. [DOI] [PubMed] [Google Scholar]
- 19.Tisdall DJ, Watanabe K, Hudson NL, Smith P, McNatty KP. FSH receptor gene expression during ovarian follicle development in sheep. J Mol Endocrinol. 1995;15:273–281. doi: 10.1677/jme.0.0150273. [DOI] [PubMed] [Google Scholar]
- 20.Heckert LL, Daley IJ, Griswold MD. Structural organization of the follicle-stimulating hormone receptor gene. Mol Endocrinol. 1992;6:70–80. doi: 10.1210/mend.6.1.1738373. [DOI] [PubMed] [Google Scholar]
- 21.Huhtaniemi I, Eskola V, Pakarinen P, Matikainen T, Sprengel R. The murine luteinizing hormone and follicle-stimulating hormone receptor genes: transcripional initiation sites, putative promoter sequences, and promoter activity. Mol Cell Endocrinol. 1992;88:55–66. doi: 10.1016/0303-7207(92)90009-u. [DOI] [PubMed] [Google Scholar]
- 22.Gromoll J, Dankbar B, Gudermann T. Characterization of the 5′ flanking region of the human follicle-stimulating hormone receptor gene. Mol Cell Endocrinol. 1994;102:93–102. doi: 10.1016/0303-7207(94)90102-3. [DOI] [PubMed] [Google Scholar]
- 23.Gromoll J, Pekel E, Nieschlag E. The structure and organization of the human follicle-stimulating hormone receptor gene. Genomics. 1996;35:308–311. doi: 10.1006/geno.1996.0361. [DOI] [PubMed] [Google Scholar]
- 24.Sairam MR, Subbarayan VSR. Characterization of the 5′ flanking region and potential control elements of the ovine follitropin receptor gene. Mol Reprod Dev. 1997;48:480–487. doi: 10.1002/(SICI)1098-2795(199712)48:4<480::AID-MRD8>3.0.CO;2-M. [DOI] [PubMed] [Google Scholar]
- 25.Tena-Sempere M, Manna PR, Huhtaniemi I. Molecular cloning of the mouse follicle-stimulating hormone receptor complementary deoxyribonucleic acid: functional expression of alternatively spliced variants and receptor inactivation by a C566T transition in exon 7 of the coding sequence. Biol Reprod. 1999;60:1515–1527. doi: 10.1095/biolreprod60.6.1515. [DOI] [PubMed] [Google Scholar]
- 26.Heckert LL, Griswold MD. The expression of the follicle-stimulating hormone receptor in spermatogenesis. Recent Prog Horm Res. 2002;57:129–148. doi: 10.1210/rp.57.1.129. [DOI] [PMC free article] [PubMed] [Google Scholar]
- 27.Mattiske D, Pask AJ, Shaw JM, Shaw G. Structure and expression of the follicle-stimulating hormone receptor gene in a marsupial, Macropus eugenii. Mol Reprod Dev. 2002;63:24–31. doi: 10.1002/mrd.10161. [DOI] [PubMed] [Google Scholar]
- 28.Goetz TL, Lloyd TL, Griswold MD. Role of E box and initiatory region in the expression of the rat follicle-stimulating hormone receptor. J Biol Chem. 1996;271:33317–33324. doi: 10.1074/jbc.271.52.33317. [DOI] [PubMed] [Google Scholar]
- 29.Heckert LL, Daggett MA, Chen J. Multiple promoter elements contribute to activity of the follicle-stimulating hormone receptor (FSHR) gene in testicular Sertoli cells. Mol Endocrinol. 1998;12:1499–1512. doi: 10.1210/mend.12.10.0183. [DOI] [PMC free article] [PubMed] [Google Scholar]
- 30.Heckert LL, Sawadogo M, Daggett MA, Chen J. The USF proteins regulate transcription of the follicle-stimulating hormone receptor but are insufficient for cell-specific expression. Mol Endocrinol. 2000;14:1836–1848. doi: 10.1210/mend.14.11.0557. [DOI] [PMC free article] [PubMed] [Google Scholar]
- 31.Heckert LL. Activation of the rat follicle-stimulating hormone receptor promoter by steroidogenic factor 1 is blocked by protein kinase a and requires upstream stimulatory factor binding to a proximal e box element. Mol Endocrinol. 2001;15:704–715. doi: 10.1210/mend.15.5.0632. [DOI] [PMC free article] [PubMed] [Google Scholar]
- 32.Levallet J, Koskimies P, Rahman N, Huhtaniemi I. The promoter of murine follicle-stimulating hormone receptor: functional characterization and regulation by transcription factor steroidogenic factor 1. Mol Endocrinol. 2001;15:80–92. doi: 10.1210/mend.15.1.0583. [DOI] [PubMed] [Google Scholar]
- 33.Xing W, Danilovich N, Sairam MR. Orphan receptor chicken ovalbumin upstream promoter transcription factors inhibit steroid factor-1, upstream stimulatory factor, and activator protein-1 activation of ovine follicle-stimulating hormone receptor expression via composite cis-elements. Biol Reprod. 2002;66:1656–1666. doi: 10.1095/biolreprod66.6.1656. [DOI] [PubMed] [Google Scholar]
- 34.Linder CC, Heckert LL, Goetz TL, Griswold MD. Follicle-stimulating hormone receptor gene promoter activity. Endocrine. 1994;2:957–966. [Google Scholar]
- 35.Sabo PJ, Humbert R, Hawrylycz M, Wallace JC, Dorschner MO, McArthur M, Stamatoyannopoulos JA. Genome-wide identification of DNaseI hypersensitive sites using active chromatin sequence libraries. Proc Natl Acad Sci USA. 2004;101:4537–4542. doi: 10.1073/pnas.0400678101. [DOI] [PMC free article] [PubMed] [Google Scholar]
- 36.Bishop CE, Whitworth DJ, Qin Y, Agoulnik AI, Agoulnik IU, Harrison WR, Behringer RR, Overbeek PA. A transgenic insertion upstream of sox9 is associated with dominant XX sex reversal in the mouse. Nat Genet. 2000;26:490–494. doi: 10.1038/82652. [DOI] [PubMed] [Google Scholar]
- 37.Lettice LA, Horikoshi T, Heaney SJ, van Baren MJ, van der Linde HC, Breedveld GJ, Joosse M, Akarsu N, Oostra BA, Endo N, Shibata M, Suzuki M, Takahashi E, Shinka T, Nakahori Y, Ayusawa D, Nakabayashi K, Scherer SW, Heutink P, Hill RE, Noji S. Disruption of a long-range cis-acting regulator for Shh causes preaxial polydactyly. Proc Natl Acad Sci USA. 2002;99:7548–7553. doi: 10.1073/pnas.112212199. [DOI] [PMC free article] [PubMed] [Google Scholar]
- 38.Novak TJ, White PM, Rothenberg EV. Regulatory anatomy of the murine interleukin-2 gene. Nucleic Acids Res. 1990;18:4523–4533. doi: 10.1093/nar/18.15.4523. [DOI] [PMC free article] [PubMed] [Google Scholar]
- 39.Holtzman EJ, Soper BW, Stow JL, Ausiello DA, Ercolani L. Regulation of the G-protein α i-2 subunit gene in LLC-PK1 renal cells and isolation of porcine genomic clones encoding the gene promoter. J Biol Chem. 1991;266:1763–1771. [PubMed] [Google Scholar]
- 40.Rai T, Uchida S, Marumo F, Sasaki S. Cloning of rat and mouse aquaporin-2 gene promoters and identification of a negative cis-regulatory element. Am J Physiol. 1997;273:F264–F273. doi: 10.1152/ajprenal.1997.273.2.F264. [DOI] [PubMed] [Google Scholar]
- 41.Frazer KA, Elnitski L, Church DM, Dubchak I, Hardison RC. Cross-species sequence comparisons: a review of methods and available resources. Genome Res. 2003;13:1–12. doi: 10.1101/gr.222003. [DOI] [PMC free article] [PubMed] [Google Scholar]
- 42.Nobrega MA, Ovcharenko I, Afzal V, Rubin EM. Scanning human gene deserts for long-range enhancers. Science. 2003;302:413. doi: 10.1126/science.1088328. [DOI] [PubMed] [Google Scholar]
- 43.Spitz F, Gonzalez F, Duboule D. A global control region defines a chromosomal regulatory landscape containing the HoxD cluster. Cell. 2003;113:405–417. doi: 10.1016/s0092-8674(03)00310-6. [DOI] [PubMed] [Google Scholar]
- 44.Zheng P, Pennacchio LA, Le Goff W, Rubin EM, Smith JD. Identification of a novel enhancer of brain expression near the apoE gene cluster by comparative genomics. Biochim Biophys Acta. 2004;1676:41–50. doi: 10.1016/j.bbaexp.2003.10.007. [DOI] [PubMed] [Google Scholar]
- 45.Montgomery GW, Tate ML, Henry HM, Penty JM, Rohan RM. The follicle-stimulating hormone receptor and luteinizing hormone receptor genes are closely linked in sheep and deer. J Mol Endocrinol. 1995;15:259–265. doi: 10.1677/jme.0.0150259. [DOI] [PubMed] [Google Scholar]
- 46.Bray N, Dubchak I, Pachter L. AVID: a global alignment program. Genome Res. 2003;13:97–102. doi: 10.1101/gr.789803. [DOI] [PMC free article] [PubMed] [Google Scholar]
- 47.Brudno M, Do CB, Cooper GM, Kim MF, Davydov E, Green ED, Sidow A, Batzoglou S. LAGAN and Multi-LAGAN: efficient tools for large-scale multiple alignment of genomic DNA. Genome Res. 2003;13:721–731. doi: 10.1101/gr.926603. [DOI] [PMC free article] [PubMed] [Google Scholar]
- 48.Couronne O, Poliakov A, Bray N, Ishkhanov T, Ryaboy D, Rubin E, Pachter L, Dubchak I. Strategies and tools for whole-genome alignments. Genome Res. 2003;13:73–80. doi: 10.1101/gr.762503. [DOI] [PMC free article] [PubMed] [Google Scholar]
- 49.Nei M, Xu P, Glazko G. Estimation of divergence times from multiprotein sequences for a few mammalian species and several distantly related organisms. Proc Natl Acad Sci USA. 2001;98:2497–2502. doi: 10.1073/pnas.051611498. [DOI] [PMC free article] [PubMed] [Google Scholar]
- 50.Wasserman WW, Sandelin A. Applied bioinformatics for the identification of regulatory elements. Nat Rev Genet. 2004;286:276–287. doi: 10.1038/nrg1315. [DOI] [PubMed] [Google Scholar]
- 51.Crawford GE, Holt IE, Mullikin JC, Tai D, Blakesley R, Bouffard G, Young A, Masiello C, Green ED, Wolfsberg TG, Collins FS. Identifying gene regulatory elements by genome-wide recovery of DNase hypersensitive sites. Proc Natl Acad Sci USA. 2004;101:992–997. doi: 10.1073/pnas.0307540100. [DOI] [PMC free article] [PubMed] [Google Scholar]
- 52.Scheidereit C, Cromlish JA, Gerster T, Kawakami K, Balmaceda CG, Currie RA, Roeder RG. A human lymphoid-specific transcription factor that activates immunoglobulin genes is a homoeobox protein. Nature. 1988;336:551–557. doi: 10.1038/336551a0. [DOI] [PubMed] [Google Scholar]
- 53.Picard D, Schaffner W. A lymphocyte-specific enhancer in the mouse immunoglobulin κ gene. Nature. 1984;307:80–82. doi: 10.1038/307080a0. [DOI] [PubMed] [Google Scholar]
- 54.Udvardy A, Maine E, Schedl P. The 87A7 chromomere. Identification of novel chromatin structures flanking the heat shock locus that may define the boundaries of higher order domains. J Mol Biol. 1985;185:341–358. doi: 10.1016/0022-2836(85)90408-5. [DOI] [PubMed] [Google Scholar]
- 55.Levy-Wilson B, Fortier C. The limits of the DNase I-sensitive domain of the human apolipoprotein B gene coincide with the locations of chromosomal anchorage loops and define the 5′ and 3′ boundaries of the gene. J Biol Chem. 1989;264:21196–21204. [PubMed] [Google Scholar]
- 56.Talbot D, Collis P, Antoniou M, Vidal M, Grosveld F, Greaves DR. A dominant control region from the human β-globin locus conferring integration site-independent gene expression. Nature. 1989;338:352–355. doi: 10.1038/338352a0. [DOI] [PubMed] [Google Scholar]
- 57.Sawada S, Scarborough JD, Killeen N, Littman DR. A lineage-specific transcriptional silencer regulates CD4 gene expression during T lymphocyte development. Cell. 1994;77:917–929. doi: 10.1016/0092-8674(94)90140-6. [DOI] [PubMed] [Google Scholar]
- 58.Carey M, Smale ST 2000 Identification and analysis of distant control regions. In: Carey M, Smale ST, eds. Transcriptional regulation in eukaryotes. Cold Spring Harbor, NY: Cold Spring Harbor Press
- 59.Berman BP, Nibu Y, Pfeiffer BD, Tomancak P, Celniker SE, Levine M, Rubin GM, Eisen MB. Exploiting transcription factor binding site clustering to identify cis-regulatory modules involved in pattern formation in the Drosophila genome. Proc Natl Acad Sci USA. 2002;99:757–762. doi: 10.1073/pnas.231608898. [DOI] [PMC free article] [PubMed] [Google Scholar]
- 60.Markstein M, Markstein P, Markstein V, Levine MS. Genome-wide analysis of clustered dorsal binding sites identifies putative target genes in the Drosophila embryo. Proc Natl Acad Sci USA. 2002;99:763–768. doi: 10.1073/pnas.012591199. [DOI] [PMC free article] [PubMed] [Google Scholar]
- 61.Stathopoulos A, Van Drenth M, Erives A, Markstein M, Levine M. Whole-genome analysis of dorsal-ventral patterning in the Drosophila embryo. Cell. 2002;111:687–701. doi: 10.1016/s0092-8674(02)01087-5. [DOI] [PubMed] [Google Scholar]
- 62.Arceci RJ, King AA, Simon MC, Orkin SH, Wilson DB. Mouse GATA-4: a retinoic acid-inducible GATA-binding transcription factor expressed in endodermally derived tissues and heart. Mol Cell Biol. 1993;13:2235–2246. doi: 10.1128/mcb.13.4.2235. [DOI] [PMC free article] [PubMed] [Google Scholar]
- 63.Molkentin JD. The zinc finger-containing transcription factors GATA-4, -5, and -6. Ubiquitously expressed regulators of tissue-specific gene expression. J Biol Chem. 2000;275:38949–38952. doi: 10.1074/jbc.R000029200. [DOI] [PubMed] [Google Scholar]
- 64.Robert NM, Tremblay JJ, Viger RS. Friend of GATA (FOG)-1 and FOG-2 differentially repress the GATA-dependent activity of multiple gonadal promoters. Endocrinology. 2002;143:3963–3973. doi: 10.1210/en.2002-220280. [DOI] [PubMed] [Google Scholar]
- 65.Lei N, Heckert LL. Gata4 regulates testis-specific expression of Dmrt1. Mol Cell Biol. 2004;24:377–388. doi: 10.1128/MCB.24.1.377-388.2004. [DOI] [PMC free article] [PubMed] [Google Scholar]
- 66.Ko LJ, Engel JD. DNA-binding specificites of the GATA transcription factor family. Mol Cell Biol. 1993;13:4011–4022. doi: 10.1128/mcb.13.7.4011. [DOI] [PMC free article] [PubMed] [Google Scholar]
- 67.Merika M, Orkin SH. DNA-binding specificity of GATA family transcription factors. Mol Cell Biol. 1993;13:3999–4010. doi: 10.1128/mcb.13.7.3999. [DOI] [PMC free article] [PubMed] [Google Scholar]
- 68.Suzuki N, Peter W, Ciesiolka T, Gruss P, Scholer HR. Mouse Oct-1 contains a composite homeodomain of human Oct-1 and Oct-2. Nucleic Acids Res. 1993;21:245–252. doi: 10.1093/nar/21.2.245. [DOI] [PMC free article] [PubMed] [Google Scholar]
- 69.Phillips K, Luisi B. The virtuoso of versatility: POU proteins that flex to fit. J Mol Biol. 2000;302:1023–1039. doi: 10.1006/jmbi.2000.4107. [DOI] [PubMed] [Google Scholar]
- 70.Delhase M, Castrillo JL, de la Hoya M, Rajas F, Hooghe-Peters EL. AP-1 and Oct-1 transcription factors down-regulate the expression of the human PIT1/GHF1 gene. J Biol Chem. 1996;271:32349–32358. doi: 10.1074/jbc.271.50.32349. [DOI] [PubMed] [Google Scholar]
- 71.Kim MK, Lesoon-Wood LA, Weintraub BD, Chung JH. A soluble transcription factor, Oct-1, is also found in the insoluble nuclear matrix and possesses silencing activity in its alanine-rich domain. Mol Cell Biol. 1996;16:4366–4377. doi: 10.1128/mcb.16.8.4366. [DOI] [PMC free article] [PubMed] [Google Scholar]
- 72.Schwachtgen JL, Remacle JE, Janel N, Brys R, Huylebroeck D, Meyer D, Kerbiriou-Nabias D. Oct-1 is involved in the transcriptional repression of the von willebrand factor gene promoter. Blood. 1998;92:1247–1258. [PubMed] [Google Scholar]
- 73.Belsham DD, Mellon PL. Transcription factors Oct-1 and C/EBPβ (CCAAT/enhancer-binding protein-β) are involved in the glutamate/nitric oxide/cyclic-guanosine 5′ -monophosphate-mediated repression of mediated repression of gonadotropin-releasing hormone gene expression. Mol Endocrinol. 2000;14:212–228. doi: 10.1210/mend.14.2.0418. [DOI] [PubMed] [Google Scholar]
- 74.Malone CS, Patrone L, Buchanan KL, Webb CF, Wall R. An upstream Oct-1- and Oct-2-binding silencer governs B29 (Igβ) gene expression. J Immunol. 2000;164:2550–2556. doi: 10.4049/jimmunol.164.5.2550. [DOI] [PubMed] [Google Scholar]
- 75.Cheng CK, Yeung CM, Hoo RL, Chow BK, Leung PC. Oct-1 is involved in the transcriptional repression of the gonadotropin-releasing hormone receptor gene. Endocrinology. 2002;143:4693–4701. doi: 10.1210/en.2002-220576. [DOI] [PubMed] [Google Scholar]
- 76.Cheng CK, Yeung CM, Chow BK, Leung PC. Characterization of a new upstream GnRH receptor promoter in human ovarian granulosaluteal cells. Mol Endocrinol. 2002;16:1552–1564. doi: 10.1210/mend.16.7.0869. [DOI] [PubMed] [Google Scholar]
- 77.Chen L, Widom J. Mechanism of transcriptional silencing in yeast. Cell. 2005;120:37–48. doi: 10.1016/j.cell.2004.11.030. [DOI] [PubMed] [Google Scholar]
- 78.Tatusova TA, Madden TL. BLAST 2 sequences, a new tool for comparing protein and nucleotide sequences. FEMS Microbiol Lett. 1999;174:247–250. doi: 10.1111/j.1574-6968.1999.tb13575.x. [DOI] [PubMed] [Google Scholar]
- 79.Karl AF, Griswold MD. Sertoli cells of the testis: preparation of cell cultures and effects of retinoids. Methods Enzymol. 1990;190:71–75. doi: 10.1016/0076-6879(90)90010-x. [DOI] [PubMed] [Google Scholar]
- 80.Chen JK, Heckert LL. Dmrt1 expression is regulated by follicle-stimulating hormone and phorbol esters in postnatal Sertoli cells. Endocrinology. 2001;142:1167–1178. doi: 10.1210/endo.142.3.8021. [DOI] [PMC free article] [PubMed] [Google Scholar]
- 81.Li Q, Zhang M, Duan Z, Stamatoyannopoulos G. Structural analysis and mapping of DNase I hypersensitivity of HS5 of the β-globin locus control region. Genomics. 1999;61:183–193. doi: 10.1006/geno.1999.5954. [DOI] [PubMed] [Google Scholar]
- 82.Peterson KR, Zitnik G, Huxley C, Lowrey CH, Gnirke A, Leppig KA, Papayannopoulou T, Stamatoyannopoulos G. Use of yeast artificial chromosomes (YACs) for studying control of gene expression: correct regulation of the genes of a human β-globin locus YAC following transfer to mouse erythroleukemia cell lines. Proc Natl Acad Sci USA. 1993;90:11207–11211. doi: 10.1073/pnas.90.23.11207. [DOI] [PMC free article] [PubMed] [Google Scholar]
- 83.Brown T 2001 Southern blotting. In: Ausubel FM, Brent R, Kingston RE, Moore DD, Seidman JG, Smith JA, Struhl K, eds. Current protocols in molecular biology. New York: John Wiley, Sons, Inc.
- 84.Brown T 2001 Hybridization analysis of DNA. In: Ausubel FM, Brent R, Kingston RE, Moore DD, Seidman JG, Smith JA, Struhl K, eds. Current protocols in molecular biology. New York: John Wiley, Sons, Inc.
- 85.Lei N, Heckert LL. Sp1 and Egr1 regulate transcription of the Dmrt1 gene in Sertoli cells. Biol Reprod. 2002;66:675–684. doi: 10.1095/biolreprod66.3.675. [DOI] [PMC free article] [PubMed] [Google Scholar]
- 86.Daggett MA, Rice DA, Heckert LL. Expression of steroidogenic factor 1 in the testis requires an E box and CCAAT box in its promoter proximal region. Biol Reprod. 2000;62:670–679. doi: 10.1095/biolreprod62.3.670. [DOI] [PMC free article] [PubMed] [Google Scholar]
- 87.Windle JJ, Weiner RI, Mellon PL. Cell lines of the pituitary gonadotrope lineage derived by targeted oncogenesis in transgenic mice. Mol Endocrinol. 1990;4:597–603. doi: 10.1210/mend-4-4-597. [DOI] [PubMed] [Google Scholar]
- 88.Wolfe MW, Call GB. Early growth response protein 1 binds to the luteinizing hormone-β promoter and mediates gonadotropin-releasing hormone-stimulated gene. Mol Endocrinol. 1999;5:752–763. doi: 10.1210/mend.13.5.0276. [DOI] [PubMed] [Google Scholar]
- 89.Hiroi H, Christenson LK, Strauss JF. Regulation of transcription of the steroidogenic acute regulatory protein (StAR) gene: temporal and spatial changes in transcription factor binding and histone modification. Mol Cell Endocrinol. 2004;215:119–126. doi: 10.1016/j.mce.2003.11.014. [DOI] [PubMed] [Google Scholar]
- 90.Ascoli M. Characterization of several clonal lines of cultured Leydig tumor cells: gonadotropin receptors and steroidogenic responses. Endocrinology. 1981;108:88–95. doi: 10.1210/endo-108-1-88. [DOI] [PubMed] [Google Scholar]
Associated Data
This section collects any data citations, data availability statements, or supplementary materials included in this article.