

Abstract
A recently promoted genome evolution model posits that mammalian pseudogenes can regulate their founding source genes, and it thereby ascribes an important function to “junk DNA.” This model arose from analysis of a serendipitous mouse mutant in which a transgene insertion/deletion caused severe polycystic kidney disease and osteogenesis imperfecta with ≈80% perinatal lethality, when inherited paternally [Hirotsune, S., et al. (2003) Nature 423, 91–96]. The authors concluded that the transgene reduced the expression of a nearby transcribed and imprinted pseudogene, Mkrn1-p1. This reduction in chromosome 5-imprinted Mkrn1-p1 transcripts was proposed to destabilize the cognate chromosome 6 Mkrn1 source gene mRNA, with a partial reduction in one Mkrn1 isoform leading to the imprinted phenotype. Here, we show that 5’ Mkrn1-p1 is fully methylated on both alleles, a pattern indicative of silenced chromatin, and that Mkrn1-p1 is not transcribed and therefore cannot stabilize Mkrn1 transcripts in trans. A small, truncated, rodent-specific Mkrn1 transcript explains the product erroneously attributed to Mkrn1-p1. Additionally, Mkrn1 expression is not imprinted, and 5’ Mkrn1 is fully unmethylated. Finally, mice in which Mkrn1 has been directly disrupted show none of the phenotypes attributed to a partial reduction of Mkrn1. These data contradict the previous suggestions that Mkrn1-p1 is imprinted, and that either it or its source Mkrn1 gene relates to the original imprinted transgene phenotype. This study invalidates the data upon which the pseudogene trans-regulation model is based and therefore strongly supports the view that mammalian pseudogenes are evolutionary relics.
Keywords: disease mechanism, gene regulation, imprinting, molecular evolution, transgene
The mammalian genome is littered with a plethora of retrotransposed repetitive elements (e.g., L1, Alu) and gene copies (1–3). Retrotransposed genes are intronless, are polyadenylated, are usually truncated at the 5′ end because of inefficient reverse transcription in their creation, and do not include the flanking promoter elements that drive transcription of the source gene. This last characteristic means that, unless they insert into chromatin with some basal transcriptional activity or unless they gain promoter sequences, the vast majority of retrotransposed loci are not actively transcribed. Transcriptionally silent gene copies are not under natural selection, and they therefore freely accrue sequence changes that result in a loss of coding potential. These pseudogenes will eventually decay beyond recognition, in contrast to retrotransposed genes, termed retrogenes, that retain or gain functional expression and undergo natural selection (4, 5).
Recently, however, the established paradigm that pseudogenes are “junk DNA” has been challenged by a model suggesting that some pseudogenes can regulate their respective source genes (6–9). This provocative model, summarized in Fig. 6 (which is published as supporting information on the PNAS web site), stemmed from analysis of a transgenic insertion/deletion mouse model that on paternal inheritance had severe polycystic kidney disease and skeletal dysmorphology leading to ≈80% perinatal mortality (6). The transgene [Drosophila sex lethal (sxl)] putatively integrated ≈20 kb away from a pseudogene, Mkrn1-p1, in chromosome 5 that displayed imprinted expression mainly from the paternal allele. The transgene purportedly reduced the transcription of Mkrn1-p1, which in turn destabilized one of the mRNA isoforms produced from the homologous Mkrn1 source gene on chromosome 6, leading to the abnormal developmental phenotype (6). The sweeping ramifications of this model have fostered its acceptance by the scientific community, despite inconsistencies with evolutionary theory (see Discussion). Since its original proposal, this “pseudogene trans-regulation” model has been cited in support of diverse arguments attesting to (i) the importance of pseudogenes in mammalian genome evolution (2, 7, 10), (ii) a novel function for noncoding RNAs (11, 12), (iii) revelation of a purpose for junk DNA (13, 14), and (iv) even “intelligent design” (15).
The Makorin (gene symbol Mkrn) gene family encodes proteins having a characteristic zinc-finger composition (16–19) with two to four C3H zinc-fingers that may confer RNA-binding (20), a novel C2H2C putative zinc-finger of unknown function, and a C3HC4 RING zinc-finger that allows Makorins to function as E3 ubiquitin ligases that ubiquitinate specific target proteins (21–23). Makorin orthologs are found in all metazoans, and vertebrates have two distinct intron-containing Mkrn paralogs, Mkrn1 and Mkrn2, which arose by gene duplication >400 million years ago (16, 17). Mkrn1 has also given rise to many processed copies in mammals, possibly owing to its high level of transcription in the testis or the early embryo (1, 3). Only one of the intronless family members, Mkrn3, is conserved in eutherian mammals, is transcribed, and encodes a Makorin protein (18, 19) and is therefore likely a functional retrogene.
The pseudogene trans-regulation model is predicated on the occurrence of active, imprinted transcription of Mkrn1-p1 in WT mice to stabilize Mkrn1 mRNAs in trans, and on a partial reduction of Mkrn1 expression giving rise to the reported kidney and bone phenotypes (6). We use bioinformatics and molecular analyses to definitively demonstrate that Mkrn1-p1 is not transcribed, and therefore cannot regulate in trans transcripts from the unlinked Mkrn1 gene. Instead, we identified a 0.75-kb, alternatively spliced and polyadenylated Mkrn1 transcript of the same size as the claimed Mkrn1-p1 transcript (6). In addition, Mkrn1-p1 is completely methylated on both alleles, as expected for a transcriptionally silent pseudogene; further, because we show that neither Mkrn1-p1 nor Mkrn1 is imprinted, neither can account for imprinted inheritance of the sxl transgene (6). We also show that mice in which Mkrn1 has been directly disrupted do not display any of the phenotypes that were attributed to a partial down-regulation of this gene (6). Combined, our data invalidate the experimental evidence that formed the basis of the paradigm-shifting, mammalian pseudogene trans-stabilization model (6–9).
Results
Mkrn1-p1 Is Not Transcribed and Discovery of a 0.75-kb Mkrn1 mRNA Isoform.
Inspection of the Mkrn1-p1 locus on mouse chromosome 5 showed that the reported 0.7-kb transcript (6) corresponds to part of an incomplete (1.6-kb) retrotransposed copy of a 1.7-kb Mkrn1 mRNA isoform (Fig. 1A Upper and Fig. 7A, which is published as supporting information on the PNAS web site). The genomic sequence of the pseudogene exhibits the hallmarks of retrotransposed genes, including a truncated 5′ end that begins 31 nt downstream of the Mkrn1 initiating methionine codon, a poly(A) tract at the 3′ end, and a 16-nt target site duplication generated upon insertion (Fig. 7 A and B). No other species were found to have a Mkrn1-p1 ortholog, not even rat: this finding indicates a very recent retrotransposition event from the Mkrn1 source gene (Fig. 7B).
Fig. 1.

Bioinformatic analyses of ≈0.7-kb Mkrn1-like transcripts. (A) BLAST sequence similarity with Mkrn1-p1. The schematic shows the Mkrn1-p1 1.6-kb pseudogene (green) with the 0.7-kb region (yellow) previously claimed to be transcribed (6). The latter sequence (GenBank AF494488) was used as a BLAST query to screen mouse ESTs. Some ESTs diverge after exon 3 (blue dots) and continue into intron 3 (exon 3b). (B) BLAST sequence similarity with Mkrn1 exon 3b. The schematic shows 5′ Mkrn1 highlighting splicing of the exon 3b isoform. Shading indicates the Makorin-1 coding sequence (black), untranslated regions (cyan), and polyadenylation signal (red). BLAST searching identified EST clones containing exon 3b. (C) Summary of mouse dbEST BLAST returns. The total EST numbers matching queries for Mkrn1-p1, Mkrn1-ex3b (0.75-kb), and full-length Mkrn1 (composed of the 0.75-, 1.7-, and 2.9-kb isoforms) are shown.
We initiated our analysis of Mkrn1-p1 transcription by performing a simple BLAST search of public EST databases, using the putative Mkrn1-p1 cDNA sequence (6) as a query. Surprisingly, none of the >100 returned sequences corresponded to Mkrn1-p1 transcripts; rather, all were from the source Mkrn1 locus (Fig. 1A). The complete absence of EST clones from a “robustly transcribed” gene (6) led us to consider the possibility that the Mkrn1-p1 locus was not actively transcribed. We therefore sought to identify the origin of the 0.7-kb transcript (6) attributed to Mkrn1-p1. We noted that a subset of ESTs returned by our BLAST query ended at a discrete position (Fig. 1A), suggesting that multiple sequences diverged from the query beginning at that point. Inspection revealed that these ESTs represent a population of clones that are composed of Mkrn1 exons 1–3 but that continue into intron 3 instead of splicing to exon 4 (Fig. 1B and Fig. 8A, which is published as supporting information on the PNAS web site). These transcripts terminate in intron 3, just 3′ to a canonical polyadenylation signal (AATAAA) present 165 bp into the intron; these isoforms could encode only a severely truncated Makorin-1 protein and are present in mouse and rat, but not guinea pig or other sequenced mammalian genomes (Fig. 8 A and B). The consensus length of these Mkrn1 intron 3 (hereafter referred to as exon 3b) transcripts was 0.75 kb, similar in size to the ≈0.7-kb transcript reported by northern analyses (6, 9). Further BLAST queries of the mouse EST database, by using the 2.9-kb Mkrn1 cDNA sequence, returned 573 entries (Fig. 1C), of which 54 ESTs are specific for the exon 3b isoform (Fig. 1 B and C); this result strikingly contrasts with the total of zero ESTs for Mkrn1-p1 (Fig. 1C).
These EST data suggest that the putative Mkrn1-p1 transcripts (6, 9) instead represent an alternative exon 3b isoform of the Mkrn1 source gene. To empirically test this hypothesis, we performed RT-PCR using primers specific for either Mkrn1-p1 or Mkrn1-ex3b (Fig. 2 A and B; see Methods for primer design). We performed RT-PCR of total kidney RNA from FVB mice, the same strain used in the initial report (6). Primers specific for the Mkrn1-ex3b isoform clearly showed abundant exon 3b transcripts (Fig. 2C Upper). In contrast, Mkrn1-p1-specific primers failed to amplify a cDNA product, yet readily amplified genomic DNA under identical conditions (Fig. 2C Lower).
Fig. 2.

Expression of Mkrn1-ex3b but not Mkrn1-p1. (A) Mkrn1-p1 PCR primers. The numbered arrows indicate the relative positions of each primer pair (white circles, forward; black circles, reverse). The primer sequences (5′ to 3′) are aligned with corresponding Mkrn1 (M1) or Mkrn1-p1 (p1) sequences to illustrate the specificity of each primer; fractions indicate the number of base pair matches between a primer and its potential priming site. Primer set 1 was used by Hirotsune et al. (6) for “Mkrn1-p1 RT-PCR” but has greater specificity for Mkrn1 than for Mkrn1-p1. (B) Mkrn1-ex3b cDNA structure. The four Mkrn1 exons and positions of primers for analysis of the Mkrn1-ex3b isoform are shown. (C) RT-PCR analysis of gene expression. Newborn mouse tissue total RNAs with (+) or without (−) reverse transcriptase (RT) or genomic (Gen.) DNA were amplified with Mkrn1-ex3b or Mkrn1-p1 primers (indicated at right). (D) Mkrn1-p1-biased primers amplify only Mkrn1 in mouse cDNA. (Right) Mkrn1-p1 primers (set 3 in A) with mismatches to Mkrn1 were used to amplify mouse genomic DNA, Mkrn1 cDNA plasmid, and mouse cDNA under identical conditions (lanes 1, 3, and 5). PstI digests of the PCR products distinguish Mkrn1-p1 (lane 2) and Mkrn1 (lanes 4 and 6). Informative PstI fragment sizes for Mkrn1-p1 are 79-bp and 262-bp (yellow dots), and 341-bp for Mkrn1 (blue dot), as also shown in the schematic (Left); shared fragments are unmarked. M, 100-bp marker.
We further used a set of Mkrn1-p1-biased PCR primers that together contain three mismatches with Mkrn1 (Fig. 2A, primer set 3) to preferentially amplify Mkrn1-p1 cDNAs. A PstI variant was used to discriminate between Mkrn1-p1 and Mkrn1 PCR products, to yield either two Mkrn1-p1 or one Mkrn1-specific fragments (Fig. 2D, schematic). Control PCR of genomic DNA or Mkrn1 cDNA plasmid templates produced the predicted PstI banding patterns (Fig. 2D, lanes 2 and 4, respectively). Importantly, the amplified product from FVB kidney cDNA produced a PstI digestion pattern that matched Mkrn1, not Mkrn1-p1 (Fig. 2D, lane 6). The great sensitivity of this assay, which should preferentially amplify Mkrn1-p1, highlights the complete absence of Mkrn1-p1 transcripts. Because Mkrn1-p1 is not transcribed, the original Mkrn1-p1 “cDNA” clone (6) was likely a genomic DNA contaminant; the presence of such contaminants is a common problem for identification of rare unspliced ESTs (24). The combined data presented above conclusively show that Mkrn1-p1 is not transcribed, and that the reported transcript (6, 9) is a 0.75-kb isoform of the source Mkrn1 gene.
Neither Mkrn1-p1 nor Mkrn1 Is Imprinted, and 5′ Mkrn1-p1 Is Fully Methylated.
The transcriptional status of a gene is correlated with the methylation status of CpG dinucleotides at the 5′ end (25). Bisulfite modification of DNA allows direct assessment of DNA methylation (see Methods) and therefore to an inference of the transcriptional status of individual chromosomal alleles. Imprinted genes illustrate this association well, having one unmethylated and transcribed allele, and another allele that is methylated and silent. Bisulfite sequencing of mouse pup kidney DNA of the well studied imprinted Snurf-Snrpn locus revealed a hallmark differential methylation pattern, with the recovery of cloned PCR products exclusively having either TpGs or CpGs; these, respectively, represent the unmethylated (paternal) and methylated (maternal) alleles (Fig. 3A Top). Because Mkrn1-p1 is purportedly imprinted (6), we would expect to find a differential methylation pattern similar to that of Snurf-Snrpn; however, bisulfite sequencing produced only CpG-containing clones, diagnostic of a fully methylated sequence (Fig. 3A Bottom). Not only is this finding inconsistent with the claimed imprinted status of Mkrn1-p1 (6), but the absence of TpG bisulfite sequence clones at the 5′ end of Mkrn1-p1 further underscores the biallelic silence of Mkrn1-p1. Whereas Mkrn1 is not thought to be imprinted (16), given that the imprinted mouse phenotype was attributed to a reduction of Mkrn1 expression, we directly assessed its methylation status. All bisulfite sequencing clones of 5′ Mkrn1 showed an unmethylated profile throughout the Mkrn1 CpG island (Fig. 3A Middle), consistent with expression from both chromosome alleles.
Fig. 3.

Epigenetic analyses. (A) Sequence analysis of bisulfite converted loci. The methylation status of Mkrn1-p1, Mkrn1, and the imprinted Snurf-Snrpn loci in WT kidney DNA were determined by bisulfite sequencing of individual clones. Amplicons of each locus are shown with lollipops representing unmethylated (open circle) or methylated (closed circle) cytosines in CpG dinucleotides, with the number of clones of a given type for each locus shown in the shaded box at left. Arrows, transcriptional start sites (Mkrn1 and paternally expressed Snurf-Snrpn); X, silenced maternal Snurf-Snrpn allele; gray box, 5′ end of Mkrn1-p1; reverse-shaded As in triangles, AciI digestion sites diagnostic for the methylated allele (unshaded As for Mkrn1 represent a hypothetical methylated allele). (B) Biallelic methylation status. AciI will digest only bisulfite-converted amplified DNA that was originally methylated (see A for potential sites). Br, brain DNA; K1, same kidney DNA as in A; K2, kidney DNA from another WT mouse; Li, liver DNA; Un, undigested PCR products pooled from each tissue (lanes 1, 6, 11); M, 100-bp ladder. (C) Mkrn1 is not imprinted. RT-PCR was performed on RNA (RT−) and cDNA (RT+) samples from Mkrn1 gene-trapped (mat pat, −/−), heterozygous (mat pat, +/−; mat pat, −/+), or WT (mat pat, +/+) mice by using exon 4 and 5 primers (Upper) or Clcn7 control primers (Lower). RNA obtained from mice (gray diamonds) derived from the illustrated matings was used for RT-PCR (black symbols, gene-trapped Mkrn1 allele; white symbols, WT Mkrn1 allele).
Clonal bisulfite sequencing examines every CpG in the amplified interval in a finite number of randomly selected clones. To ensure that the sampled clones accurately represent the entire bisulfite amplicon population of their respective genes, we digested uncloned bisulfite amplified products with a restriction enzyme. AciI digests the amplified products at a subset of the CpG sites only if the templates were originally methylated, thus protecting the CpGs from conversion. AciI restriction analysis of the amplified products unambiguously confirmed the clonal analysis (Fig. 3 A and B). Approximately one-half of the imprinted Snurf-Snrpn products were cut at the subset of CpGs that are potential AciI sites, whereas all of the Mkrn1-p1 products and none of the Mkrn1 products were digested (Fig. 3B). This assay's great sensitivity and lack of potential bias allowed us to conclusively demonstrate both the biallelic methylation status of Mkrn1-p1 and the absence of methylation for Mkrn1. Moreover, identical patterns were observed in all tissues examined (Fig. 3B), indicating that the described methylation patterns are generalizable.
Because the primers in the original Mkrn1-p1 imprinting assay (6) match Mkrn1 much better than they match Mkrn1-p1 (Fig. 2A, primer set 1), the original work (6) could only have amplified Mkrn1 by RT-PCR (see Supporting Discussion in Supporting Text, which is published as supporting information on the PNAS web site). Therefore, the original imprinting data (6) could be explained if Mkrn1 was imprinted, and the origin of the transcripts was misidentified. Although the Mkrn1 promoter is unmethylated on both alleles, suggesting Mkrn1 is not imprinted (Fig. 3 A and B and ref. 16), a minority of imprinted genes show a biallelic unmethylated state (26). To directly address whether Mkrn1 is imprinted, we monitored allelic transcription by RT-PCR in tissues from a Mkrn1 gene-trap mutant mouse model (see next section). Mice homozygous for the mutant Mkrn1 locus do not produce any detectable Mkrn1 transcript (Fig. 3C, lane 1). The WT allele is transcribed when inherited either maternally (Fig. 3C, lane 3) or paternally (Fig. 3C, lane 5), functionally demonstrating that Mkrn1 is expressed regardless of parental origin and is not imprinted.
Inactivation of Mkrn1 Does Not Lead to Abnormal Development.
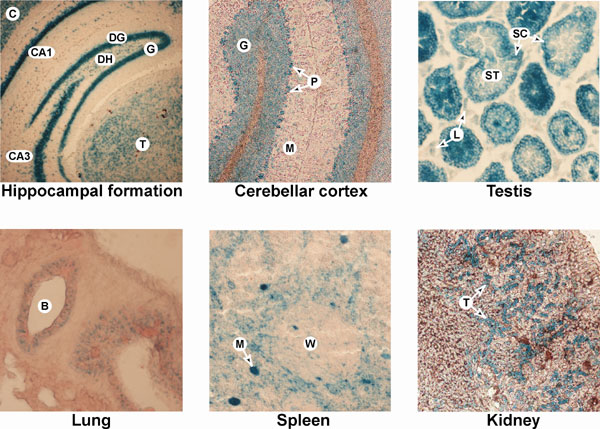
To independently investigate the phenotypic effect of a reduction in Mkrn1 transcripts, we generated mice in which Mkrn1 was disrupted by a gene-trap vector insertion (RRB087) in the third intron (Fig. 4A). RRB087 Mkrn1 gene-trapped transcripts lack exons 4–8, and the encoded proteins lack four of the Makorin family zinc-finger motifs, including the essential RING E3 ubiquitin ligase domain (16, 17, 21–23). Therefore, the extremely truncated Makorin-1-β-geo fusion derivative (Fig. 4A) is unlikely to be functional. Histochemical visualization of Makorin-1 expression using the β-gal fusion refined existing data that Mkrn1 is widely expressed (6, 16) and very abundant in specific cell types of the central nervous system and testis (Fig. 9, which is published as supporting information on the PNAS web site).
Fig. 4.

Mkrn1 gene-trapped mice have no overt phenotype. (A) Mkrn1 and gene-trap structures. (Top) Full-length Mkrn1 transcripts span exons 1–8 (symbols as for Fig. 1B). (Middle) The BayGenomics RRB087 gene-trap mutation (s.a., splice acceptor) integrated at a point 735 bp into intron 3 of Mkrn1. (Bottom) The encoded polypeptides from Mkrn1 WT and gene-trapped mRNAs are depicted, with putative functional motifs reverse-shaded. (B) Quantitative RT-PCR of Mkrn1 transcripts. A TaqMan primer set flanking Mkrn1 intron 7 amplified full-length 1.7- and 2.9-kb Mkrn1 transcripts in WT (+/+) and gene-trapped (−/−) brain and kidney. (C) Mkrn1 gene-trapped mice do not have polycystic kidneys or an open-eye phenotype. (Upper) Histological analyses of kidney coronal sections at 7 weeks of age (genotypes as in B) showing renal cortex (C), medulla (M), and medullary pyramid (P). (Lower) Newborn Mkrn1 gene-trapped heterozyogous (+/−) or homozygous (−/−) littermates have closed eyelids (black arrows, the third pup has unpigmented eyes).
The splice acceptor and polyadenylation signals of the insertion vector should effectively commandeer the transcripts of the gene into which it integrates. By using quantitative RT-PCR with exonic primers spanning intron 7 (thereby assaying both the 1.7-kb and 2.9-kb mRNA isoforms), we evaluated homozygous Mkrn1 gene-trap mice for transcriptional read-through into downstream exons, and found the transcript levels to be <1% of WT levels in brain and kidney total RNA (Fig. 4B). Additionally, heterozygous Mkrn1+/− gene-trap mice have an ≈50% reduction in Mkrn1 mRNA levels (data not shown). Quantitative RT-PCR of the other two functional Mkrn1 paralogs, Mkrn2 (17) and Mkrn3 (18), indicated a lack of compensation of these related genes at the mRNA level (data not shown). These data suggest that RRB087 homozygous Mkrn1 gene-trap mice lack Makorin-1 function during mouse development; however, the mice are viable and fertile, with no apparent developmental deficits. In contrast to the phenotypes attributed to a partial reduction of the Mkrn1 1.7-kb transcript isoform (6), the homozygous (and heterozygous) gene-trapped mice do not have polycystic kidneys (Fig. 4C), open eyelids at birth (Fig. 4C), or detectable skeletal malformations (data not shown). This gene-trapped Mkrn1 allele was maintained in 129P2/OlaHsd (isogenic with the RRB087 ES cell line) and C57BL/6J backgrounds, suggesting that our observations were not mouse strain-specific.
Discussion
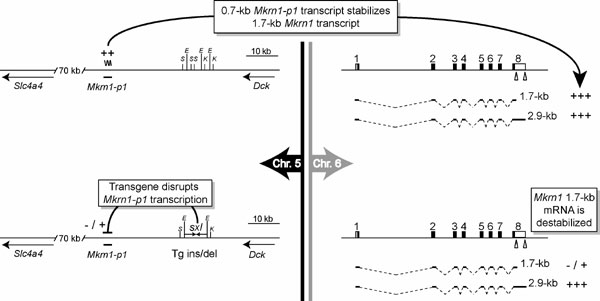
The study reported here explored a recent model asserting that transcribed pseudogene RNAs can stabilize the mRNA of their homologous protein-coding source gene, such that appropriate expression of the source gene depends on coexpression of the pseudogene (6–9, 27). As summarized in Fig. 5, but contrary to previously published claims (6, 8, 9, 27), we have definitively demonstrated here that (i) the mouse Mkrn1-p1 pseudogene is not expressed as RNA; (ii) the 0.7-kb transcript assigned to Mkrn1-p1 (6) actually derives from an alternative 5′ Mkrn1 source gene 0.75-kb transcript that terminates in the third intron of Mkrn1; (iii) neither the pseudogene nor the source gene is imprinted; (iv) 5′ Mkrn1-p1 is completely methylated on both alleles, a finding that is indicative not only of closed, silent chromatin, but also of the absence of imprinting at the epigenetic level; (v) 5′ Mkrn1 is completely unmethylated on both alleles (as earlier Southern blot results had suggested (16)), a finding indicative of an absence of imprinting at the epigenetic level; and (vi) complete loss of Mkrn1 function has no obvious phenotypic effect, in contrast to the severe kidney and bone disease that had been ascribed to a moderate reduction in one of two alternative Mkrn1 polyadenylated mRNA isoforms (6). These data collectively show that Mkrn1-p1 is a typical, untranscribed pseudogene (Fig. 5); because Mkrn1-p1 cannot regulate the Mkrn1 source gene in trans, the experimental foundation for the mammalian pseudogene trans-regulation model of source genes (6–9, 27) is abolished. Consequently, all data interpretations and conclusions based on this model (6, 8, 9, 27) must be flawed. For example, two studies (8, 27) on the evolution of Mkrn1-p1 depended on the assumption that the trans-regulation model (6, 9) was correct. One study claimed a constrained genetic drift from Mkrn1 for the “transcribed” 5′ region of Mkrn1-p1 relative to the “untranscribed” 3′ region (8). However, the primer set used to isolate the 3′ regions of Mkrn1-p1 from various mouse genomes could not distinguish between other paralogous Mkrn1 pseudogenes, leading to the cloning of non-Mkrn1-p1 loci (data not shown and ref. 27), which falsely made the 3′ regions appear more divergent than the 5′ regions. Indeed, there is no difference in genetic drift rates between the 5′ and 3′ halves of Mkrn1-p1 compared with the progenitor Mkrn1 gene in Mus musculus (Fig. 7 legend). Although the second study (27) found no Mkrn1-p1 evolutionary disparity in mice, it suggested that other Mkrn1 retrotransposed loci in primates do show more 5′ than 3′ conservation. However, one of the two loci analyzed (27) is the MKRN4 retrogene, which has a complete ORF in its 5′ region and may be evolutionarily constrained relative to the 3′ UTR. Finally, by using RT-PCR, the recent study (27) also claimed expression of other Mkrn1-derived pseudogenes in testis of several mouse subspecies and in rat (for a 1.46-kb chromosome 9 pseudogene); however, our analysis of verifiable rat ESTs identify 66 ESTs for Mkrn1 (using the 1.7-kb mRNA isoform) but 0 ESTs for the chromosome 9 pseudogene.
Fig. 5.

Summary of Mkrn1-p1 and Mkrn1 data. (A) Chromosome 5 Mkrn1-p1 pseudogene. BLAST, RT-PCR expression, and DNA methylation analyses show that Mkrn1-p1 is transcriptionally silent (CH3, complete methylation). The presence of three conserved noncoding sequences (CNSs, asterisks) putatively deleted upon sxl transgene insertion (6) may contribute to deregulation of unidentified flanking genes (arrows) to cause the observed phenotype. (B) Chromosome 6 Mkrn1 locus. A 0.75-kb Mkrn1 mRNA isoform, resulting from a cryptic polyadenylation signal (triangle) in Mkrn1 intron 3, explains the misidentification of a Mkrn1-p1 transcript (6). CpG, unmethylated CpG-island at 5′ Mkrn1; E, EcoRI; K, KpnI; S, SacI; +, level of expression of Mkrn1 isoforms.
The original report (6) proposed that the polycystic kidney disease, skeletal malformation, and open-eyelid phenotypes of the sxl transgenic mice resulted from a partial (≈60%) reduction of 1.7-kb Mkrn1 transcripts, whereas the 2.9-kb mRNA isoform that encodes an identical polypeptide was unaltered; this result would be an estimated total Makorin-1 reduction of only 25%. We characterized a gene-trap knockout allele of Mkrn1, which led to a >99% reduction in both full-length Mkrn1 transcripts. Even though homozygous, and heterozygous, gene-trap mice produced much less Mkrn1 than claimed for the sxl transgenic mice and should have been more severely affected, they were developmentally normal and did not demonstrate kidney, bone, or open-eyelid phenotypes. Interestingly, RNAi knockdown of the single Mkrn gene in Caenorhabitis elegans also failed to produce any obvious developmental phenotype (28). If we are to determine the developmental function of Mkrn1 in mice, it may be necessary to concurrently functionally ablate the paralogous Mkrn2 (17) and Mkrn3 (18) genes; a caveat is that other genes in the Mkrn1 biological pathway(s) might compensate for the constitutional loss of Mkrn1 function. Makorins may have an immune function, given that an ancestral Mkrn gene was captured and integrated into a progenitor poxvirus genome (29), retaining portions encoding the RING zinc-finger E3 ubiquitin ligase domain (21–23) and in some cases also the putative Mkrn1-RNA binding zinc-finger motifs (16, 19, 29) to form a key virulence gene (30). Finally, because Mkrn1-p1 is not transcribed and cannot regulate Mkrn1 in trans, and because a reduction in the amount of Mkrn1 transcripts does not cause the sxl transgenic phenotype, the unconventional Mkrn1-p1 and Mkrn1 microinjection rescues of the original sxl transgenic phenotype (6) were likely an artifact of incorrect genotyping, the nonspecificity of the open-eye phenotype (see Methods), and/or other experimental error.
An extraordinary feature of the sxl transgenic mice was that the severe kidney and bone phenotypes occurred with 92% penetrance after paternal inheritance of the transgene but with only 3% penetrance after maternal inheritance (6). The authors provided an apparent explanation for this “mostly imprinted” phenotype, by presenting data suggesting that the “expressed Mkrn1-p1 pseudogene” demonstrated imprinted paternal expression (6). Coincidentally, putative imprinted expression of Mkrn1-p1 was not complete, but showed ≈10–16% of transcripts derived from the maternal allele, in an apparent match of data with the phenotypic segregation by parental allele of the sxl transgene (6). Our work showing that Mkrn1-p1 is neither imprinted nor transcribed, from either allele, clearly invalidates the large tabulated imprinted data set in the earlier Mkrn1-p1 work (6): because the source Mkrn1 gene is also not imprinted and because the PCR primers and restriction fragments used in their assays have no relationship to imprinted Mkrn3 transcripts, there is no apparent scientific or artifactual explanation as to how the previous study could have generated such data (discussed further in Supporting Text). Additionally, previous analyses of maternal or paternal duplication (uniparental disomy) for a large part of mouse chromosome 5 proximal to the T(5,11)57H and T(5,7)30Ad breakpoints in chromosome 5G1/2, including region 5E2, which contains the sxl transgene insertion, concluded that mouse chromosome 5 has no imprinted genes that produce obvious perinatal phenotypes (31) (B. M. Cattanach, personal communication). A neonatally lethal phenotype, such as proposed (6) to have arisen from loss of an imprinted chromosome 5 gene, would have been detected in the earlier studies. This fact, combined with our data, allows the conclusion that there is no chromosome 5 gene that produces a severe neonatal imprinted phenotype; therefore, the parental influence on the sxl transgene insertion phenotype must have a molecular basis other than that proposed (6).
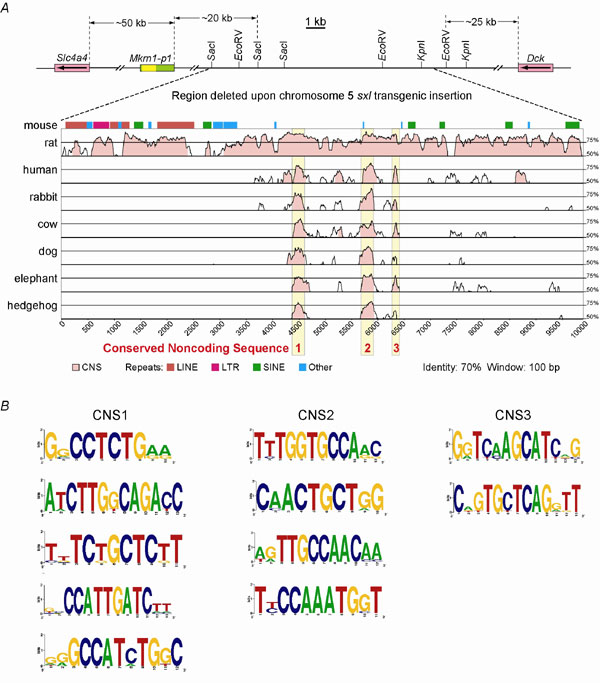
A more parsimonious scientific explanation for the imprinted inheritance as well as working models for the phenotypic basis of the original sxl transgenic line (6) can be proposed. Thus, imprinted or epigenetic inheritance of transgenes and their induced phenotypes is a well known phenomenon (32–34) that does not require that the affected genes be imprinted in WT mice; rather, it is the perturbation of chromatin by transgene sequences that leads to imprinted inheritance. Moreover, epigenetic regulation of exogenous elements is often unstable (33, 34), possibly explaining the incomplete penetrance [≈ 90% (6)]. Therefore, it seems likely that the transgene itself, rather than the affected flanking genes, is the origin of epigenetic inheritance in this transgenic mouse line. Finally, because the putative transgene insertion/deletion (6) may have inserted transcriptional regulatory elements and would also have removed three distinct endogenous conserved regions (Supporting Text and Fig. 10, which is published as supporting information on the PNAS web site), deregulation of flanking genes in mouse chromosome 5 may account for the sxl transgenic phenotype (discussed further in Supporting Text).
An evolutionary implication of the model proposed (6) is that a lethally indispensable function for a pseudogene necessitates conservation of that pseudogene, as is true of an essential gene that encodes a polypeptide. Under this model, the mechanism and the pseudogene should be conserved between species, because loss of either would destabilize Mkrn1 and dramatically reduce reproductive fitness as a result of significant neonatal lethality associated with its disruption. However, Mkrn1-p1 is found only in mice and is not present in any other species, not even rat (this article and refs. 8 and 27). As one means to rationalize this inconsistency, it was proposed that other mammalian species use different Mkrn1-derived pseudogenes to perform the same trans-stabilization of mRNA produced from the Mkrn1 source gene (27). This seamless substitution would require that other comparably transcribed Mkrn1 pseudogene loci be poised to assume the important role of trans-regulation, thereby making an already elaborate and tenuous regulatory mechanism even more so. The claim of a functional pseudogene (6, 8, 9, 27) challenging a central tenet of molecular evolutionary theory is also championed by proponents of intelligent design (15). Each of these unlikely scenarios is now shown by our work to be incorrect.
In conclusion, our work establishes that the severe polycystic kidney disease and osteogenesis imperfecta of the sxl transgene-induced mutation (6) does not involve a molecular mechanism of imprinted Mkrn1-p1 pseudogene transcripts acting on Mkrn1 source-gene mRNA stability (6–9). Further studies are needed to identify the disease mechanism and gene(s) involved in these debilitating conditions of the newborn mice. Furthermore, because Mkrn1-p1 is a nonfunctional pseudogene and does not trans-regulate its source Mkrn1 gene as claimed (6–9), our work reestablishes the evolutionary paradigm supported by overwhelming evidence that mammalian pseudogenes are indeed inactive gene relics.
Methods
Bioinformatic Analyses.
Details of BLAST searches and sequences analyzed, as well as mVista and Logo analyses, are given in Supporting Methods in Supporting Text.
Gene-Trap Mapping, Genotyping, and Phenotyping.
The BayGenomics (which can be accessed at http://baygenomics.ucsf.edu) RRB087 gene-trap insertion site determination and genotyping PCRs, as well as morphological and histological analyses of RRB087 gene-trap mice, were performed as described in Supporting Methods.
Mkrn1 and Mkrn1-p1 RT-PCR.
Complete descriptions of PCR primer design and RT-PCR methods, including standard, PstI, and imprinting assays are provided in Supporting Methods.
Real-Time RT-PCR.
Details of the SybrGreen and TaqMan assays for quantitative RT-PCR of Mkrn1 and related and control genes are detailed in Supporting Methods.
DNA Methylation Analysis.
The procedures used for the bisulfite treatment of genomic DNA and the subsequent PCR amplification, cloning, DNA sequencing, and AciI digestion are included in Supporting Methods.
Supplementary Material
Acknowledgments
We thank Dr. Mihaela Stefan and Shanping Li for help with bisulfite modification of DNA; Drs. Arthur L. Caplan, Lorraine Flaherty, Andy Greenfield, Steven Hanes, Randy Morse, Derek Symula, and Konrad Talbot for intellectual contributions; and Drs. David Anders, Richard McCourt, Maria del Carmen Seleme, and Adriana Verschoor for the critical review of the manuscript. R.D.N. performed part of this study at the University of Pennsylvania (Philadelphia). This work was supported by a grant from the National Institutes of Health–National Institute of Allergy and Infectious Diseases (to T.A.G.).
Footnotes
Conflict of interest statement: No conflicts declared.
This paper was submitted directly (Track II) to the PNAS office.
References
- 1.Deininger P. L., Moran J. V., Batzer M. A., Kazazian H. H., Jr. Curr. Opin. Genet. Dev. 2003;13:651–658. doi: 10.1016/j.gde.2003.10.013. [DOI] [PubMed] [Google Scholar]
- 2.Zhang Z., Gerstein M. Curr. Opin. Genet. Dev. 2004;14:328–335. doi: 10.1016/j.gde.2004.06.003. [DOI] [PubMed] [Google Scholar]
- 3.Zhang Z., Carriero N., Gerstein M. Trends Genet. 2004;20:62–67. doi: 10.1016/j.tig.2003.12.005. [DOI] [PubMed] [Google Scholar]
- 4.Wang P. J. Trends Endocrinol. Metab. 2004;15:79–83. doi: 10.1016/j.tem.2004.01.007. [DOI] [PubMed] [Google Scholar]
- 5.Rohozinski J., Bishop C. E. Proc. Natl. Acad. Sci. USA. 2004;101:11695–11700. doi: 10.1073/pnas.0401130101. [DOI] [PMC free article] [PubMed] [Google Scholar]
- 6.Hirotsune S., Yoshida N., Chen A., Garrett L., Sugiyama F., Takahashi S., Yagami K., Wynshaw-Boris A., Yoshiki A. Nature. 2003;423:91–96. doi: 10.1038/nature01535. [DOI] [PubMed] [Google Scholar]
- 7.Lee J. T. Nature. 2003;423:26–28. doi: 10.1038/423026a. [DOI] [PubMed] [Google Scholar]
- 8.Podlaha O., Zhang J. Mol. Biol. Evol. 2004;21:2202–2209. doi: 10.1093/molbev/msh230. [DOI] [PubMed] [Google Scholar]
- 9.Yano Y., Saito R., Yoshida N., Yoshiki A., Wynshaw-Boris A., Tomita M., Hirotsune S. J. Mol. Med. 2004;82:414–422. doi: 10.1007/s00109-004-0550-3. [DOI] [PubMed] [Google Scholar]
- 10.Suzuki M., Hayashizaki Y. BioEssays. 2004;26:833–843. doi: 10.1002/bies.20084. [DOI] [PubMed] [Google Scholar]
- 11.Mattick J. S. Nat. Rev. Genet. 2004;5:316–323. doi: 10.1038/nrg1321. [DOI] [PubMed] [Google Scholar]
- 12.Morey C., Avner P. FEBS Lett. 2004;567:27–34. doi: 10.1016/j.febslet.2004.03.117. [DOI] [PubMed] [Google Scholar]
- 13.Gibbs W. W. Sci. Am. 2003;289(5):26–33. and erratum (2004) 290 (3), 14. [PubMed] [Google Scholar]
- 14.Balakirev E. S., Ayala F. J. Annu. Rev. Genet. 2003;37:123–151. doi: 10.1146/annurev.genet.37.040103.103949. [DOI] [PubMed] [Google Scholar]
- 15.Harris W. S., Calvert J. H. Nat’l Catholic Bioethics Q. 2003;3:531–562. [Google Scholar]
- 16.Gray T. A., Hernandez L., Carey A. H., Schaldach M. A., Smithwick M. J., Rus K., Marshall Graves J. A., Stewart C. L., Nicholls R. D. Genomics. 2000;66:76–86. doi: 10.1006/geno.2000.6199. [DOI] [PubMed] [Google Scholar]
- 17.Gray T. A., Azama K., Whitmore K., Min A., Abe S., Nicholls R. D. Genomics. 2001;77:119–126. doi: 10.1006/geno.2001.6627. [DOI] [PubMed] [Google Scholar]
- 18.Jong M. T., Carey A. H., Caldwell K. A., Lau M. H., Handel M. A., Driscoll D. J., Stewart C. L., Rinchik E. M., Nicholls R. D. Hum. Mol. Genet. 1999;8:795–803. doi: 10.1093/hmg/8.5.795. [DOI] [PubMed] [Google Scholar]
- 19.Jong M. T., Gray T. A., Ji Y., Glenn C. C., Saitoh S., Driscoll D. J., Nicholls R. D. Hum. Mol. Genet. 1999;8:783–793. doi: 10.1093/hmg/8.5.783. [DOI] [PubMed] [Google Scholar]
- 20.Hudson B. P., Martinez-Yamout M. A., Dyson H. J., Wright P. E. Nat. Struct. Mol. Biol. 2004;11:257–264. doi: 10.1038/nsmb738. [DOI] [PubMed] [Google Scholar]
- 21.Huang J., Huang Q., Zhou X., Shen M. M., Yen A., Yu S. X., Dong G., Qu K., Huang P., Anderson E. M., et al. J. Biol. Chem. 2004;279:54110–54116. doi: 10.1074/jbc.M410583200. [DOI] [PubMed] [Google Scholar]
- 22.Kim J. H., Park S. M., Kang M. R., Oh S. Y., Lee T. H., Muller M. T., Chung I. K. Genes Dev. 2005;19:776–781. doi: 10.1101/gad.1289405. [DOI] [PMC free article] [PubMed] [Google Scholar]
- 23.Nerenberg B. T., Taylor J., Bartee E., Gouveia K., Barry M., Fruh K. J. Virol. 2005;79:597–601. doi: 10.1128/JVI.79.1.597-601.2005. [DOI] [PMC free article] [PubMed] [Google Scholar]
- 24.Sorek R., Safer H. M. Nucleic Acids Res. 2003;31:1067–1074. doi: 10.1093/nar/gkg170. [DOI] [PMC free article] [PubMed] [Google Scholar]
- 25.Li E. Nat. Rev. Genet. 2002;3:662–673. doi: 10.1038/nrg887. [DOI] [PubMed] [Google Scholar]
- 26.Lossie A. C., Whitney M. M., Amidon D., Dong H. J., Chen P., Theriaque D., Hutson A., Nicholls R. D., Zori R. T., Williams C. A., Driscoll D. J. J. Med. Genet. 2001;38:834–845. doi: 10.1136/jmg.38.12.834. [DOI] [PMC free article] [PubMed] [Google Scholar]
- 27.Kaneko S., Aki I., Tsuda K., Mekada K., Moriwaki K., Takahata N., Satta Y. Genetics. 2006;172:2421–2429. doi: 10.1534/genetics.105.052910. [DOI] [PMC free article] [PubMed] [Google Scholar]
- 28.Kamath R. S., Fraser A. G., Dong Y., Poulin G., Durbin R., Gotta M., Kanapin A., Le Bot N., Moreno S., Sohrmann M., et al. Nature. 2003;421:231–237. doi: 10.1038/nature01278. [DOI] [PubMed] [Google Scholar]
- 29.Nicholls R. D., Gray T. A. Virus Genes. 2004;29:359–364. doi: 10.1007/s11262-004-7440-1. [DOI] [PubMed] [Google Scholar]
- 30.Senkevich T. G., Koonin E. V., Buller R. M. Virology. 1994;198:118–128. doi: 10.1006/viro.1994.1014. [DOI] [PubMed] [Google Scholar]
- 31.Cattanach B. M., Shibata H., Hayashizaki Y., Townsend K. M., Ball S., Beechey C. V. Cytogenet. Cell Genet. 1998;80:41–47. doi: 10.1159/000014955. [DOI] [PubMed] [Google Scholar]
- 32.Chaillet J. R. Mutat. Res. 1994;307:441–449. doi: 10.1016/0027-5107(94)90255-0. [DOI] [PubMed] [Google Scholar]
- 33.Rakyan V. K., Blewitt M. E., Druker R., Preis J. I., Whitelaw E. Trends Genet. 2002;18:348–351. doi: 10.1016/s0168-9525(02)02709-9. [DOI] [PubMed] [Google Scholar]
- 34.Poirier C., Qin Y., Adams C. P., Anaya Y., Singer J. B., Hill A. E., Lander E. S., Nadeau J. H., Bishop C. E. Genetics. 2004;168:1557–1562. doi: 10.1534/genetics.104.032177. [DOI] [PMC free article] [PubMed] [Google Scholar]
Associated Data
This section collects any data citations, data availability statements, or supplementary materials included in this article.