Abstract
Nucleosomes regulate transcriptional initiation when positioned in the promoter area. This may require the transcription factor (TF) sites to be correlated with the nucleosome positions and phased on the nucleosome surface. If this is the case, one would expect a periodical distribution of TF sites in the vicinity of promoters, with the nucleosomal period of 10.1–10.5 bp. We examined the distributions of putative binding sites of 323 different TFs along 1,057 sequences of the Eukaryotic Promoter Database (release 50) [Cavin Perier, R., Junier, T. & Bucher, P. (1998) Nucleic Acids Res. 26, 353–357] and of 218 TFs on 673 sequences of the Lead Exon Database of human promoter sequences. We obtained a statistically significant overrepresentation of TF sites distributed with the main period of 10.1–10.5 bp in the region −50 to +120 around the transcription start site and in few locations nearby. Correlation of the positioning of the TF sites with the nucleosomes is further reinforced by sequence-directed mapping of the nucleosomes, a method previously developed.
The Human Genome Project is now entering the large-scale sequencing phase. Along with an avalanche of accumulating sequence data, their analysis and functional interpretation beyond mere sequence comparisons and gene finding have become as important. During transcriptional initiation, there is large variety of transcription factors interacting and cooperating in promoter regions in sophisticated ways. To answer the question of how genetic information is processed, promoter identification becomes a necessary step, especially in eukaryotes in which the promoters are involved in developmental control, morphogenesis and cell differentiation, tissue specificity, hormonal communication, and cellular stress responses. Quite extensive data concerning the transcriptional initiation and promoter structure have already been collected (see, for example, ref. 1) but still have not been analyzed thoroughly. The main problem is the limited understanding of underlying molecular recognition mechanisms of transcription initiation (for example, refs. 2 and 3).
Developing computational methods to find promoter sequence patterns in the human genome is vital for achieving the goals of the Human Genome Project. Several algorithms and programs for promoter recognition are available (ref. 4; for review of others, see refs. 5 and 6). They are based mostly on a machine-learning approach and have not paid enough attention to the structural aspects of transcription initiation processes. We believe that these computer methods should be combined with the structural considerations.
In particular, we explore the possible correlation between location of transcription factor (TF) sites and nucleosome positioning in the promoter region. Nucleosomes may serve as both silencers and activators of transcriptional initiation, as do various TFs (7–14). Silencing of transcriptional initiation by the nucleosomes is related to their role as a basic packaging unit of chromatin. In this respect, they compete with the transcription factors for binding sites. On the other hand, nucleosomes usually are rearranged in response to the induction of transcription, and some cooperative interactions between nucleosomes and transcription factors may take place during this process (15–20). Any interference of nucleosomes and position-specific binding of TFs would mean the positional correlation between nucleosomes and TFs.
If, indeed, specific interaction between the chromatin and the transcriptional machinery takes place, then the positioning of nucleosomes and transcription factors should be correlated. One of the main features of nucleosome DNA is the periodic distribution of its sequence elements. In particular, AA, TT, CC, and GG dinucleotides display a pronounced periodic distribution (21, 22). Other di- and trinucleotides may contribute as well to the periodical pattern (23–25). The periodicity emerges only after statistical analysis of large nucleosome sequence ensembles and should not be necessarily apparent in an individual nucleosome sequence (26). It would be natural to expect that some longer oligonucleotides (e.g., some TF binding sites) also would follow similar periodicity.
In several individual examples of positional distributions of the transcription factors, we and others (P. Bucher, personal communication) have found that it is often possible to adjust a certain window in the promoter region in such a way that the nucleosome periodicity [10.3 ± 0.2 bp (21)] becomes visible (not shown). The statistical significance of such individual observations, however, remains unclear. Because there are hundreds of different TFs involved in transcription initiation (see, for example, refs. 27–30), the periodical signal may be enhanced by combining effects of many factors. The purpose of this paper is to explore this possibility.
DATA AND METHODS
Our strategy is in finding the area (window) on the promoter sequences in which the periodicity (10.3 ± 0.2 bp) in multiple TF sites distributions is expressed with the maximal statistical significance. If the periodicity is caused by involvement of the sites in the nucleosomes, and if the nucleosomes have some positional preferences, one would expect the optimal window to be close to the nucleosome DNA size (≈145 bp), specifically located. Indeed, that size appears to be optimal. Larger windows, apparently, exceed the span of the periodicity whereas smaller windows have lower signal/noise ratio (though the signal amplitude may well be the same). A uniform probability model for entire ensemble of windows available appears to be suitable for this problem. We pick, thus, the window in which our signal of interest is the most differing from one randomly expected and evaluate statistical significance of this difference.
As a first step, we extracted 1,057 promoter sequences of mammals, birds, amphibia, insects, and plants from the Eukaryotic Promoter Database (EPD), release 50 (31, 32) defined in the interval (−500 … +100 bases) around the main transcription start site (TSS). Then the following procedure was applied to the sequences: (i)Putative TF binding sites were mapped by using the matrixsearch program (33) on all of the sequences prealigned by their major TSS positions. In total, 75,321 putative binding sites for 323 different TFs were identified by the matrixsearch program with a default cutoff rejecting the matrices with high false positive rate. The maps for each TF were averaged over all of the sequences, resulting in 323 averaged maps. (ii) Spectral analysis (34) of all of the 323 averaged TFs distributions in interval of periods P = 7.0–15.0 (step 0.1 bp) was carried out within the window of length 145 bp (typical nucleosome core size) in scanning steps of 10 bases from positions [(−500 … −356) to (−45 … +100)] relative to the transcription start site. (iii) For the entire data set, we calculated a score, S = N/T, where N is the number of TF sites with the highest amplitude in their spectra at 10.1–10.5 bases and T is the total number of the TF sites occurring more than once inside the window. The statistical significance, dS, of the deviation of the calculated number N from the randomly expected is given by formula
 |
Here, dS is measured in units of standard deviation (StD), and R is the expected number of TF sites with the main period 10.1–10.5 for random uniform spectrum. For the interval of periods tested, P = 7.0–15.0, only R0 = 6.17% should be expected to have the main period at 10.1–10.5 for the random case. The same figure for the interval P = 5.0–25.0 is R0 = 2.49%. The R value is a product of R0 and the total number of different TF sites occurring more than once within a given window. We also repeated the calculations with scanning step 1 bp in intervals ±10 bp around the points with dS > 1.8 StD obtained in step ii. (iv) Because R changes with the interval P, as well as the dS value, we also repeated the calculations for the interval P = 5.0–25.0 (step 0.1) in a window of 145 bp centered at the positions with dS > 2 StD, as calculated in step iii.
EPD 50 sequences do not reach beyond position +100 (see Results and Discussion). To be able to analyze the downstream regions as well, we studied an alternative lead exon database (LEDB) of 673 human promoter sequences (4) (there are only 55 sequences common for both data sets) defined in a broader interval (−600 … +600). Locations of 94,615 putative binding sites of 218 different TFs were mapped on the human sequences, and the procedures described above were repeated in interval of positions from (−500 … −356) to (+191 … +335) relative to the transcription start site.
Because the strongest effects for both sets of the sequences were observed in the area around the TSS (see Results and Discussion), the calculations were performed also with a scanning step (see above) of one base from the positions (−145 … −1) to (−45 … +100) for the EPD sequences and to (+81 … +225) for the LEDB promoters (P = 5.0–25.0; step 0.1; window 145 bp).
RESULTS AND DISCUSSION
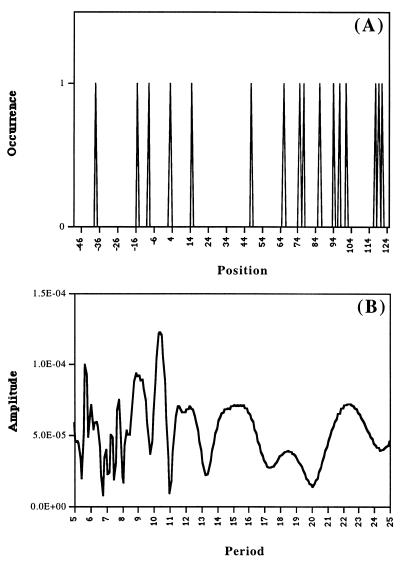
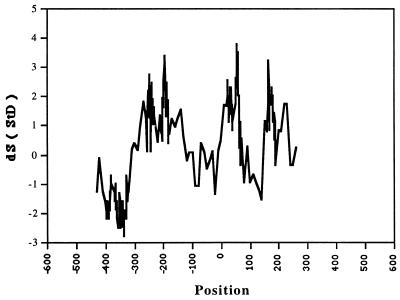
Fig. 1 presents an example of the distribution of TF AhR-XREbf site (35) along LEDB sequences (A) and the periodogram of this distribution (B). Clearly, no statistically sound claims about periodicity of this distribution can be made. Only an analysis of large ensembles of such distributions can be meaningful. The results of such calculations with 218 TFs for the interval of periods P = 7.0–15.0 for the LEDB sequences are presented in Fig. 2. The points correspond to positions of the centers of the periodical 145-bp windows. The highest peaks are obtained for the windows centered at −192, +57, and +167. These main peaks have amplitudes of 3.19–3.75 StD. In similar calculations for the EPD sequences (not shown), the amplitude >3 StD is seen only for the window centered at +21. The periodic intervals downstream could not be seen for the shorter EPD promoter sequences.
Figure 1.
Example of the distribution (A) and spectrum (B) (34) calculated for putative AhR-XREbf transcription factor binding sites mapped by the matrixsearch program inside the window (−46; +124) on the LEDB promoter sequences. Some of the peaks in A are separated by the distances ≈10 × n bp (see, e.g., region 64–94). This also is revealed in the spectrum (B): See the peak at 10.4.
Figure 2.
Locations of periodically distributed TF sites in the vicinity of TSS (position 0). Statistical significance, dS, of the effect is shown for LEDB sequences. The points correspond to positions of the 145-bp window centers. Spectral interval tested is P = 7–15.
To verify and possibly strengthen the effect, calculations on a different interval P should be performed. They are required also to prove the robustness of the results, which is important for the statistical analysis. We tested first a wider interval of periods, P = 5.0–25.0 (step 0.1 bp), for positions for which dS > 2 StD was obtained in previous calculations. For this interval P, the amplitudes of dS = 3.59–3.83 StD were obtained at positions −314 for the EPD and −238 for the LEDB sequences. The significance of the effect in the interval around the TSS grew up to 4.82 StD for a window (−46 … +99) centered at position +26 for the EPD sequences and to 4.83 and 4.92 StD, respectively, for windows (−47 … +98) and (−18 … +127) centered at positions +25 and +54 for the LEDB promoters.
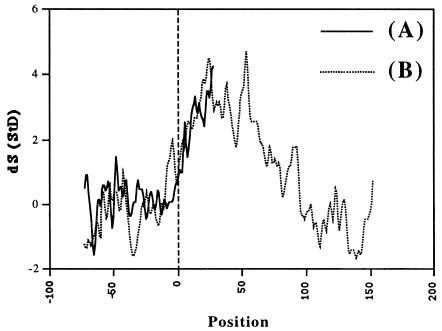
Because the strongest effect for both sequence sets was obtained in the region around the TSS, and the corresponding results were quite consistent, we calculated dS for P = 5.0–25.0 inside the window of 145 bp running with a scanning step of 1 base from (−145 … −1) to (−45 … +100) for the EPD sequences (Fig. 3A) and to (+81 … +225) for the LEDB promoters (Fig. 3B). The results for the two data sets are very similar within the upstream region in which they overlap.
Figure 3.
Statistical significance dS(StD) = (N − R)/SQRT(R) smoothed by 3 points running average for EPD 50 (A) and LEDB (B) sequences. N is the number of TFs with main period 10.1–10.5 bp; R is the number of such TFs expected inside the 145-bp window in a random case. Positions of the window’s centers are presented. The spectral interval tested is P = 5–25.
To further optimize the findings increasing the statistical significance of the results, we varied the length of the windows. In this case, only the LEDB promoter sequences were analyzed because for these the effect obtained was stronger, and they span a larger region. The results of the calculation indicate the most statistically significant effect of 6.68 StD for the windows (−46 … +121) and (−46 … +124), covering the TSS. Note that the size of this window (167–170 bp) is similar to one of chromatosome (36, 37).
One may interpret the observations as pointing to the preferential positioning of the nucleosome centered at ≈+40 ± 15 from the main transcription start site, i.e., mostly downstream from a typical TATA box position. That is, the TATA box typically would be positioned within the 5′ half of the nucleosome DNA or right upstream from it. This is consistent with theoretical results obtained recently by a different approach (38) and with the known experimental data (20). Because the observed preference is of a statistical nature, it may differ from some experimental results for individual sequences (compare to ref. 39). If there are other nucleosomes around, they would be centered at ≈120–250 × n bp from the +40 nucleosome. Because the distances, perhaps, are not exactly the same, the expected maxima of TF sites’ periodicity should be lower. These additional maxima, indeed, are observed, though are statistically less significant. Two more nucleosomes are probably seen upstream, at ≈−315 for the EPD promoters and ≈−195 for the LEDB promoters (Fig. 2). For the latter, there is also a peak at ≈170–220 downstream (Fig. 2). The well pronounced nucleosome periodicity (10.1–10.5), the typical nucleosome center-to-center distances, and the apparent phasing of (at least some) nucleosomes with the transcription starts all indicate that chromatin structure and specific nucleosome positionings around the promoters are substantial part of promoter structure and definition.
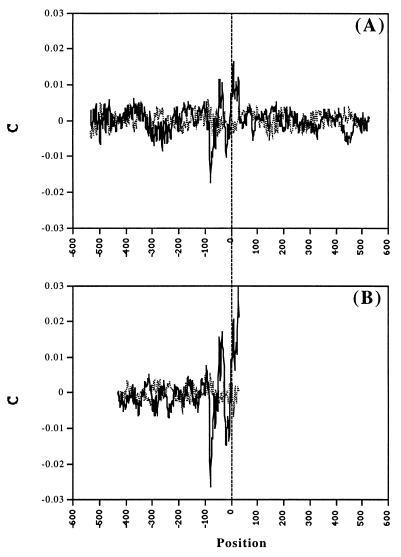
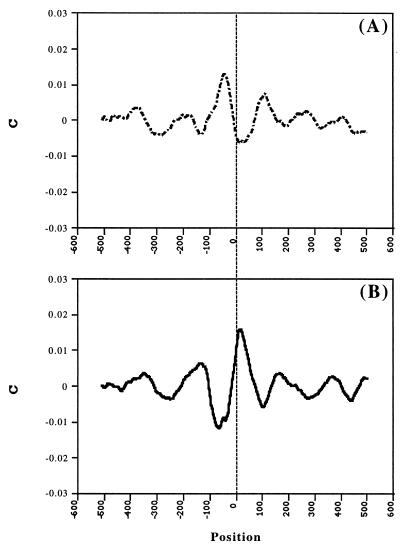
To get an additional verification of the hypothesis on the chromatin-promoter connection, we mapped tentative nucleosome sites on both sets of the sequences according to correlation of their AA and TT dinucleotide distributions with the known AA and TT nucleosome DNA sequence pattern (21). This pattern has been obtained by five different algorithms of multiple alignment of the database of 204 experimentally mapped nucleosome sequences. This database is the most representative of currently available nucleosome databases. No such patterns for sequence motifs other than AA/TT are currently available. Average sequence–pattern correlation maps are presented in Fig. 4 (solid line). The main feature of the maps is the conspicuous peaks separated by ≈60 bp. This cannot correspond to simultaneously present neighboring nucleosomes and is, probably, caused by existence of several types of local promoter chromatin structure, overlapping in the combined plot. In both cases, there is also a region upstream from TSS (around the position −80) with negative correlation to the pattern (as well as with no periodicity in the TF site distribution). This may correspond to avoidance of the nucleosomes in this region. None of these features have been obtained on the control sets of reshuffled sequences (Fig. 4, dotted line).
Figure 4.
Averaged results of nucleosome mapping by AA/TT sequence pattern (21). C is the correlation between the AA/TT distribution of the nucleosomal DNA pattern and the AA/TT distribution of a given sequence. The calculations were performed inside the window of the length of the pattern moving with a step of 1 bp along the sequences. The position of the window’s center is represented. The results are given for C smoothed by 3 points running average and are averaged over all LEDB (A) and EPD (B) sequences (solid line) and those reshuffled (dotted line).
Decomposition of the collection of individual maps into those that contribute to the main peaks at −43 and at +18 (±9) gives, indeed, two different arrangements. The nucleosome ladders are seen better in plots smoothed by 51 points running average (Fig. 5). The nucleosomes (peaks) are seen clearly, centered at −379 (±12), −216 (±16), −44 (±3), +114, +272 (±3), and +407 from TSS in one set and −334 (±14), −143 (±10), +20, +169, and +370 from TSS in the other one. Thus, the distributions of the tentative nucleosomes indicate that there are at least two different types of the nucleosome positioning around TSS. Both the TF sites’ periodicity and the nucleosome maps, thus, strongly indicate that the chromatin structure is an important additional characteristic of the promoter structure.
Figure 5.
C smoothed by 51 points running average for LEDB database. (A) Subset 1 (312 sequences). (B) Subset 2 (361 sequences). The subsets were picked according to preferential contribution of the sequences to one of the main peaks at −43 and +18 in Fig. 4. The results for the EPD sequences are similar (not shown).
According to refs. 40 and 41, the 5′-end of the core promoter area is the most likely target for the promoter activation by transcription factors. We find this region as essentially nonperiodical. This may mean that the region is generally void of the nucleosomes and, thus, TFs may readily interact with the region. The upstream, nonperiodically bound TFs may be required to remove the downstream nucleosome.
On the other hand, the periodically distributed TF sites in the core–promoter area and 1–2 nucleosome distances away may correspond to contact sites between the nucleosomes in their specific three-dimensional arrangements around the promoters. At least two different types of nucleosome positioning around the promoters, suggested by the nucleosome mapping data, may correspond to different types of architecture of the promoter chromatin. The periodicity also may be interpreted as either protective or exposing positioning of the TF sites on the nucleosome surface, depending on the rotational setting of the sites in the nucleosome DNA (15).
To understand transcriptional control and regulation, the interplay between transcription factors and chromatin structure recently has become the focal point of intensive investigations. It may provide new insights into how transcriptional repression and derepression are controlled by local chromatin modification (42). We would not be surprised if those TFs, which contribute the most to the periodical structure, turn out to be related to the general repressors, especially the ones that remodel chromatin structure by histone deacetylation (43, 44).
Acknowledgments
The authors are thankful to A. Neuwald for the text editing, to E. Kolker for kindly providing original program of spectral analysis before publication, and to S. Brunak for providing the preprint before publication. This work was supported by National Institutes of Health Grant HG01696 and Cold Spring Harbor Laboratory Association Award to M.Q.Z.
ABBREVIATIONS
- TF
transcription factor
- EPD
Eukaryotic Promoter Database
- LEDB
Lead Exon Database
- TSS
transcription start site
- StD
standard deviation(s)
References
- 1.Bucher P. J Mol Biol. 1990;212:563–578. doi: 10.1016/0022-2836(90)90223-9. [DOI] [PubMed] [Google Scholar]
- 2.Kornberg R D. Trends Biochem Sci. 1996;21:325–326. [PubMed] [Google Scholar]
- 3.Nikolov D B, Burley S K. Proc Natl Acad Sci USA. 1997;94:15–22. doi: 10.1073/pnas.94.1.15. [DOI] [PMC free article] [PubMed] [Google Scholar]
- 4.Zhang M Q. Genome Res. 1998;8:319–326. doi: 10.1101/gr.8.3.319. [DOI] [PMC free article] [PubMed] [Google Scholar]
- 5.Bucher P, Fickett J W, Hatzigeorgiou A. Comput Appl Biosci. 1996;12:361–362. doi: 10.1093/bioinformatics/12.5.361. [DOI] [PubMed] [Google Scholar]
- 6.Fickett J W, Hatzigeorgiou A G. Genome Res. 1997;7:861–878. doi: 10.1101/gr.7.9.861. [DOI] [PubMed] [Google Scholar]
- 7.Svaren J, Horz W. Curr Opin Genet Dev. 1993;3:219–225. doi: 10.1016/0959-437x(93)90026-l. [DOI] [PubMed] [Google Scholar]
- 8.Svaren J, Horz W. Curr Opin Genet Dev. 1996;6:164–170. doi: 10.1016/s0959-437x(96)80046-3. [DOI] [PubMed] [Google Scholar]
- 9.Paranjape S M, Kamakaka R T, Kadonaga J T. Annu Rev Biochem. 1994;63:265–297. doi: 10.1146/annurev.bi.63.070194.001405. [DOI] [PubMed] [Google Scholar]
- 10.Kornberg R D, Lorch Y. Curr Opin Cell Biol. 1995;7:371–375. doi: 10.1016/0955-0674(95)80092-1. [DOI] [PubMed] [Google Scholar]
- 11.Kingston R E, Bunker C A, Imbalzano A N. Genes Dev. 1996;10:905–920. doi: 10.1101/gad.10.8.905. [DOI] [PubMed] [Google Scholar]
- 12.Peterson C L. Curr Opin Genet Dev. 1996;6:171–175. doi: 10.1016/s0959-437x(96)80047-5. [DOI] [PubMed] [Google Scholar]
- 13.Gottesfeld J M, Forbes D J. Trends Biochem Sci. 1997;22:197–202. doi: 10.1016/s0968-0004(97)01045-1. [DOI] [PubMed] [Google Scholar]
- 14.Grunstein M. Nature (London) 1997;389:349–352. doi: 10.1038/38664. [DOI] [PubMed] [Google Scholar]
- 15.Imbalzano A N, Kwon H, Green M R, Kingston R E. Nature (London) 1994;370:481–485. doi: 10.1038/370481a0. [DOI] [PubMed] [Google Scholar]
- 16.Varga-Weisz P D, Blank T A, Becker P B. EMBO J. 1995;14:2209–2216. doi: 10.1002/j.1460-2075.1995.tb07215.x. [DOI] [PMC free article] [PubMed] [Google Scholar]
- 17.Li Q, Wrange O, Eriksson P. Int J Biochem Cell Biol. 1997;29:731–742. doi: 10.1016/s1357-2725(97)00016-2. [DOI] [PubMed] [Google Scholar]
- 18.Beato M, Eisfeld K. Nucleic Acids Res. 1997;25:3559–3563. doi: 10.1093/nar/25.18.3559. [DOI] [PMC free article] [PubMed] [Google Scholar]
- 19.Imbalzano A N. Methods. 1998;15:303–314. doi: 10.1006/meth.1998.0634. [DOI] [PubMed] [Google Scholar]
- 20.Li G, Chandler S P, Wolffe A P, Hall T C. Proc Natl Acad Sci USA. 1998;95:4772–4777. doi: 10.1073/pnas.95.8.4772. [DOI] [PMC free article] [PubMed] [Google Scholar]
- 21.Ioshikhes I, Bolshoy A, Derenshteyn K, Borodovsky M, Trifonov E N. J Mol Biol. 1996;262:129–139. doi: 10.1006/jmbi.1996.0503. [DOI] [PubMed] [Google Scholar]
- 22.Bolshoy A. Nat Struct Biol. 1995;2:446–448. doi: 10.1038/nsb0695-446. [DOI] [PubMed] [Google Scholar]
- 23.Ulyanov A V, Stormo G D. Nucleic Acids Res. 1995;23:1434–1440. doi: 10.1093/nar/23.8.1434. [DOI] [PMC free article] [PubMed] [Google Scholar]
- 24.Baldi P, Brunak S, Chauvin Y, Krogh A. J Mol Biol. 1996;263:503–510. doi: 10.1006/jmbi.1996.0592. [DOI] [PubMed] [Google Scholar]
- 25.Lowary P T, Widom J. J Mol Biol. 1998;276:19–42. doi: 10.1006/jmbi.1997.1494. [DOI] [PubMed] [Google Scholar]
- 26.Luger K, Mader A W, Richmond R K, Sargent D F, Richmond T J. Nature (London) 1997;389:251–260. doi: 10.1038/38444. [DOI] [PubMed] [Google Scholar]
- 27.Tjian R. Philos Trans R Soc Lond B. 1996;351:491–499. doi: 10.1098/rstb.1996.0047. [DOI] [PubMed] [Google Scholar]
- 28.Wingender, E., Karas, H. & Knuppel, R. (1997) Pac. Symp. Biocomput. 477–485. [PubMed]
- 29.Kel’ A E, Kolchanov N A, Kel’ O V, Romashchenko A G, Anan’ko E A, Ignat’eva E V, Merkulova T I, Podkolodnaia O A, Stepanenko I L, Kochetov A V, et al. Mol Biol (Mosk) 1997;31:626–636. (Article in Russian). [PubMed] [Google Scholar]
- 30.Heinemeyer T, Wingender E, Reuter I, Hermjakob H, Kel A E, Kel O V, Ignatieva E V, Ananko E A, Podkolodnaya O A, Kolpakov F A, et al. Nucleic Acids Res. 1998;26:362–367. doi: 10.1093/nar/26.1.362. [DOI] [PMC free article] [PubMed] [Google Scholar]
- 31.Bucher P, Trifonov E N. Nucleic Acids Res. 1986;14:10009–10026. doi: 10.1093/nar/14.24.10009. [DOI] [PMC free article] [PubMed] [Google Scholar]
- 32.Cavin Perier R, Junier T, Bucher P. Nucleic Acids Res. 1998;26:353–357. doi: 10.1093/nar/26.1.353. [DOI] [PMC free article] [PubMed] [Google Scholar]
- 33.Hertz G Z, Hartzell G W, III, Stormo G D. Comput Appl Biosci. 1990;6:81–92. doi: 10.1093/bioinformatics/6.2.81. [DOI] [PubMed] [Google Scholar]
- 34.Kolker, E. & Trifonov, E. N. (1999) Math. Modell. Sci. Comp.7, in press.
- 35.Faisst S, Meyer S. Nucleic Acids Res. 1992;20:3–26. doi: 10.1093/nar/20.1.3. [DOI] [PMC free article] [PubMed] [Google Scholar]
- 36.Simpson R T. Biochemistry. 1978;17:5524–5531. doi: 10.1021/bi00618a030. [DOI] [PubMed] [Google Scholar]
- 37.Puigdomenech P, Jose M, Ruiz-Carrillo A, Crane-Robinson C. FEBS Lett. 1983;154:151–155. doi: 10.1016/0014-5793(83)80893-x. [DOI] [PubMed] [Google Scholar]
- 38.Pedersen A G, Baldi P, Chauvin Y, Brunak S. J Mol Biol. 1998;281:663–673. doi: 10.1006/jmbi.1998.1972. [DOI] [PubMed] [Google Scholar]
- 39.Sewack G F, Hansen U. J Biol Chem. 1997;272:31118–31129. doi: 10.1074/jbc.272.49.31118. [DOI] [PubMed] [Google Scholar]
- 40.Roeder R G. Trends Biochem Sci. 1996;21:327–335. [PubMed] [Google Scholar]
- 41.Orphanides G, Thierry L, Reinberg D. Genes Dev. 1996;10:2657–2683. doi: 10.1101/gad.10.21.2657. [DOI] [PubMed] [Google Scholar]
- 42.Ashraf S I, Ip Y T. Curr Biol. 1998;7:R683–R686. doi: 10.1016/s0960-9822(98)70435-x. [DOI] [PubMed] [Google Scholar]
- 43.Kiermaier A, Eilers M. Curr Biol. 1997;7:R505–R507. doi: 10.1016/s0960-9822(06)00249-1. [DOI] [PubMed] [Google Scholar]
- 44.Pazin M J, Kadonaga J T. Cell. 1997;89:325–328. doi: 10.1016/s0092-8674(00)80211-1. [DOI] [PubMed] [Google Scholar]


