

Abstract
Molecular functional and metabolic imaging allows visualization of disease-causing processes in living organisms. Here we present a new approach for the functional molecular imaging (FMI) of endogenous tyrosine kinase receptor activity using Met and its ligand, hepatocyte growth factor/scatter factor (HGF/SF), as a model. HGF/SF and Met play significant roles in the biology and pathogenesis of a wide variety of cancers and, therefore, may serve as potential targets for cancer prognosis and therapy. We have previously shown that Met activation by HGF/SF increases oxygen consumption in vitro and results in substantial alteration of blood oxygenation levels in vivo, as measured by blood oxygenation level-dependent magnetic resonance imaging. Using contrast medium (CM) ultrasound imaging, we demonstrate here that HGF/SF induces an increase in tumor blood volume. This increase is evident in small vessels, including vessels that were not detected before HGF/SF treatment. The specificity of the effect was validated by its inhibition using anti-HGF/SF antibodies. This change in tumor hemodynamics, induced by HGF/SF and measured by CM ultrasound, is further used as a tool for Met FMI in tumors. This novel noninvasive molecular imaging technique may be applied for the in vivo diagnosis, prognosis, and therapy of Met-expressing tumors.
Keywords: Receptor tyrosine kinase, Met, hepatocyte growth factor/scatter factor, functional molecular imaging, contrast medium ultrasound
Introduction
Tyrosine kinase growth factor receptors play an important role in normal development, as well as in tumorigenicity and metastasis. Alteration in their structure, quantity, activity, or subcellular localization results in uncontrolled cell growth and/or modification of cell differentiation, which leads to tumor formation. Aberrant signaling through the Met tyrosine kinase receptor and its ligand, hepatocyte growth factor/scatter factor (HGF/SF), has been described for a variety of human cancers (http://www.vai.org/metandcancer). Overexpression of Met and/or HGF/SF mutationally activates Met, and expression of both Met and HGF/SF by the same cell (autocrine loop) contributes to tumorigenesis [1]. Increased Met or HGF/SF expression in human cancers is often associated with high tumor grade and poor prognosis [2,3].
Met was found to be consistently and significantly overexpressed in colorectal carcinoma [4], malignant pleural mesothelioma [5], and gastric carcinoma [6]. In addition, increased levels of Met or HGF/SF were reported in non-small cell lung carcinomas, osteosarcomas, ovarian and pancreatic cancers, and others (summarized in Maulik et al. [2]).
Met and HGF/SF were thoroughly studied in breast cancer. The overexpression and coexpression of Met and HGF/SF were reported in breast carcinoma tissues relative to benign breast tissues [7]. In addition, HGF/SF expression was shown to be a strong and independent predictor of recurrence and survival in human breast cancer [8], and expression of Met was found to be a strong independent predictor of decreased survival [9,10]. Moreover, Met expression was demonstrated as a diagnostic marker for identifying node-negative patients who are likely to develop a more aggressive disease [10].
A disorganized and uncontrolled vascular supply, accompanied by poor oxygenation and lowered pH, is a pathophysiologic hallmark of tumors. Growing tumors exhibiting vascular deficiency or defective microcirculation are deprived of O2, glucose, and other nutrients, resulting in a hypoxic microenvironment that promotes the formation of new blood vessels (for a review, see Folkman [11] and Hanahan and Folkman [12]). Previous observations from our laboratory demonstrated that activation of Met by HGF/SF increases cell oxygen consumption and glycolysis [13]. Characterization of tumor metabolic phenotype by magnetic resonance spectroscopy shows an increase in glucose consumption, glycolysis rate, and cytosolic NADH/NAD ratio, compared with benign tissues [14]. In addition, hypoxia-inducible factor (HIF) proteins induce the elevation of Met levels under hypoxic conditions, resulting in enhanced Met-HGF/SF signaling through Gab-1 and increased cell motility [13,15].
We have previously shown that Met activation by HGF/SF in vivo alters the hemodynamics of normal and malignant Met-expressing tissues. Tumor-bearing BALB/c mice were injected with HGF/SF and were imaged using magnetic resonance imaging (MRI) and Doppler ultrasound. Organs and tumors expressing high levels of Met showed the most substantial alterations in blood oxygenation levels, as measured by blood oxygenation level-dependent MRI. No significant alteration was observed in tumors or in organs that do not express Met [16].
In this study, HGF/SF-induced hemodynamic alterations were used to develop a novel functional molecular imaging (FMI) method based on Met activation. This real-time imaging takes advantage of ultrasound perfusion contrast medium (CM) technology. We show here that Met activation results in major hemodynamic changes, including increased tumor blood volume, increased tumor area with significant blood flow, and opening of existing blood vessels that showed undetectable blood flow before the treatment. This novel FMI technique can be used for the in vivo diagnosis, prognosis, and therapy of Met-expressing tumors.
Materials and Methods
Animal Models
Two animal models were used in this study: 1) xenografts of D1-DMBA-3 (DA3) (a cell line derived from a poorly differentiated mammary adenocarcinoma using dimethylbenzanthracene) [17] in female BALB/c mice; and 2) xenografts of the human breast carcinoma cell line MCF7 in athymic female nude mice. To induce tumors, 5 x 10⁵ cells were injected into the lower left mammary gland of mice. The mice were allowed food and water ad libitum. Tumors were allowed to grow until they had reached a volume of 0.5 to 1.5 cm2 (approximately 20 days) and then were imaged.
DA3 tumor-bearing mice were treated with HGF/SF-neutralizing antibodies (Abs), as previously described [18]. In short, 0.2 mg of anti-HGF/SF (mAbs A-1, A-5, and A-7) per 100 µl per animal was injected intraperitoneally before CM ultrasound FMI.
All studies involving animal models were approved by the Van Andel Research Institute Institutional Animal Care and Use Committee or by the Committee of Animal Use and Care at Tel Aviv University.
CM Ultrasound Imaging
Mice were anesthetized with 2% inhalation anesthesia (isoflurane; Halocarbon Products, River Edge, NJ) delivered with oxygen, using a nonrebreathing anesthetic delivery system (Summit Anastasia Solutions, Bend, OR). Anesthetized mice were placed on a heating pad to maintain body temperature and to minimize temperature-induced changes in blood flow. Hair surrounding the tumor area was removed before imaging using a depilatory cream (Carter Product, New York, NY). An imaging gel was placed on the tumor, and a 27-gauge needle was inserted into the tail vein for repeated intravenous injections. To retain the physiologic conditions and to reduce the volume injected into the mice, first-pass (bolus CM injection and imaging performed on the first time that the CM was washed into the tumor), low-intensity, nondestructive, CM-enhanced ultrasound imaging was performed. The use of CM enables the detection of smaller blood vessels relative to large blood vessels observed by Doppler ultrasound. Ultrasound measurements were carried out at 20 frames/sec, with a fixed 15L8s, 14-MHz linear transducer power (-18 dB/0.25 MI) (Sequoia 512; Acuson, Mountain View, CA). To enable repeated imaging after first-pass imaging, microbubbles were destroyed with a destructive imaging mode, allowing the detection of new microbubbles in the flow to the imaged area.
To localize tumor boundaries and basal blood flow, color Doppler ultrasound was performed. For high-temporal-resolution FMI of Met, CM ultrasound imaging was performed before and after HGF/SF treatment (Figure 1A).
Figure 1.
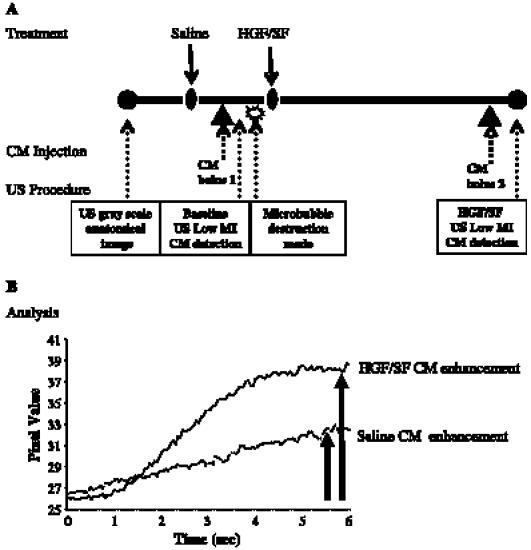
High-temporal-resolution FMI of Met: experimental layout and image analysis. (A) Experimental layout: to localize tumor boundaries and basal blood flow, color Doppler ultrasound was performed. Baseline CM enhancement: mice were injected intravenously with 150 µl of saline and, later, with 150 µl of CM (15 µg/mouse; 5 minutes after the injection of saline), followed by a microbubble destruction mode that was necessary for additional CM imaging. HGF/SF CM enhancement: CM imaging was performed by intravenous injection of 150 µl of HGF/SF (1024 U/mouse purified human HGF/SF) [38] and, 20 minutes later, with 150 µl of CM (15 µg/mouse). (B) Image analysis: the effect of HGF/SF on tumor contrast enhancement was calculated by analyzing the average maximal SI (percentage) on the pixels of the designated ROI before HGF/SF treatment (baseline) and after HGF/SF treatment.
Pre-HGF/SF contrast enhancement was measured by intravenous injection of 150 µl of saline through the tail vein and, 5 minutes later, by intravenous injection of 150 µl of CM bolus I (15 µg/mouse, Definity Perflutren Lipid Microsphere; Bristol-Myers Squibb Medical Imaging, Inc., N. Billerica, MA). CM enhancement in the tumor was measured for 15 seconds at a rate of 20 frames/sec (starting before the injection), while CM enhancement reached plateau. Microbubble destruction mode was applied to clear the signal for additional CM imaging (Figure 1A).
HGF/SF contrast enhancement was measured 20 minutes after HGF/SF injection (1024 U/mouse purified human HGF/SF) by tail vein intravenous injection of 150 µl of saline and, 5 minutes later, by intravenous injection of 150 µl of CM bolus II (15 µg/mouse). CM enhancement in tumor was measured for 15 seconds at a rate of 20 frames/sec (starting before the injection), while CM enhancement reached plateau (Figure 1A).
Imaging settings were standardized and unchanged throughout the experiment. No major near-field artifacts were encountered. Images were obtained by experienced sonographers who were not informed of the treatment status of the animals throughout the study.
Image Analysis
A mouse cursor was used to outline the tumor's regions of interest (ROI) on the B-mode ultrasound image based on structural criteria and echogenicity parameters [19]. To analyze the HGF/SF-induced alteration of intensity and volume, a hypoechoic center was chosen to avoid the ill-defined echogenic border that may contain normal tissues.
CM enhancement was calculated from time series images (clips) using a dedicated functional molecular image analysis software UIA (I-Labs, Petach Tikva, Israel) and a MICA image analysis software (CytoView, Petach Tikva, Israel). Calculations were performed in several steps. 1) For pixelby-pixel analysis, signal percentage alteration was calculated by comparing the background intensity (the average intensity of seven images before CM injection) with the maximum signal intensity (SI; average intensity of seven images after the CM reached plateau) for each pixel. 2) CM alteration maps were calculated for each pixel and then color-coded; blue tones represent reduction in signal and red/yellow tones represent increased intensity. The defined ROI outlined on the B-mode image were overlaid onto appropriate maps. 3) The average pixel intensity of selected ROI was calculated for each frame in the imaging sequence and was fitted to an exponential curve. Gaussian smoothing was applied to the average pixel.
Pre-HGF/SF CM enhancement was calculated from the first bolus imaging as the difference between the maximal SI (maximal enhancement) and the background (see step immediately above). Post-HGF/SF CM enhancement was calculated from the second bolus imaging as the difference between the maximal SI (maximal enhancement) and the background (see step immediately above).
Mapping of the effect of HGF/SF was performed by comparing the CM enhancement maps generated pre-HGF/SF treatment (saline) and post-HGF/SF treatment for each mouse. HGF/SF tumor enhancement effect maps demonstrate alterations in contrast enhancement on HGF/SF treatment (postmap - premap).
The effect of HGF/SF on tumor contrast enhancement was calculated by analyzing the average maximal SI (percentage) on the pixels of the designated ROI before and after HGF/SF treatment (Figure 1B). The effect of HGF/SF on blood volume was calculated by using the average signal calculated on the pixels of the ROI and by fitting it to an exponential curve: Y = C - A(1 - e-βt), where C represents background noise, A represents volume, t represents time, and β represents flow. Statistical analysis was performed using Student's t test (with Microsoft Excel).
Results
HGF/SF Increases Hemodynamics in Met-Expressing Tumors as Measured by Doppler and CM Ultrasound Imaging
The effect of HGF/SF on tumor blood volume was assessed using Doppler and CM real-time perfusion ultrasound imaging. DA3 tumors expressing high Met levels were imaged before and after HGF/SF treatment. As previously described [16], Doppler analysis showed an increase in the number and in the size of blood vessels, indicating an increase in blood flow to tumors following HGF/SF injection (Figure 2, A and B). Ultrasound images are focused on the tumor area. In color Doppler imaging, blood vessels are depicted as blue and red spots; yellow and green represent regions of higher blood flow velocity. However, only large blood vessels with high flow could be detected using this technique.
Figure 2.
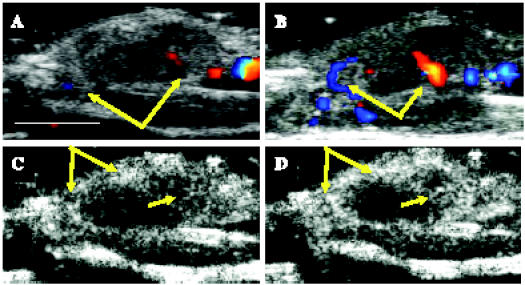
HGF/SF induces increase in blood flow in a Met-expressing mammary adenocarcinoma tumor, as measured by Doppler and CM ultrasound imaging. A mouse bearing a DA3 mammary adenocarcinoma tumor was injected intravenously with saline, followed by HGF/SF. Color Doppler ultrasound imaging was performed (A) before HGF/SF treatment and (B) 20 minutes after HGF/SF treatment. Blood vessels are depicted as blue and red spots; yellow and green represent regions of higher blood flow velocity. Doppler analysis showed an increase in the number and in the size of blood vessels on HGF/SF treatment (yellow arrows). CM ultrasound imaging was performed (C) before HGF/SF treatment and (D) 20 minutes after HGF/SF treatment. On HGF/SF treatment, tumor enhancement was magnified, as shown in higher rim and intratumoral enhancements (yellow arrows). Size bar, 1 cm.
To increase imaging resolution and to enable better quantification, CM ultrasound imaging was performed. We measured the magnitude of the HGF/SF effect on tumor CM enhancement before and after treatment. We found that, on HGF/SF treatment, tumor enhancement was magnified, showing higher rim and intratumoral enhancement (Figure 2, C and D, yellow arrows). Both color Doppler and CM analysis indicated an increase in blood volume to the tumors on HGF/SF treatment.
To study the time dependency of the HGF/SF effect on CM tumor enhancement, CM imaging was performed before, 20 minutes after, and 35 minutes after HGF/SF administration by repeated injection and destruction of CM. HGF/SF-induced tumor CM enhancement was assessed for each mouse by quantifying the SI in the tumor (ROI was defined according to anatomy and structural criteria; Figure 3A) for each time point (Figure 3B). Each fitting curve represents the average pixel intensity of the selected ROI, as calculated for each frame in the imaging sequence (20 frames/sec for 15 seconds after CM injection).
Figure 3.
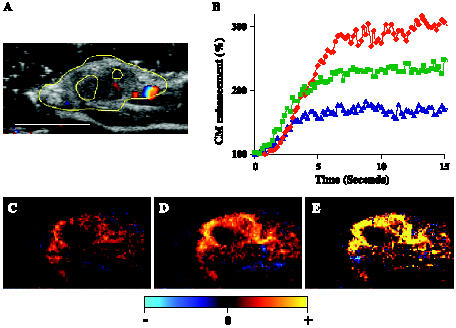
HGF/SF effect on tumor enhancement: time dependency and mapping. A mouse bearing a DA3 mammary adenocarcinoma tumor was injected intravenously with saline, followed by HGF/SF. CM ultrasound imaging was performed before HGF/SF treatment and 20 minutes after HGF/SF treatment. (A) The tumor was imaged using color Doppler ultrasound. For further calculation and quantification, the tumor was outlined (yellow mark) to specify the ROI based on structural criteria. Size bar, 1 cm. (B) A graph representing alterations of CM enhancement on HGF/SF treatment for marked ROI (panel A, yellow). CM imaging was performed before (blue curve), 20 minutes after (red curve), and 35 minutes after (green curve) HGF/SF treatment. Each curve demonstrates the average tumor enhancement after CM injection, calculated for 15 seconds (for each frame; 20 frames/sec). To normalize the signal, the background intensity was calculated as 100%. Percent SI increased by approximately two-fold and peaked 20 minutes after HGF/SF injection. (C–E) Mapping HGF/SF effects on tumor enhancement. CM ultrasound SI color-coded maps were generated (C) before HGF/SF injection and (D) 20 minutes after HGF/SF injection. Brighter red and yellow colors represent higher SI (D versus C). The HGF/SF effect was mapped as the difference in SI before and after HGF/SF injection (E), where bright yellow represents a significant increase in average SI on HGF/SF treatment.
The increase in CM SI peaked by approximately two-fold at 20 minutes after HGF/SF injection. For further analysis, we chose 20 minutes as our optimal time for the increase in HGF/SF-induced tumor contrast enhancement. CM enhancement levels were quantified and color-coded. Saline (pre-HGF/SF treatment) (Figure 3C) and post-HGF/SF treatment (Figure 3D) CM enhancements were mapped. Brighter red and yellow colors represent higher SI. The HGF/SF effect was mapped by subtracting the saline map from the map obtained 20 minutes after HGF/SF treatment (Figure 3E); bright yellow represents a significant increase in average SI on HGF/SF treatment. These results demonstrate that HGF/SF treatment dramatically increases CM enhancement in the tumor area.
Specificity of HGF/SF Effects on Tumor CM Enhancement—Validation by Inhibition Using Anti-HGF/SF Ab
To validate the specificity of HGF/SF effects and to ascertain that the hemodynamic responses are not influenced by bolus injection of the CM, the effect of saline and CM without HGF/SF was assessed. For each mouse, CM enhancement was compared before and after saline injection (as described in the Materials and Methods section). To evaluate the magnitude of the saline effect, we used statistical analysis on a group of seven mice. Our results show that saline and CM do not increase the average CM enhancement (0.96-fold induction; P = .9).
To further validate the specificity of HGF/SF effects on tumor CM enhancement, mice bearing DA3 tumors were injected with an anti-human HGF/SF Ab cocktail, which recognizes and neutralizes human HGF/SF and not the endogenous mouse HGF/SF [18]. HGF/SF-induced tumor CM enhancement was blocked when HGF/SF was administered concurrent with, or after, Ab administration. Quantified enhancement levels were color-coded and mapped before and after HGF/SF treatment (Figure 4). Mapping of enhancement differences showed that HGF/SF effects on tumor CM enhancement were significantly inhibited when the animals were treated with the Ab cocktail. Overall, an average inhibition of 82% was detected in all mice tested (n = 7, P =.05).
Figure 4.
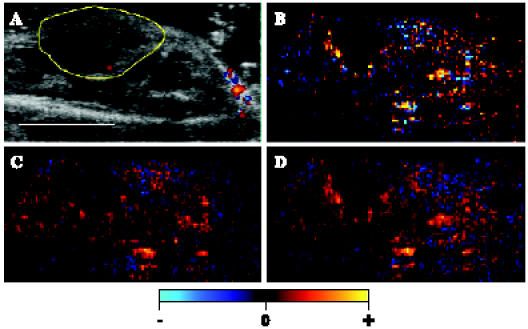
Inhibition of HGF/SF effects on tumor enhancement by HGF/SF-neutralizing Ab. A mouse bearing a DA3 mammary adenocarcinoma tumor was injected intravenously with saline, followed by HGF/SF. The tumors were injected with anti-human HGF/SF Ab cocktail before treatment or with HGF treatment. CM ultrasound imaging was performed before HGF/SF treatment and 20 minutes after HGF/SF treatment. (A) The tumor was imaged using color Doppler ultrasound. For further calculation and quantification, the tumor was outlined (yellow mark) to specify the ROI based on structural criteria. Size bar, 1 cm. (B–D) CM ultrasound SI color-coded maps were generated (C) before HGF/SF + HGF/SF-neutralizing Ab treatment and (D) 20 minutes after HGF/SF + HGF/SF-neutralizing Ab treatment. Brighter red and yellow colors represent higher SI. (B) The blocking of the HGF/SF effect was mapped as the difference in SI before and after HGF/SF injection, where brighter color represents an increase in average SI on HGF/SF treatment.
HGF/SF-Induced Alteration of Tumor Blood Volume and Velocity
The alteration in CM enhancement on HGF/SF treatment was assessed for each mouse by comparing the CM enhancement before and after HGF/SF treatment (as described in the Materials and Methods section). To evaluate the magnitude of the HGF/SF effect, we used statistical analysis on a group of 18 mice (Figure 5A). Our results show that HGF/SF increased the average CM enhancement by 1.8-fold (P = .004).
Figure 5.
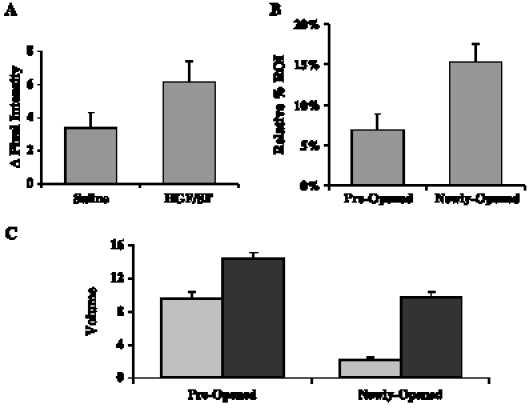
Quantification of HGF/SF-induced increase in tumor volume. Eighteen mice bearing DA3 mammary adenocarcinoma tumors were injected intravenously with saline, followed by HGF/SF. CM ultrasound imaging was performed before HGF/SF treatment and 20 minutes after HGF/SF treatment. (A) HGF/SF increases CM SI. The average calculated alteration of SI (pixel intensity) before HGF/SF treatment (saline) and after HGF/SF treatment (HGF/SF) is shown. Standard error bars are indicated. HGF/SF increased the average CM signal enhancement by 1.8-fold (P = .004). (B) HGF/SF increases the area with measurable flow. Areas that showed a detectable signal before HGF/SF treatment were designated “preopened”; areas that did not show a detectable signal before HGF/SF treatment and showed a detectable signal after HGF/SF treatment were designated “newly opened.” A comparison of areas in the ROI with detectable blood flow before and after HGF/SF treatment showed a 3.62-fold increase (n = 18, P < .0001) in areas with significant enhancement. (C) HGF/SF increases blood volume. Areas that showed a detectable signal before HGF/SF treatment were designated “preopened”; areas that did not show a detectable signal before HGF/SF treatment and showed a detectable signal after HGF/SF treatment were designated “newly opened.” The average tumor CM enhancement before HGF/SF treatment (gray bars) and after HGF/SF treatment (black bar) that was calculated from time series images (20 frames/sec for 15 seconds after CM injection) of the preopened and newly opened regions was fitted to an exponential curve Y = C - A(1 - e-βt), where C represents background noise, A represents volume, β represents velocity, and t represents time. A 1.5-fold volume increase was observed on HGF/SF treatment in preopened vessels (n = 18, P < .0001), whereas in newly opened vessels, a 4.49-fold increase (n = 18, P < .0001) was obtained. These analyses demonstrate that HGF/SF opens new blood vessels with high volume.
To further validate the HGF/SF effect on tumor blood volume, we assessed the tumor areas with significant CM enhancement in response to HGF/SF treatment. Blood vessels/pixels that show measurable enhancement before HGF/SF treatment were designated as “preopened” vessel areas, whereas “newly opened” blood vessel areas refer to areas in which vessels that did not show any measurable enhancement before treatment had measurable enhancement on treatment. We calculated the differences in the number of pixels with measurable CM enhancement in the tumor area before and after treatment (Figure 5B). HGF/SF increases the areas with significant enhancement by 2.219-fold, on average (n= 18, P = .0012).
HGF/SF-induced changes in blood velocity and volume were studied by calculating the average tumor CM enhancement from time series images (20 frames/sec for 15 seconds after CM injection) and by fitting them to an exponential curve (see the Materials and Methods section). A 1.5-fold volume increase was observed on HGF/SF treatment in preopened vessels (n = 18, P < .0001), whereas in newly opened vessels, a 4.49-fold increase (n = 18, P < .0001) was obtained in regions that did show very low enhancements before HGF/SF treatment (Figure 5C). HGF/SF showed a small, insignificant effect on blood velocity in all blood vessels. These analyses demonstrate that HGF/SF opens new blood vessels with high volume and low velocity.
HGF/SF-Induced Increase in Tumor Blood Volume in the Human Breast Cancer Cell Line MCF7
To study the HGF/SF treatment effect on tumor blood volume in a human breast cell line, we used nude mice bearing MCF7 tumors. The alteration of CM SI was studied for each mouse by comparing the CM enhancement before and after HGF/SF treatment. Statistical evaluation of the magnitude of the HGF/SF effect showed that HGF/SF increases the average CM enhancement by 1.37-fold (Figure 6; n= 7, P = .01). HGF/SF-induced changes in blood velocity and volume were studied by calculating the average tumor CM enhancement from time series images (20 frames/sec for 15 seconds after CM injection) and by fitting them to an exponential curve (see the Materials and Methods section). A 1.2-fold volume increase was observed on HGF/SF treatment (n = 7, P < .025).
Figure 6.
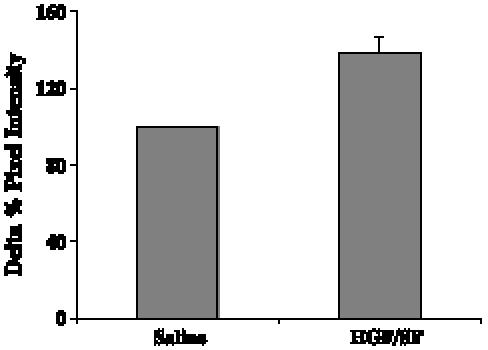
HGF/SF induces increased SI: human breast cancer cells. Seven nude mice bearing MCF7 breast adenocarcinoma tumors were injected intravenously with saline, followed by HGF/SF. CM ultrasound imaging was performed before HGF/SF treatment and 20 minutes after HGF/SF treatment. The average calculated alteration of SI (percentage change in pixel intensity) before HGF/SF treatment (saline) and after HGF/SF treatment (HGF/SF) is shown. Standard error bars are indicated. HGF/SF increased the average CM signal enhancement by 1.37-fold (P = .01).
Met levels in MCF7 cells are lower that those in DA3 cells [20,21]; therefore, our results may reflect differences in Met levels between these two cell lines and may indicate that the HGF/SF-induced increase in blood volume is dependent on Met levels in the tumor.
Discussion
We have previously reported that tumors expressing high levels of Met show the most substantial alterations in blood oxygenation levels, as measured by blood oxygenation level-dependent MRI. No significant alteration was observed in tumors or in organs that do not express Met [16].
Diagnostic ultrasound has the advantage of producing real-time images with excellent temporal resolution. However, the task of mapping tumor vessels with ultrasound has previously been difficult due to acoustic blood signals, which are below that of the surrounding vessel walls. These low-signal levels prevent traditional Doppler techniques from being used to accurately assess tumor microvascular flow rates [22]. Moreover, blood flow rate in the tumor may be significantly lower than that in normal tissues due to the highly tortuous vessel structure and increased flow resistance [23]. The use of intravascular microbubble contrast agents increases ultrasound sensitivity to capillary-sized vessels and very low flow rates while maintaining the ability to detect morphologic information from traditional B-mode ultrasound imaging [24]. Some studies provided preliminary evidence that microbubble-induced enhancement could be useful in tumor diagnosis [25].
We have further developed a first-pass CM ultrasound technique that takes advantage of several recent improvements in ultrasound imaging technology [26]. We are employing a nondestructive method to measure the first pass. This flow measurement technique is based on the assumption that contrast microbubbles enter tumor circulation at a constant rate [27]. We have documented that an intensity change in specific CM ultrasound signals is detectable after HGF/SF injections. We show here that Met activation results in an increased tumor area with significant blood volume and in major increases in total tumor blood volume. The increase in blood volume is a consequence of the opening of blood vessels that, before treatment, showed undetectable blood volume and are considered “newly opened,” with a 4.49-fold increase after HGF/SF treatment. It was recently shown that tumors with small, flattened vessels show a significantly higher resistance to microbubble perfusion than to MRI contrast agents and appear scarcely vascularized on CM examination, despite a vessel volume that is adequate for normal function [28]. Here we demonstrate that HGF/SF reduces the resistance of tumor vessels.
Aggressive tumors often have insufficient blood supply, partly because the tumor cells grow faster than endothelial cells and partly because a newly formed vascular supply is disorganized [29,30]. Under such microenvironment, tumor cells are exposed to both hypoxia and nutrient deprivation [31,32]. In tumor cells exposed to hypoxia, HIF-1, which is a transcription factor composed of HIF-1α and HIF-1β subunits [33], is activated to promote the transcription of several genes, such as glucose transporters, glycolytic enzymes, and angiogenic factors [34]. The importance of angiogenesis in tumor growth and metastasis has been well documented [11,12]. Tumor enlargement and metastasis formation are dependent on this process. Angiogenesis creates new blood vessels to the tumor, reduces anaerobic conditions in the tumor, and enables tumor growth and metastasis progression [12]. In this paper, we suggest an additional mechanism for tumor cell survival under anaerobic conditions. A tyrosine kinase oncogenic signal induces an increase in blood flow and in blood volume to the tumor and reduces anaerobic conditions. We mapped the alteration in CM SI induced by HGF/SF. This mapping is an estimation of blood volume alterations in different regions of the tumor.
The data presented here demonstrate, for the first time, a dramatic increase in blood flow to the tumor as a result of the activation of the Met tyrosine kinase growth factor receptor, which plays a major role in tumor proliferation and metastasis. The dramatic increase in the area of significant flow and tumor blood volume is shown to be primarily a consequence of the opening of blood vessels that did not show detectable flow before HGF/SF treatment. Based on regular color Doppler or CM ultrasound imaging, these areas can be misinterpreted as necrotic areas. Met FMI using HGF/SF treatment reveals that these areas contain viable tumor tissues.
A competition theory-based model proposed by Gatenby [35] suggests that the metabolic changes associated with transformation manipulate the tumor microenvironment in a way that favors the growth of tumor cells at the expense of normal cells. We demonstrate that elevation of tyrosine signaling in the tumor will also increase blood flow to the tumor. Increased flow in blood vessels leads to increased levels of oxygen, glucose, and other nutrients supplied to the tumor.
The molecular mechanisms of the Met-HGF/SF-induced alteration of hemodynamics are not fully understood. We have previously suggested two basic mechanisms (direct and indirect) of the effect of Met signaling on tumor cells [16]. The indirect mechanism suggests that HGF/SF affects the blood vessels and changes the systemic blood flow. Met signaling was shown to be activated in endothelial cells, favoring the model of blood vessel activation by HGF/SF. The direct mechanism suggests that HGF/SF, through Met signaling in tumor cells, causes local hypoxia, which in turn induces an alteration in blood flow. In addition, we have previously shown that Met induces mitochondrial activity [36], and we were able to show recently that Met activation induces mitochondrial hyperpolarization and ATP synthesis (data not shown). The direct mechanism is supported by published data showing that Met is involved in the HIF-1α hypoxic pathway [37].
Several new molecular therapies, including the potential use of anti-Met therapy, are cytostatic rather than cytotoxic—meaning that these therapies inhibit cell growth rather than promote cell death. Classic imaging measuring tumor location, diameter, and volume may no longer provide an accurate reading of a tumor in its cytostatic state and of the patient's overall condition. Moreover, the traditional standards for drug dosing are rendered obsolete because molecularly targeted therapies may be largely free of side effects. Met FMI, as demonstrated in this paper, can serve as a powerful system that measures the potential effect of anti-Met inhibitors, can be used to screen patients who might benefit from an anti-Met treatment, and can be used to follow up on treatment response.
The results presented here further demonstrate the complex biology induced by the tumor as it recruits more energy resources from its host tissue. Recruitment of energy by the tumor does not end with angiogenesis; it proceeds with increased blood flow to the tumor, which supplies extensive energy requirements that allow tumor growth and metastasis.
Footnotes
This work was supported, in part, by research grants from the National Institutes of Health (P50CA93990), the Michigan Economic Development Corporation and the Michigan Technology Tri-Corridor (MAMC085P1000815), and the Breast Cancer Research Foundation.
References
- 1.Birchmeier C, Birchmeier W, Gherardi E, Vande Woude GF. Met, metastasis, motility and more. Nat Rev Mol Cell Biol. 2003;4(12):915–925. doi: 10.1038/nrm1261. [DOI] [PubMed] [Google Scholar]
- 2.Maulik G, Shrikhande A, Kijima T, Ma PC, Morrison PT, Salgia R. Role of the hepatocyte growth factor receptor, c-Met, in oncogenesis and potential for therapeutic inhibition. Cytokine Growth Factor Rev. 2002;13(1):41–59. [Google Scholar]
- 3.Qian CN, Guo X, Cao B, Kort EJ, Lee CC, Chen J, Wang LM, Mai WY, Min HQ, Hong MH, et al. Met protein expression level correlates with survival in patients with late-stage nasopharyngeal carcinoma. Cancer Res. 2002;62(2):589–596. [PubMed] [Google Scholar]
- 4.Liu C, Park M, Tsao MS. Overexpression of c-Met protooncogene but not epidermal growth factor receptor or c-erbB-2 in primary human colorectal carcinomas. Oncogene. 1992;7(1):181–185. [PubMed] [Google Scholar]
- 5.Tolnay E, Kuhnen C, Wiethege T, Konig JE, Voss B, Muller KM. Hepatocyte growth factor/scatter factor and its receptor c-Met are overexpressed and associated with an increased microvessel density in malignant pleural mesothelioma. J Cancer Res Clin Oncol. 1998;124(6):291–296. doi: 10.1007/s004320050171. (in process citation) [DOI] [PubMed] [Google Scholar]
- 6.Kuniyasu H, Yasui W, Yokozaki H, Kitadai Y, Tahara E. Aberrant expression of c-Met mRNA in human gastric carcinomas. Int J Cancer. 1993;55(1):72–75. doi: 10.1002/ijc.2910550114. [DOI] [PubMed] [Google Scholar]
- 7.Jin L, Fuchs A, Schnitt SJ, Yao Y, Joseph A, Lamszus K, Park M, Goldberg ID, Rosen EM. Expression of scatter factor and c-Met receptor in benign and malignant breast tissue. Cancer. 1997;79(4):749–760. doi: 10.1002/(sici)1097-0142(19970215)79:4<749::aid-cncr12>3.0.co;2-#. [DOI] [PubMed] [Google Scholar]
- 8.Yamashita J, Ogawa M, Yamashita S, Nomura K, Kuramoto M, Saishoji T, Shin S. Immunoreactive hepatocyte growth factor is a strong and independent predictor of recurrence and survival in human breast cancer. Cancer Res. 1994;54(7):1630–1633. [PubMed] [Google Scholar]
- 9.Tsarfaty I, Alvord WG, Resau JH, Altstock RT, Lidereau R, Bieche I, Bertrand F, Horev J, Klabansky RL, Keydar I, et al. Alteration of met protooncogene product expression and prognosis in breast carcinomas. Anal Quant Cytol Histol. 1999;21(5):397–408. [PubMed] [Google Scholar]
- 10.Ghoussoub RAD, Dillon DA, D'Aquila T, Rimm EB, Fearon ER, Rimm DL. Expression of c-Met is a strong independent prognostic factor in breast carcinoma. Cancer. 1998;82(8):1513–1520. doi: 10.1002/(sici)1097-0142(19980415)82:8<1513::aid-cncr13>3.0.co;2-7. [DOI] [PubMed] [Google Scholar]
- 11.Folkman J. Angiogenesis and angiogenesis inhibition: an overview. Exs. 1997;79:1–8. doi: 10.1007/978-3-0348-9006-9_1. [DOI] [PubMed] [Google Scholar]
- 12.Hanahan D, Folkman J. Patterns and emerging mechanisms of the angiogenic switch during tumorigenesis. Cell. 1996;86(3):353–364. doi: 10.1016/s0092-8674(00)80108-7. [DOI] [PubMed] [Google Scholar]
- 13.Kaplan O, Firon M, Vivi A, Navon G, Tsarfaty I. HGF/SF activates glycolytic and oxidative phosphorylation pathways of energy production in DA3 murine mammary cancer cells—NMR spectroscopy and confocal laser microscopy studies. Neoplasia. 2000;2(4):365–377. doi: 10.1038/sj.neo.7900103. [DOI] [PMC free article] [PubMed] [Google Scholar]
- 14.Stubbs M, Bashford CL, Griffiths JR. Understanding the tumor metabolic phenotype in the genomic era. Curr Mol Med. 2003;3(1):49–59. doi: 10.2174/1566524033361645. [DOI] [PubMed] [Google Scholar]
- 15.Pennacchietti S, Michieli P, Galluzzo M, Mazzone M, Giordano S, Comoglio PM. Hypoxia promotes invasive growth by transcriptional activation of the met protooncogene. Cancer Cell. 2003;3(4):347–361. doi: 10.1016/s1535-6108(03)00085-0. [DOI] [PubMed] [Google Scholar]
- 16.Shaharabany M, Abramovitch R, Kushnir T, Tsarfaty G, Ravid-Megido M, Horev J, Ron R, Itzchak Y, Tsarfaty I. In vivo molecular imaging of met tyrosine kinase growth factor receptor activity in normal organs and breast tumors. Cancer Res. 2001;61(12):4873–4878. [PubMed] [Google Scholar]
- 17.Fu Y, Watson G, Jimenez JJ, Wang Y, Lopez DM. Expansion of Immunoregulatory macrophages by granulocyte-macrophage colony-stimulating factor derived from a murine mammary tumor. Cancer Res. 1990;50:227–234. [PubMed] [Google Scholar]
- 18.Cao B, Su Y, Oskarsson M, Zhao P, Kort EJ, Fisher RJ, Wang LM, Vande Woude GF. Neutralizing monoclonal antibodies to hepatocyte growth factor/scatter factor (HGF/SF) display antitumor activity in animal models. Proc Natl Acad Sci USA. 2001;98(13):7443–7448. doi: 10.1073/pnas.131200498. [DOI] [PMC free article] [PubMed] [Google Scholar]
- 19.Stavros AT, Thickman D, Rapp CL, Dennis MA, Parker SH, Sisney GA. Solid breast nodules: use of sonography to distinguish between benign and malignant lesions. Radiology. 1995;196(1):123–134. doi: 10.1148/radiology.196.1.7784555. [DOI] [PubMed] [Google Scholar]
- 20.Parr C, Jiang WG. Expression of hepatocyte growth factor/scatter factor, its activator, inhibitors and the c-Met receptor in human cancer cells. Int J Oncol. 2001;19(4):857–863. [PubMed] [Google Scholar]
- 21.Firon M, Shaharabany M, Altstock R, Horev J, Abramovici A, Resau J, Vande Woude G, Tsarfaty I. Dominant-negative met reduces tumorigenicity-metastasis and increases tubule formation in mammary cells. Oncogene. 2000;19(20):2386–2397. doi: 10.1038/sj.onc.1203557. [DOI] [PubMed] [Google Scholar]
- 22.Chomas JE, Pollard RE, Sadlowski AR, Griffey SM, Wisner ER, Ferrara KW. Contrast-enhanced US of microcirculation of superficially implanted tumors in rats. Radiology. 2003;229(2):439–446. doi: 10.1148/radiol.2292020536. [DOI] [PubMed] [Google Scholar]
- 23.Sivridis E, Giatromanolaki A, Koukourakis MI. The vascular network of tumours—what is it not for? J Pathol. 2003;201(2):173–180. doi: 10.1002/path.1355. [DOI] [PubMed] [Google Scholar]
- 24.Ragavendra N, Chen H, Powers JE, Nilawat C, Robert JM, Carangi C, Laifer-Narin SL. Harmonic imaging of porcine intraovarian arteries using sonographic contrast medium: initial findings. Ultrasound Obstet Gynecol. 1997;9(4):266–270. doi: 10.1046/j.1469-0705.1997.09040266.x. [DOI] [PubMed] [Google Scholar]
- 25.Kedar RP, Cosgrove D, McCready VR, Bamber JC, Carter ER. Microbubble contrast agent for color Doppler US: effect on breast masses. Work in progress. Radiology. 1996;198(3):679–686. doi: 10.1148/radiology.198.3.8628854. [DOI] [PubMed] [Google Scholar]
- 26.Krix M, Kiessling F, Vosseler S, Kiessling I, Le-Huu M, Fusenig NE, Delorme S. Comparison of intermittent-bolus contrast imaging with conventional power Doppler sonography: quantification of tumour perfusion in small animals. Ultrasound Med Biol. 2003;29(8):1093–1103. doi: 10.1016/s0301-5629(03)00060-7. [DOI] [PubMed] [Google Scholar]
- 27.Pollard RE, Sadlowski AR, Bloch SH, Murray L, Wisner ER, Griffey S, Ferrara KW. Contrast-assisted destruction-replenishment ultrasound for the assessment of tumor microvasculature in a rat model. Technol Cancer Res Treat. 2002;1(6):459–470. doi: 10.1177/153303460200100606. [DOI] [PubMed] [Google Scholar]
- 28.Galie M, D'Onofrio M, Montani M, Amici A, Calderan L, Marzola P, Benati D, Merigo F, Marchini C, Sbarbati A. Tumor vessel compression hinders perfusion of ultrasonographic contrast agents. Neoplasia. 2005;7(5):528–536. doi: 10.1593/neo.04730. [DOI] [PMC free article] [PubMed] [Google Scholar]
- 29.Vaupel P, Kallinowski F, Runkel S, Schlenger K, Fortmeyer HP. Blood flow and oxygen consumption rates of human gynecological tumors xenografted into mu/mu-rats. Strahlenther Onkol. 1989;165(7):502. [PubMed] [Google Scholar]
- 30.Richard DE, Berra E, Pouyssegur J. Angiogenesis: how a tumor adapts to hypoxia. Biochem Biophys Res Commun. 1999;266(3):718–722. doi: 10.1006/bbrc.1999.1889. [DOI] [PubMed] [Google Scholar]
- 31.Wang GL, Jiang BH, Rue EA, Semenza GL. Hypoxia-inducible factor 1 is a basic-helix-loop-helix-PAS heterodimer regulated by cellular O2 tension. Proc Natl Acad Sci USA. 1995;92(12):5510–5514. doi: 10.1073/pnas.92.12.5510. [DOI] [PMC free article] [PubMed] [Google Scholar]
- 32.Guillemin K, Krasnow MA. The hypoxic response: huffing and HIFing. Cell. 1997;89(1):9–12. doi: 10.1016/s0092-8674(00)80176-2. [DOI] [PubMed] [Google Scholar]
- 33.Blancher C, Harris AL. The molecular basis of the hypoxia response pathway: tumour hypoxia as a therapy target. Cancer Metastasis Rev. 1998;17(2):187–194. doi: 10.1023/a:1006002419244. [DOI] [PubMed] [Google Scholar]
- 34.Chen J, Zhao S, Nakada K, Kuge Y, Tamaki N, Okada F, Wang J, Shindo M, Higashino F, Takeda K, et al. Dominant-negative hypoxia-inducible factor-1 alpha reduces tumorigenicity of pancreatic cancer cells through the suppression of glucose metabolism. Am J Pathol. 2003;162(4):1283–1291. doi: 10.1016/s0002-9440(10)63924-7. [DOI] [PMC free article] [PubMed] [Google Scholar]
- 35.Gatenby RA. The potential role of transformation-induced metabolic changes in tumor-host interaction. Cancer Res. 1995;55(18):4151–4156. [PubMed] [Google Scholar]
- 36.Yerushalmi GM, Leibowitz-Amit R, Shaharabany M, Tsarfaty I. Met-HGF/SF signal transduction induces mimp, a novel mitochondrial carrier homologue, which leads to mitochondrial depolarization. Neoplasia. 2002;4(6):510–522. doi: 10.1038/sj.neo.7900272. [DOI] [PMC free article] [PubMed] [Google Scholar]
- 37.Hayashi M, Sakata M, Takeda T, Tahara M, Yamamoto T, Okamoto Y, Minekawa R, Isobe A, Ohmichi M, Tasaka K, et al. Up-regulation of Met expression through HIF-1{alpha} is involved in trophoblast invasion under low-oxygen tension. Endocrinology. 2005;146(11):4628–4689. doi: 10.1210/en.2005-0416. [DOI] [PubMed] [Google Scholar]
- 38.Rong S, Oskarsson M, Faletto D, Tsarfaty I, Resau JH, Nakamura T, Rosen E, Vande Woude GF. Tumorigenesis induced by coexpression of human hepatocyte growth factor and the human met protooncogene leads to high levels of expression of the ligand and receptor. Cell Growth Differ. 1993;4(7):563–569. [PubMed] [Google Scholar]