Abstract
Concerns over bioterrorism and emerging diseases have led to the widespread use of epidemic models for evaluating public health strategies. Partly because epidemic models often capture the dynamics of prior epidemics remarkably well, little attention has been paid to how uncertainty in parameter estimates might affect model predictions. To understand such effects, we used Bayesian statistics to rigorously estimate the uncertainty in the parameters of an epidemic model, focusing on smallpox bioterrorism. We then used a vaccination model to translate the uncertainty in the model parameters into uncertainty in which of two vaccination strategies would provide a better response to bioterrorism, mass vaccination, or vaccination of social contacts, so-called “trace vaccination.” Our results show that the uncertainty in the model parameters is remarkably high and that this uncertainty has important implications for vaccination strategies. For example, under one plausible scenario, the most likely outcome is that mass vaccination would save ≈100,000 more lives than trace vaccination. Because of the high uncertainty in the parameters, however, there is also a substantial probability that mass vaccination would save 200,000 or more lives than trace vaccination. In addition to providing the best response to the most likely outcome, mass vaccination thus has the advantage of preventing outcomes that are only slightly less likely but that are substantially more horrific. Rigorous estimates of uncertainty thus can reveal hidden advantages of public health strategies, suggesting that formal uncertainty estimation should play a key role in planning for epidemics.
Keywords: susceptible–exposed–infected–removed model, trace versus mass vaccination, host–pathogen interaction, Bayesian hieracrchical model
The predictions of epidemic models are widely used in planning for public health responses to both bioterrorism and emerging diseases (1). An important source of uncertainty in such predictions is uncertainty in parameter values. Even simple epidemic models can capture disease dynamics remarkably well (2, 3), however, so most modeling studies have relied on informal methods for quantifying uncertainty in parameter values (3–9). In this article, we formally estimate the uncertainty in the parameters of a model of smallpox bioterrorism, and we show how such uncertainty estimates can reveal hidden risks of public health decisions.
To describe the dynamics of smallpox, we use the well known susceptible-exposed-infected-removed (SEIR) model (2):
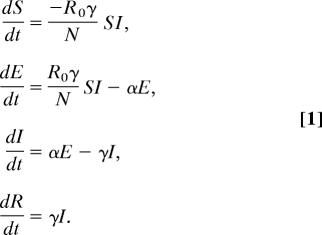 |
R0 is the number of secondary infections produced by a single infected individual, γ is the rate at which infectious individuals I cease to be infectious because of recovery or death, and N is the population size, here assumed to be of a single city. Hosts begin in the uninfected, nonimmune class S and move to the exposed but not yet infectious class E at a rate R0γ . Exposed but not yet infectious individuals move to the infectious class at rate α. To fit the model to mortality data, we also introduce the parameter μ, the fraction of removed individuals that die of the disease.
The SEIR model has several useful features for estimating uncertainty in the predictions of epidemic models. First, because the model is based on assumptions that are approximately true for many diseases (2), it can be used for diseases other than smallpox (7, 9, 10), emphasizing the generality of our approach. Second, although the SEIR model has only four parameters, it provides a good fit to data for historical smallpox epidemics (3). The number of parameters in our model is important because concerns over the complexity of disease spread have caused some researchers to instead construct complex models with tens to hundreds of parameters (4–6). Estimating the values of a large number of parameters, however, requires a large amount of data, making it impractical to formally quantify parameter uncertainty for complex models. Because the SEIR model in contrast includes only four parameters, estimating the overall uncertainty in its parameters is relatively straightforward. Moreover, as we discuss further below, uncertainty in model predictions is likely to be even higher for models with many parameters.
A common method of quantifying the effects of parameter uncertainty on the predictions of epidemic models is sensitivity analysis, in which one or a few parameters are varied, whereas the others are held constant (4, 6). Sensitivity analysis, however, generally underestimates overall parameter uncertainty. We therefore instead use Bayes' Theorem, which allows us to formally take into account uncertainty in all parameters (see supporting information, which is published on the PNAS web site):
 |
Here, σ2 represents the random variation in the data beyond what can be explained by the SEIR model. The uncertainty in the model's parameters then is represented by the spread in the posterior distribution of the parameters given the data, P(R0, α, γ, μ, σ2-data), which depends on the prior uncertainty in the parameters, π (R0), π (α), π (γ), π (μ), and π (σ2), and on the likelihood of the data, L(data-R0, α, γ, μ, σ2).
We used Bayes' Theorem in the following way. First, we constructed priors for the parameters from literature data on smallpox progression (Methods and supporting information). Second, we calculated the likelihood of the parameters from data on 13 past smallpox epidemics (listed in Table 3). Third, we combined the likelihood and the priors to calculate the joint posterior distribution of the parameters, according to Bayes' Theorem, Eq. 2. We thus allowed for uncertainty in all model parameters, and we combined information from all available data. Although alternative approaches also might have allowed us to combine data, such approaches are generally less efficient (see supporting information). Similarly, although previous researchers also have used multiple data sets, in so doing they have assumed that the uncertainty in some (5, 7, 8, 11) or all (3, 9) other parameters is zero. As we will show, this assumption leads to serious underestimates of parameter uncertainty. Also, in estimating a single value of R0 from multiple epidemics, we are effectively assuming that contact networks were the same in different populations. Although this assumption is undoubtedly unrealistic, allowing for population-specific values of R0 very likely would lead to even more uncertainty in the parameters. Because our intent is to demonstrate that uncertainty is high, assuming a common value of R0 thus is conservative.
To show how uncertainty in parameter values can lead to uncertainty in evaluations of public health responses to epidemics, we translated parameter uncertainty into uncertainty in the relative efficiency of two different vaccination strategies. The two strategies are mass vaccination, under which the entire population is vaccinated at the beginning of the epidemic, and trace vaccination, under which vaccinations are given only to those who contact infected individuals. Although mass vaccination is the policy of the U.S. and U.K. governments (12, 13), trace vaccination was used in the final stages of smallpox eradication (12, 14) and, recently, some researchers have argued that it will be as effective as mass vaccination while, of course, being cheaper (4, 5). These two strategies are not the only possibilities, but they allow us to clearly show how uncertainty in parameters is translated into uncertainty in strategy evaluations.
The particular vaccination model that we used was developed by Kaplan et al. (11). For our purposes, this model is convenient because it is essentially the SEIR model with the addition of either mass or trace vaccination (see Supporting Text for details of the Kaplan et al. model). The Kaplan et al. (11) model thus inherits assumptions of the SEIR model, such as exponential sojourn times in each stage and homogeneous mixing of individuals, that are not necessarily realistic. We therefore emphasize that we use this model not because it is necessarily the best model, but because our aim is to illustrate the effects of parameter uncertainty on evaluations of vaccination strategies rather than to identify the best of all possible strategies. We therefore compared the two vaccination strategies in the following way. First, we drew a large number of sets of parameter values from the posterior distribution of the SEIR parameters. Second, we used each set of parameters in simulations of the Kaplan et al. (11) model, first under trace vaccination and second under mass vaccination, to calculate the difference in the number of people dying between the two strategies for each parameter set. Our evaluation of the relative efficiency of the two strategies thus considers both the most likely difference in the number dead and the uncertainty in the difference in the number dead.
Results and Discussion
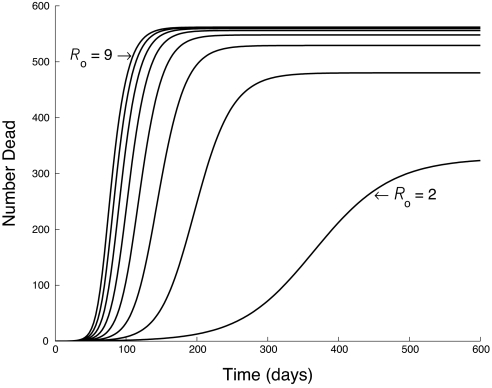
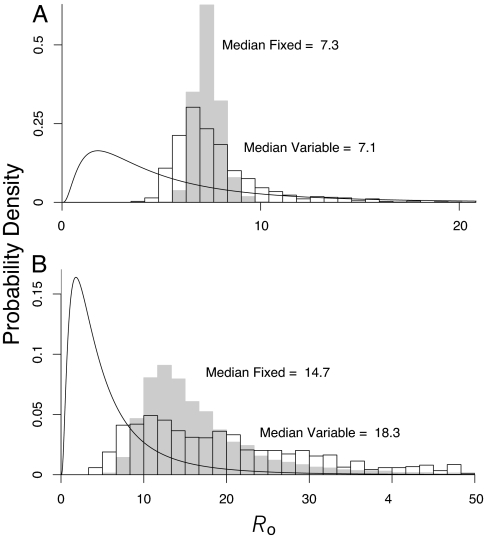
Our results show that the overall uncertainty in the parameters of the SEIR model is remarkably large (Table 1). Part of the reason is that, when fitting the model to the epidemic data, it becomes harder to distinguish among epidemic curves as R0 increases (Fig. 1). The prior uncertainty in the parameters, however, also contributes substantially to the overall uncertainty. To illustrate this effect, in Fig. 2 we show that the marginal distribution of R0 is much wider when we allow for uncertainty in all parameters than it is when we allow for uncertainty only in R0 and the error parameter σ2.
Table 1.
Prior and posterior medians (with 95% central credible intervals, the Bayesian counterpart to the frequentist's confidence interval) of parameters for the SEIR model of smallpox
| Parameter | Prior | Posterior (SEIR model) | Posterior (SEIR with heterogeneity) |
|---|---|---|---|
| R0,e | 4 (0.7, 23.7) | 7.1 (5.0, 15.3) | 6.8 (5.4, 10.4) |
| R0,u | 4 (0.7, 23.7) | 17.5 (5.9, 59.5) | 16.3 (7.2, 36.6) |
| σe | — | 0.021 (0.017, 0.032) | 0.021 (0.017, 0.026) |
| σu | — | 0.146 (0.110, 0.222) | 0.139 (0.110, 0.185) |
| % Fatality, μe | 0.14 (0.03, 0.35)* | 0.12 (0.08, 0.19) | 0.12 (0.09, 0.16) |
| % Fatality, μu | 0.45 (0.08, 0.95)* | 0.37 (0.30, 0.50) | 0.36 (0.30, 0.43) |
| Latency period–up to prodromal | 12.1 (7.9, 17.6) | 10.3 (6.3, 15.9) | 8.8 (5.8, 13.1) |
| Latency period–prodromal | 2.5 (1.3, 4.3) | 2.3 (1.2, 3.9) | 2.1 (1.1, 3.7) |
| Infectious period, 1/γ | 15.8 (10.9, 22.0) | 13.4 (8.8, 19.6) | 11.5 (7.7, 16.1) |
| Old World heterogeneity ke | 2.8 (0.10, 14.8) | — | 358 (198, 976) |
| New World heterogeneity ku | 2.8 (0.10, 14.8) | — | 2,712 (415, 17,579) |
Note that, although the 95% central credible interval on R0 has a smaller range for the heterogeneity model than for the model without heterogeneity, the median value is approximately the same for the two models. The similarity of the medians suggests that the major effect on the marginal distribution of R0 of allowing for heterogeneity in susceptibility is a reduction in the long tail, which is confirmed by an examination of the full distribution (see supporting information). Also, following standard terminology (2), the heterogeneity parameter k is the inverse of the squared coefficient of variation of the distribution of susceptibility. The large values shown here therefore indicate very low levels of heterogeneity. SEIR with heterogeneity refers to a version of the SEIR model that includes heterogeneity in susceptibility (see supporting information). The prodromal period occurs between the onset of fever and the beginning of a rash. The subscript e stands for exposed, Old World populations, whereas the subscript u stands for unexposed, New World populations.
*Intervals based on 500,000 simulated draws from a mixture reflecting the hyperprior structure.
Fig. 1.
Impact of changing R0 on epidemic dynamics in the SEIR model (Eq. 1). All other parameters are fixed. As R0 increases (by ones from one line to the next), the cumulative death curves are increasingly similar.
Fig. 2.
Effects of prior knowledge on uncertainty in the disease transmission rate R0. We distinguish between epidemics in Old World populations and New World populations because epidemics were more severe in New World populations, apparently because of differences in previous exposure and social structure (15). Because it is not clear which group is more similar to contemporary populations, we consider each separately. Shown are the estimated posterior density of R0 for Old World and New World populations, respectively. The curved black line shows the prior distribution. The gray histogram shows the case in which we assume that there is no uncertainty in any SEIR model parameter except R0 (“fixed”), whereas the black-outlined histogram shows the case in which we instead assume that all model parameters are uncertain, and we have integrated out all of the other parameters (“variable”). The gray histogram thus is equivalent to assuming that disease parameters besides R0 have zero uncertainty, showing that such an assumption conceals substantial uncertainty. Note differences in scales on the axes.
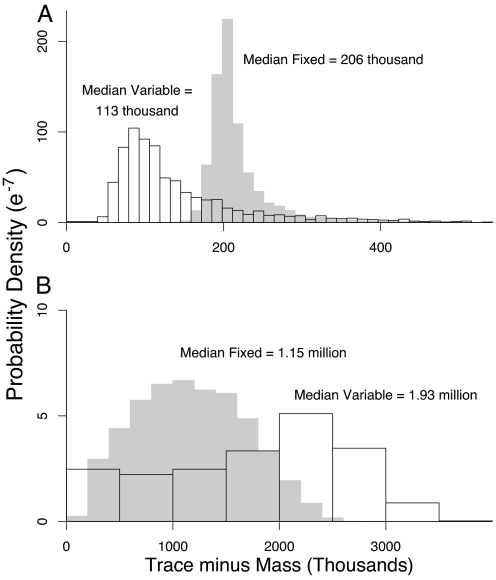
The uncertainty in the parameters has important consequences for uncertainty in the relative effectiveness of the two vaccination strategies. When the likelihood is calculated from Old World epidemics, the most likely outcome is that trace vaccination will result in ≈100,000 more deaths than mass vaccination (Fig. 3A) out of a population of 10 million. Focusing on the most likely outcome, however, conceals substantial probabilities of even larger differences (Fig. 3A); specifically, there is at least a 17% probability that trace vaccination will result in an excess of 200,000 or more deaths over mass vaccination. Similar effects occur when R0 is instead estimated from New World epidemics (Fig. 3B), except that the increase in the number dead under trace vaccination is higher still, and so the consequences of uncertainty are even more severe. As we show in supporting information, this uncertainty is due mostly to uncertainty in the number of dead under trace vaccination, apparently because trace vaccination is especially sensitive to variability in the rate of spread of the disease. The qualitative advantage of mass vaccination holds even when trace vaccination rates are considerably higher (Figs. 9 and 10). The risk of trace vaccination therefore may be much higher than is apparent from a consideration of most likely outcomes alone; moreover, mass vaccination may prevent outcomes that are only slightly less likely than the most likely outcome but that are substantially more horrific.
Fig. 3.
Difference in the number of deaths between trace vaccination and mass vaccination strategies in a simulated population of 10 million. (A) Using parameters based on Old World populations. (B) Using parameters based on New World populations. As in Fig. 2, comparison of the gray- and black-outlined histograms shows the effects of neglecting uncertainty in parameters other than R0 and σ2. Note differences in scales on the axes.
The simplicity of the SEIR model means that its prediction of the most likely outcome may be inaccurate, whereas the corresponding predictions of more complex models may be more accurate (16). Nevertheless, any such advantage of a more complex model may be outweighed by an increase in uncertainty, because the good fit of the SEIR model to smallpox data means that a more complex model would not fit the data much better. To illustrate this point, we extended the SEIR model to allow for heterogeneity in susceptibility (see supporting information), which is widely believed to be important in disease dynamics (2), and repeated our Bayesian calculation. The levels of heterogeneity in susceptibility needed to explain the data are very small (Table 1), suggesting that the additional parameter provides little additional explanatory power and, therefore, that the model without heterogeneity is sufficient to explain the data. Moreover, for the model with heterogeneity, the marginal distribution of R0 is very similar to that for the model without heterogeneity; as Table 1 shows, the main effect is a modest reduction in the tail of the distribution (see supporting information for the full distribution. Note that, for the heterogeneity model, the parameter R0 is actually R̄0, the average value of R0 across host individuals. For convenience, we refer to both parameters simply as R0). As a result, the uncertainty in the effectiveness of the two vaccination strategies very nearly is the same for the two models (supporting information). Indeed, under the heterogeneity model, the chance that the excess in the number of deaths under trace vaccination is at least 200,000 is 15%, which is close to the value of 17% for the model without heterogeneity (see supporting information for the full distribution of outcomes under the heterogeneity model). Increasing realism still further, to encompass the tens to hundreds of parameters of complex models (4–6), might well increase the uncertainty, because any small decrease in uncertainty due to a slight improvement in the fit to data would be outweighed by a large increase in uncertainty due to fitting many additional parameters. When uncertainty estimates are made for other diseases, however, enough data may be available to justify more complex models (7, 8, 10, 17, 18).
A related point is that we have considered only two simple vaccination schemes, yet some authors have argued for more complex responses (4), such as vaccinations that are targeted at particular spatial locations. Such arguments, however, have been based on complex models, for which rigorous uncertainty estimates are unavailable. As we have shown, formally allowing for uncertainty can reveal hidden risks of vaccination strategies, and so we suspect that evaluations that do not include formal estimates of uncertainty may not be robust. Our point thus is not that mass vaccination will necessarily provide the best response, but instead that our evaluation of which strategy is better may change if we carefully quantify the uncertainty in a model's parameter values.
A final important point is that our method is not specific to the SEIR model. Indeed, a Bayesian approach even allows for effects for which little quantitative information is available. For example, in the absence of any relevant data, we have assumed that differences between historical and bioterrorism outbreaks are negligible, but the Bayesian framework could be used to incorporate such differences in the form of expert opinion. Incorporating expert opinion, however, would increase greatly the overall uncertainty; given that we have argued that uncertainty is likely to be high, it is conservative to assume that differences from historical epidemics are negligible. Our framework similarly allows for straightforward updating of parameter estimates with new data in the event of an actual epidemic. Bayesian approaches to estimating uncertainty thus may be of widespread usefulness in planning for epidemics.
Methods
Prior Construction.
Vague priors often are used when little is known regarding parameter values. In our case, however, enough is known regarding the progression of smallpox that it is possible to instead construct informative priors for most parameters. The one exception is that by definition, we have no prior information on σ, because it describes the error between the model and the data, and so for σ, we used a vague prior. Also, we did not explicitly model the correlations between disease parameters. Because we have no prior information regarding such correlations, including them would have required vague priors, which probably would have resulted in even higher uncertainty.
For the remaining parameters, we first chose distributions based on standard statistical considerations. For the disease reproductive rate R0, we used a log-normal distribution, to allow for a long tail, as in Fig. 1. For the infectious period 1/γ, and for the rate of moving from latency to infectiousness α, we used gamma distributions, which gave a good fit to data (19–22). The latent period usually is split into a period between contact and initial fever, and a period between fever and rash [contrary to previous models (5, 11), there is little evidence for infectiousness during the latter period (14, 22)]. We therefore included separate priors for each transition, symbolized as α1 and α2, respectively. Finally, for the fraction dying μ, which by definition is ≤1, we used a beta distribution, commonly used to model fractional quantities. Because μ is particularly uncertain, we placed a hyperprior on the parameters of μ's prior, such that its mean was drawn from a beta distribution, whereas the scale parameter was drawn from a gamma distribution. As a result, the prior density for μ is effectively a mixture of beta densities, and, therefore, it has longer tails than a simple beta denisity.
The parameters of the priors were taken from the smallpox literature. For R0, we used a median of 4, the midpoint of a range based on immunization rates before smallpox was eliminated from general circulation (2). The credible intervals for R0 were chosen to encompass the range of previous estimates (3). The priors on 1/γ, α1, and α2 were constructed by fitting gamma distributions directly to literature data on smallpox-infected individuals (19–22). Because of differences in the epidemiological history of smallpox between continents, we expected differences in smallpox transmission between previously unexposed New World and previously exposed Old World (or Old World descent) populations. We therefore fit the model to epidemics from the two hemispheres separately (Fig. 2), and we assumed distinct values of μ for each. The mean of the prior on μ for Old World populations was estimated from known rates, centered around a rate of 16% and with a 95% credible interval of (3%, 35%) (Table 1). The mean fatality rate for the New World populations was 49%, based on mortality in an epidemic among previously unexposed male slaves in Puerto Rico (23). The prior variance for the New World fatality rate then was adjusted so that 95% of the distribution ranged from 8% to 90%.
Mathematically, the priors can be expressed as
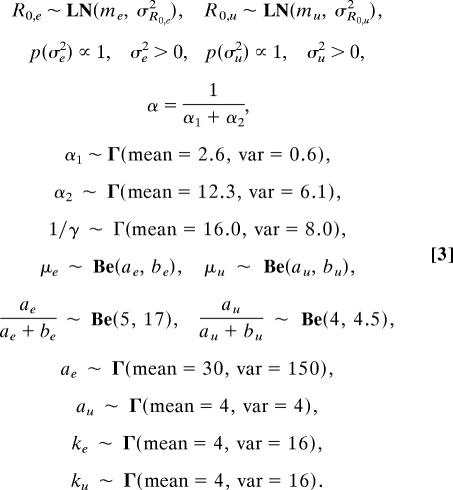 |
Here, the hyperparameters on the fatality rate are ae, be, au, and bu, and Γ, LN, and Be denote gamma, log-normal, and beta distributions, respectively. Note that e stands for previously exposed Old World populations, whereas u stands for previously unexposed New World populations.
Likelihood Calculation.
In fitting the SEIR model, we considered only epidemic data because of the difficulty of fitting the complex fluctuations typical of endemic data (10, 18). Also, we used only 18th and 19th century epidemics (Table 3) to avoid the complication of vaccination. In using epidemic data from previous centuries, we are implicitly assuming that parameters estimated from such data are relevant to contemporary populations. Given that R0 in particular is likely to vary in a complex way across centuries, because, for example, of changes in social mixing or access to information regarding smallpox, it is likely that, in fact, smallpox spread rates would be different in contemporary populations. Nevertheless, as we describe in Results and Discussion, allowing for differences between historical and contemporary populations almost certainly would increase the uncertainty in the parameters, reemphasizing our main point. Moreover, in using historical data, we are following essentially all previous smallpox modeling studies; given that our goal is to suggest a modification to the methodology of such studies, using historical data is appropriate.
The likelihood is then based on
 |
Here, Dataij and Deadij are, respectively, the observed and predicted number of individuals who died in the ith epidemic at time j, and f(R0,I, α, γ) is the model's prediction of the number of individuals recovering and dying. Because of differences between Old World and New World populations, we allowed some parameters to differ between them (15), and so I indicates whether a population is Old World or New World. Note that we assume that the errors in the fit of the model to the epidemic data are normally distributed. Our reasoning for this choice is that the population sizes in the epidemic data were in the hundreds; for such sample sizes, a normal distribution typically provides a good approximation to a binomial distribution. Moreover, the normal distribution is computationally convenient, particularly in the current Bayesian context. More generally, using a binomial distribution would be equivalent to assuming that all of the error in the fit of the model is simply binomial sampling error. A normal distribution in contrast allows the magnitude of the error to be independent of its mean size and, thus, is in this case a conservative choice.
An important feature of our likelihood calculation is that, because of the sparseness of the observations over time, we assumed that any discrepancies between the model and the data were due to independent recording errors. Because modeling the (positive) autocorrelation process probably would have increased overall uncertainty, this is a conservative assumption. We thus assumed that stochasticity in transmission was manifest between epidemics, rather than within epidemics. Previous work (22, 24) in contrast has focused on stochasticity within epidemics, particularly that due to small population sizes. The population sizes in our data set, however, were large enough that such stochasticity was probably weak (Table 3; ref. 25). A related issue is that previous Bayesian smallpox analyses have used the even simpler SIR model and have considered only single epidemics (26, 27) or exponential growth of the infected class (17). By using the SEIR model, and by considering multiple epidemics, our estimates should better reflect overall uncertainty.
The likelihood was evaluated numerically by solving the differential equations with standard methods (see supporting information). Because of the complexity of the likelihood, the posterior distribution can be formulated only up to the proportionality constant and can be evaluated only pointwise. To generate samples from the posterior, we therefore followed standard practice in using a Markov chain Monte Carlo algorithm that replaces each multidimensional random draw with a sequence of single-parameter, or at least lower-dimensional, draws (26). We assessed convergence by using standard Brooks-Gelman and Geweke criteria (28, 29).
Supplementary Material
Acknowledgments
This work was supported by a grant from the Environmental Protection Agency.
Abbreviation
- SEIR
susceptible-exposed-infected-removed
Footnotes
The authors declare no conflict of interest.
This article is a PNAS direct submission.
References
- 1.Ferguson NM, Keeling MJ, Edmunds WJ, Gant R, Grenfell BT, Anderson RM, Leach S. Nature. 2003;425:681–685. doi: 10.1038/nature02007. [DOI] [PMC free article] [PubMed] [Google Scholar]
- 2.Anderson RM, May RM. Infectious Diseases of Humans: Dynamics and Control. Oxford: Oxford Univ Press; 1991. [Google Scholar]
- 3.Gani R, Leach S. Nature. 2001;414:748–751. doi: 10.1038/414748a. [DOI] [PubMed] [Google Scholar]
- 4.Bozzette SA, Boer R, Bhatnagar V, Brower JL, Keeler EB, Morton SC, Stoto MA. N Engl J Med. 2003;348:416–425. doi: 10.1056/NEJMsa025075. [DOI] [PubMed] [Google Scholar]
- 5.Halloran ME, Longini IM, Nizam A, Yang Y. Science. 2002;298:1428–1432. doi: 10.1126/science.1074674. [DOI] [PubMed] [Google Scholar]
- 6.Eubank S, Guclu H, Kumar VSA, Marathe MV, Srinivasan A, Toroczkai Z, Wang N. Nature. 2004;429:180–184. doi: 10.1038/nature02541. [DOI] [PubMed] [Google Scholar]
- 7.Riley S, Fraser C, Donnelly CA, Ghani AC, Abu-Raddad LJ, Hedley AJ, Leung GM, Ho LM, Lam TH, Thach TQ, et al. Science. 2003;300:1961–1966. doi: 10.1126/science.1086478. [DOI] [PubMed] [Google Scholar]
- 8.Keeling MJ, Woolhouse MEJ, May RM, Davies G, Grenfell BT. Nature. 2003;421:136–142. doi: 10.1038/nature01343. [DOI] [PubMed] [Google Scholar]
- 9.Mills CE, Robins JM, Lipsitch M. Nature. 2004;432:904–906. doi: 10.1038/nature03063. [DOI] [PMC free article] [PubMed] [Google Scholar]
- 10.Rohani P, Keeling MJ, Grenfell BT. Am Nat. 2002;159:469–481. doi: 10.1086/339467. [DOI] [PubMed] [Google Scholar]
- 11.Kaplan EH, Craft DL, Wein LM. Proc Natl Acad Sci USA. 2002;99:10935–10940. doi: 10.1073/pnas.162282799. [DOI] [PMC free article] [PubMed] [Google Scholar]
- 12.Centers of Disease Control. Smallpox Response Plan and Guidelines. Atlanta: Centers Dis Control; 2002. Technical Report Draft 3.0. [Google Scholar]
- 13.United Kingdom Department of Health. Guidelines for Smallpox Response and Management in the Post-Eradication Era. London: U.K. Depart Health; 2003. Technical Report Version 2. [Google Scholar]
- 14.Fenner F, Henderson DA, Arita I, Jezek Z, Ladnyi ID. Smallpox and Its Eradication. Geneva: WHO; 1998. [Google Scholar]
- 15.Fenn EA. Pox Americana: The Great Smallpox Epidemic of 1775–82. New York: Hill and Wang; 2001. [PubMed] [Google Scholar]
- 16.Wearing HJ, Rohani P, Keeling MJ. PLoS Med. 2005;2:621–627. doi: 10.1371/journal.pmed.0020174. [DOI] [PMC free article] [PubMed] [Google Scholar]
- 17.Lipsitch M, Cohen T, Cooper B, Robins JM, Ma S, James L, Gopalakrishna G, Chew SK, Tan CC, Samore MH, et al. Science. 2003;300:1966–1970. doi: 10.1126/science.1086616. [DOI] [PMC free article] [PubMed] [Google Scholar]
- 18.Finkenstädt BF, Grenfell BT. J Roy Stat Soc C. 2000;49:187–205. [Google Scholar]
- 19.Litvinjenko S, Arsić B, Borjanović S. Epidemiologic Aspects of Smallpox in Yugoslavia in 1972. Geneva: WHO; 1973. Technical Report SE/73.57. [Google Scholar]
- 20.Gelfand HM, Posch J. Am J Epidemiol. 1971;93:234–237. doi: 10.1093/oxfordjournals.aje.a121251. [DOI] [PubMed] [Google Scholar]
- 21.Mack TM. J Infect Dis. 1972;125:161–169. doi: 10.1093/infdis/125.2.161. [DOI] [PubMed] [Google Scholar]
- 22.Eichner M, Dietz K. Am J Epidemiol. 2003;158:110–117. doi: 10.1093/aje/kwg103. [DOI] [PubMed] [Google Scholar]
- 23.Rigau-Pérez JG. J Hist Med. 1982;37:423–438. doi: 10.1093/jhmas/xxxvii.4.423. [DOI] [PubMed] [Google Scholar]
- 24.O'Neill PD, Becker NG. Biostatistics. 2001;2:99–108. doi: 10.1093/biostatistics/2.1.99. [DOI] [PubMed] [Google Scholar]
- 25.Daley DJ, Gani J. Epidemic Modelling: An Introduction. Cambridge, UK: Cambridge Univ Press; 1999. [Google Scholar]
- 26.O'Neill PD, Roberts GO. J Roy Stat Soc A. 1999;162:121–129. [Google Scholar]
- 27.Fearnhead P, Meligkotsidou L. J Roy Stat Soc B. 2004;66:771–789. [Google Scholar]
- 28.Brooks SP, Gelman A. J Comput Graph Stat. 1998;7:434–455. [Google Scholar]
- 29.Geweke J. In: Bayesian Statistics. Bernardo JM, Dawid AP, Berger JO, Smith AFM, editors. Vol. 4. Oxford: Oxford Univ Press; 1992. pp. 169–193. [Google Scholar]
Associated Data
This section collects any data citations, data availability statements, or supplementary materials included in this article.


