Abstract
Organisms living in or on the sediment layer of water bodies constitute the benthos fauna, which is known to harbour a large number of species of diverse taxonomic groups. The benthos plays a significant role in the nutrient cycle and it is, therefore, of high ecological relevance. Here, we have explored a DNA-taxonomic approach to access the meiobenthic organismic diversity, by focusing on obtaining signature sequences from a part of the large ribosomal subunit rRNA (28S), the D3–D5 region. To obtain a broad representation of taxa, benthos samples were taken from 12 lakes in Germany, representing different ecological conditions. In a first approach, we have extracted whole DNA from these samples, amplified the respective fragment by PCR, cloned the fragments and sequenced individual clones. However, we found a relatively large number of recombinant clones that must be considered PCR artefacts. In a second approach we have, therefore, directly sequenced PCR fragments that were obtained from DNA extracts of randomly picked individual organisms. In total, we have obtained 264 new unique sequences, which can be readily placed into taxon groups, based on phylogenetic comparison with currently available database sequences. The group with the highest taxon abundance were nematodes and protozoa, followed by chironomids. However, we find also that we have by far not exhausted the diversity of organisms in the samples. Still, our data provide a framework within which a meiobenthos DNA signature sequence database can be constructed, that will allow to develop the necessary techniques for studying taxon diversity in the context of ecological analysis. Since many taxa in our analysis are initially only identified via their signature sequences, but not yet their morphology, we propose to call this approach ‘reverse taxonomy’.
Keywords: DNA taxonomy, large subunit D3–D5, fresh water lakes, benthos fauna
1. Introduction
The benthos harbours a community of organisms including micro-organisms, animals and plants. The term meiobenthos fauna relates usually to multicellular animals with a size between 50 and 500 μm (Giere 1993). This includes, for example, nematodes, rotifers, mites, tardigrades, annelides, crustaceans, as well as larval stages of organisms that become larger as adults, such as chironomids. The meiobenthos has so far mainly been studied in the context of the formation of sediments and ecotoxicology in marine environments and freshwater lakes (McIntyre 1969; Traunspurger & Drews 1996, Soltwedel 2000). However, it should also be a particularly interesting subject of food web studies, since it represents a significant part of the biomass in water. However, even for taxonomic experts, the fauna is too complex and varied to get a complete picture of all species on a routine basis. Thus, in spite of its undoubted importance, the ecological analysis of the meiobenthos fauna remains superficial. The principal goal of our study is, therefore, to develop an assay for automatic taxon determination in complex samples to aid ecological research. The use of DNA signature sequences to distinguish taxa (Floyd et al. 2002; Hebert et al. 2003; Tautz et al. 2003; Blaxter 2004) is a potential solution for achieving this goal. For prokaryotic species this is often the only means to identify them, because of the lack of sufficient morphological markers. However, even for organisms where morphological differentiation is possible in principle, it has advantages over traditional approaches, because it can be automated. For example, microarray techniques based on DNA signature sequences allow the parallel determination of thousands of different sequences in a single experiment, making them particularly suitable for the qualitative and quantitative analysis of complex samples.
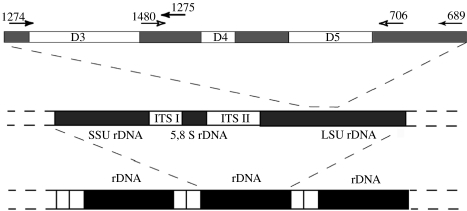
As a target molecule for analysis we have chosen here the nuclear encoded large ribosomal RNA subunit. Ribosomal RNA genes are universally present and have a very conservative organization (figure 1). Small subunit (SSU—often called 18S) and large subunit (LSU—often called 28S) rRNAs are always transcribed together and then processed into individual molecules. The SSU/LSU unit is tandemly repeated and present in dozens to hundreds of copies (Long & David 1980). Ribosomal RNAs are generally a patchwork of conserved and divergent regions. This allows to design universal PCR primers that can amplify fragments which contain divergent and thus possibly species diagnostic regions. The locations of the divergent regions in rRNA are known and have been generally numbered as D1–D12 in the LSU (Hassouna et al. 1984). Such divergence regions occur both in the LSU as well as the SSU, but they tend to be longer in the LSU. Hence, for the purpose of developing signature sequences, the LSU is a more useful molecule than the SSU, although the current data basis for the latter is more comprehensive. However, given that meiobenthos organisms are generally underrepresented in the databases, it should currently not matter too much which gene is chosen for building a signature database.
Figure 1.
Scheme of the universal eukaryotic rRNA gene unit and depiction of the primer locations used in this study. Ribosomal gene clusters (depicted in the middle) are arranged in tandem (depicted at the bottom). The D3–D5 region is depicted at the top. The primers 1274 and 1275 were used to amplify the D3 region, the primers 1274 and 689 were used to amplify the whole D3–D5 region.
To study the general applicability of this approach, we have generated a number of signature sequences for the LSU D3–D5 region obtained from benthos samples of various Bavarian lakes. We find a large diversity of different organisms, indicating that a much more extensive study would be necessary to yield a representative set of organisms present in the meiobenthos. However, our data show also that the approach is feasible and will permit the development of a DNA taxonomy system for the meiobenthos in the future.
2. Material and methods
(a) Sampling and sample purification
Samples were taken from the sediment within three metres of the shoreline of the respective lakes by taking the upper 5 to 10 cm of the sediment layer. About 200 mL sediment slurry were filled in a two litre measuring cylinder and topped with lake water. The mixture was shaken and the rough parts of the sediment were left to settle for 30 s. The supernatant was decanted into a series of graded mesh sieves. All materials larger than 250 μm and smaller than 30 μm were discarded.
For a further removal of anorganic material, we used centrifugation in polysilicate buffer (Burgess 2001). The polysilicate (LudoxTM 50, Dupot de Nemours, Antwerpen) was diluted to 1.14 g cm−3 with water (approximately 30 vol.% Ludox) and adjusted to pH 7.0 with HCl. The sieved material (see above) was mixed in a 1 : 5 ratio with this solution and centrifuged for 5 min at 800g. This leads mainly to sedimentation of the remaining inorganic material, while the organisms remain in the supernatant. The supernatant was then again concentrated on a 20 μm sieve and washed with water.
A further purification step was used for the DNA extraction in the batch approach. This made use of a step gradient of Ludox with a density of 1.4 g cm−3 as the cushion and the organism fraction from the above step (in water) as upper layer. Centrifugation at 800g for 5 min lead to the concentration of the organisms at the interface between the Ludox cushion and the water. From there they were retrieved with a pipette and washed again over a 20 μm sieve with water.
(b) DNA extraction
For the DNA extraction in the batch approach, we used the organism fraction from the step gradient. This was transferred into HOM-buffer (20 mM Tris–HCl, 100 mM EDTA pH 7.5) and homogenized with a glass pestle homogenizer. Sodiumdodecylsulfate was then added to a final concentration of 1% and proteinase K to a final concentration of 500 μg mL−1. Protein digestion was carried out over night at 50 °C. The following steps are based on the protocol given by Porteus et al. (1997), which is designed for soil samples. Per millilitre lysate, 125 μL 5 M potassium acetate and 420 μL 40% polyethylene glycol 8000 (Sigma) were added. The tube was then incubated for 1 h at −20 °C to precipitate the DNA. After centrifugation for 15 min at 13 000g the supernatant was discarded and the pellet was dissolved in CTAB buffer (2% hexadecyltrimethylammonium bromide, 1.4 M NaCl, 100 mM EDTA pH 7.5) and extracted with one volume of chloroform. After centrifugation for 10 min at 13 000g the supernatant was transferred into a new tube and precipitated by adding 1.15 volume of isopropanol (15 min at −20 °C). Centrifugation was as above and the pellet was then dissolved in 2.5 M ammoniumacetate and precipitated again with 2.2 volumes of ethanol (15 min, −20 °C, centrifugation as above). The final precipitate was dissolved in TE (10 mM Tris–HCl, 0.1 mM EDTA pH 7.5) and further purified on a Microcon-100 centrifugation filter (Millipore) washed with TE to remove remaining impurities and degraded DNA fragments. Single organisms were transferred into a buffer containing 10 mM Tris–HCl pH 7.5 and 140 μg mL−1 proteinase K. Larger organisms were squashed with a pipette tip to allow the buffer to penetrate the tissue. Digestion was for 4 h (or over night) at 50 °C. The proteinase K was then denatured for 10 min at 100 °C and the solution was further treated with Genereleaser (Bioventures Inc.) before amplification (Schizas et al. 1997).
(c) PCR amplification and sequencing
The primers used for amplification are depicted in figure 1. The primers were used both for PCR and for sequencing. The sequences of the primers are (always 5′–3′ direction): 1274: GACCCGTCTTGAAACACGGA; 1480: TAGGGGCGAAAGACTCG; 1275: TCGGAAGGAACCAGCTACTA; 706: CGCCAGTTCTGCTTACC; 689: ACACACTCCTTAGCGGA. Two microlitre DNA template was used in different dilutions (up to 1 : 10 000 in water) in 20 μL reaction volumes. PCR cycles were 2 min denaturation at 96 °C, then 20 cycles with 45 s 96 °C, 60 s 48 °C, 60 s 72 °C followed by 20 cycles with 45 s 90 °C, 60 s 48 °C, 60 s 72 °C and final elongation at 72 °C for 10 min. The resulting fragments were either cloned into pZERO vector (Invitrogen), or directly sequenced by cycle sequencing, following the protocols of the supplier of the respective kits. For the clones we used the standard sequencing primers that flank the inserts for sequencing, for the PCR fragments we used primers 1480 and 706. Sequencing reactions were run on an ABI377 sequencer. All resulting sequences were manually inspected and only clear sequence reads were retained. Ambiguous base callings were manually inspected and edited, if necessary, including the information from the opposite strand when this was available (note that only partial information from the opposite strand was available for the PCR fragments from individual organisms, due to the internal localization of the sequencing primers; see figure 1). Our experience with this sequencing strategy suggests that the upper bound of the error is less than one wrongly assigned nucleotide in a given sequence (i.e. < 0.15%).
(d) Computational analysis
To place new sequences among known sequences, we have retrieved approximately 360 LSU sequences from the EBI database and built a local database. All of our sequences were then compared to the sequences in this database using the FASTA algorithm (Pearson & Lipman 1988). New sequences were initially assigned to taxon groups on the basis of the best similarity scores obtained from FASTA, whereby a minimum of 70% similarity was required to assign sequences to a major taxon.
The FASTA algorithm was also used to screen for potential recombinant clones. Clones were considered possible recombinants if the FASTA score of the first half and the second half of the sequence was very different, using a subjective cut-off, based on the further manual inspection of the FASTA alignment. This procedure is, therefore, only a first approximation to identify possible molecular chimaeras.
The further analysis was mainly done with the help of the Arb program (Ludwig et al. 2004), which includes alignment and tree building features. The alignment was optimized taken stem-loop structure criteria into account, as described in Friedrich & Tautz (1997). Additional analyses were done with Phylogenetic analysis using parsimony (PAUP; Swofford 1993).
The Arb neighbour-joining (NJ) tree building feature was used to obtain a phylogenetic tree of all sequences. This tree served then to reassess all initial taxon assignments obtained from the FASTA analysis, which led to some minor corrections. The tree allowed a tentative placement of all sequences that were not already assigned by the FASTA analysis.
3. Results
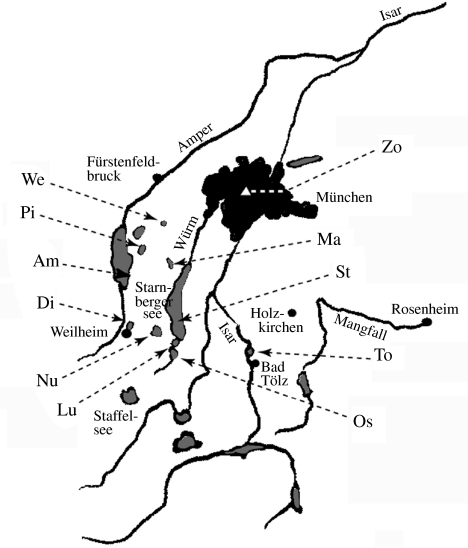
Meiobenthos samples were obtained from 11 different lakes around Munich (figure 2). One further sample was taken from a site near Braunschweig (ca. 600 km north of Munich). Since our main objective was to sample a large diversity of taxa, we have chosen lakes from rather different ecological settings (table 1). The organisms were retrieved from the sediments (see §2) and a size fraction of 30–250 μm was selected via appropriate sieves.
Figure 2.
Location of the Bavarian lakes from which samples were obtained. The acronyms are listed in table 1.
Table 1.
List of lakes sampled with rough description of ecological context.
| acronym | name | description | sediment structure |
|---|---|---|---|
| Am | Ammersee | large mesotrophic lake, with several adjacent towns, broadly used for fishing, water sports and shipping | **** |
| Di | Dietlhofer Weiher | small lake next to a town, bathing lake in summer, occasionally exceeds bacteriological pollution limits | *** |
| Lu | Lussee | small mesotrophic lake under environmental protection, with broad reed girdle | ** |
| Ma | Maisinger See | small mesotrophic lake, bathing lake in summer, low pollution level | *** |
| Nu | Nussberger Weiher | small lake used mainly for pisciculture | **** |
| Os | Ostersee | midsized mesotrophic lake, next to Lussee, but without special protection status, bathing lake in summer | ** |
| Pi | Pilsensee | midsized eutrophic lake, broadly used for water sports, bathing and fishing | ***** |
| St | Starnbergersee | very large mesotrophic lake, with several adjacent towns, broadly used for fishing, water sports and shipping | * |
| Tk | Tonkuhle | artificial lake in a former clay pit near Braunschweig | * |
| To | water reservoire near Bad Tölz | mesotrophic storage lake of the Isar, fluctuating water levels, can fall dry during summer | ** |
| We | Weßlinger See | small polytrophic lake within a town (Weßling), artificially aerated | **** |
| Zo | — | very small artificial pool in the garden of the Zoological Institute in Munich | * |
The column ‘sediment structure’ refers to the coarseness of the sediment ranging from one star (*, very fine sediment) to five stars (*****, coarse gravel). This classification refers of course only to the respective sampling sites.
(a) Sequence signatures
In a first approach to obtain taxon specific signature sequences, we have simply pooled all organisms extracted from the meiobenthos fraction of a given lake sample and prepared DNA from the pool. From this DNA we made two types of amplification, one encompassing the D3 region alone and one encompassing the whole D3–D5 region using the universal primers depicted in figure 1. The resulting fragments were cloned and approximately 900 randomly picked clones were sequenced. All sequences were checked against a database of available LSU sequences (see §2) to assess whether they can be associated with a known sequence or at least placed close to a known taxon. This analysis showed for some fragments similarity with more than one taxon group. This is apparently due to the presence of hybrid sequences that were most likely caused by ‘jumping PCR’ (Meyerhans et al. 1990; Pääbo et al. 1990). We, therefore, tested for all sequences whether they yielded different results when the first versus the second half of the sequence was compared with the database sequences. This showed that approximately one third of the sequences had to be considered as possible hybrid sequences from at least two different organisms. These sequences were removed from the further analysis. This left about 600 useable clones, which were not obviously the product of artificial recombination of two very distinct sequences, although we cannot rule out that some of them might still be due to recombination between two similar sequences. Among the 600 clones, we identified 159 unique sequences (124 for the whole D3–D5 fragment and 35 for the D3 fragment).
Although the effect of jumping PCR and recombination is well known in principle, it was nonetheless surprising that such a high fraction of artificial clones was generated from the batch PCR approach. Since the fraction of hybrid sequences obtained was somewhat different between the lake samples, it seems possible that different mixtures of sequences, or different DNA preparations (e.g. degradation status) are more or less prone to jumping PCR artefacts. Still, from these initial results we have to conclude that the batch approach is not the best method to reliably obtain signature sequences that represent single taxa.
In a second approach we used, therefore, individual animals that were randomly picked under a stereo microscope and DNA was extracted from them individually. The amplified fragments were then directly sequenced without cloning. This approach has three advantages. First, a rough taxon assignment is already possible based on the visual identification under the stereo microscope; second, the generation of hybrid sequences can be excluded; and third, the chance of obtaining wrong sequences caused by PCR induced mutations is highly reduced, because no cloning step is involved. With this approach, we successfully obtained approximately 400 sequences, of which 140 were unique. Thirty-five of these were identical to sequences obtained from the batch approach. The new unique sequences were submitted to GenBank (DQ086498–DQ086776).
(b) Sequence variation
About a third of all unique sequences differed at less than 10 nucleotide positions from the next closest sequence. This raises the question whether they might represent variations within species, rather than different species. Unfortunately, unequivocal species identification is difficult for the taxa that we look at and it is, therefore, not easy to sequence several representatives of the same species to assess within species variance. However, for 12 taxa (five insects, three annelids, two crustaceans and two molluscs) we have been able to sequence between two and four individuals from the same species (assigned by morphological criteria). In all cases we found identical sequences for the respective species, including where the second sample was obtained from a lake from northern Germany. This suggests that the intra-species variance cannot be very high on average, although this issue will need to be further studied in the future.
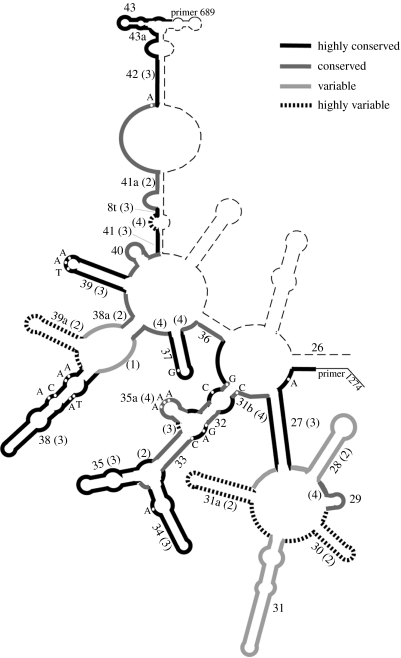
As was to be expected, the different parts of the D3–D5 region show different degrees of sequence divergence. Using the distance measure implemented in Arb, we find that the average similarity between all D3 and D5 sequences in the database is 74%, i.e. the region is relatively well conserved. The pattern of conservation and divergence can be plotted onto the secondary structure predictions of the region (figure 3). The most divergent parts are helices 30 and 31a, with adjacent loops. They show also major length differences between the taxa. Helix 39a is very variable with respect to nucleotide exchanges, but less variable in length. It is, thus, evident that the most variable regions are not necessarily confined to loops, but can also form stem regions. This implies that compensatory changes should often be found in these regions, which is indeed the case. Thus, although these regions show a high divergence, they are clearly not free of selective constraints. This raises the question of whether they are actually sufficiently fast evolving to distinguish closely related species. Again, we have only preliminary data on this question so far. For all identified species from the same genus (including database sequences), we found at least six and usually more than 10 nucleotide differences. However, only 11 such comparisons were possible in our dataset, indicating that this is also an issue for further research.
Figure 3.
Divergence profile of the sequences in our analysis correlated with secondary structure. The divergence measures are based on similarity values provided by the Arb program, the naming of the helices and loops follows Hassouna et al. (1984). The depiction does not include indel differences, which can be substantial.
(c) Taxon assignments
To place our new sequences from meiobenthos organisms within a phylogenetic framework, we have combined them with about 400 sequences from the database. The latter included also bacterial sequences and vertebrate sequences. The sequences were aligned within the Arb program (Ludwig et al. 2004), taking secondary structure constraints into account. The NJ option in Arb was used to build a tree of all sequences. The subtrees of the monophyletic groups that are relevant for the meiobenthos fauna are shown in the Electronic Appendix. Although our mode of tree reconstruction must be considered as only a first approximation, it is nonetheless clear that almost all anonymous sequences were assigned to a known taxon group. Thus, although D3–D5 rDNA sequences are still somewhat underrepresented in the database, it is already possible to place almost any unknown sequence into a phylogenetic framework that allows taxon assignment on a rough scale.
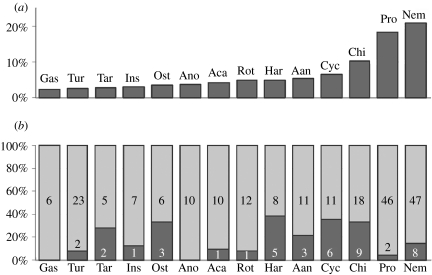
Figure 4a provides an overview of the number of different sequence signatures in the taxon groups that are represented in our samples. Nematodes are most abundant, followed by Protozoa, Chironomids and Cyclopoda. Protozoa would have been expected to be absent from the meiobenthos fraction, because most are too small. However, they were abundantly represented among the batch sequences, suggesting that they are in some way co-extracted with larger organisms.
Figure 4.
(a) The abundance of taxa in general taxonomic classes. The assignment to one of the classes is based on the phylogenetic analysis obtained in Arb (see Electronic Appendix). Gas, Gastrotricha; Tur, Turbellaria; Tar, Tardigrada; Ins, Insecta without chironomids; Ost, Ostracoda; Ano, Anomopoda; Aca, Acari; Rot, Rotifera; Har, Harpacticoida; Cyc, Cyclopoda; Chi, Chironomida; Pro, Protozoa; Nem, Nematoda. (b) Reoccurrence of taxa in different lakes. The dark grey parts refer to the fraction of sequences that were found in more than one lake in each taxon class. The numbers refer to the actual numbers.
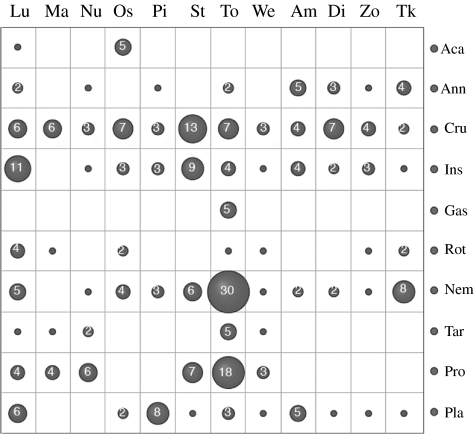
Approximately 18% of signature sequences were found in more than one lake, although this differed for the different taxon classes (figure 4b). Similarly, the number of signature sequences in each taxon class differed between the lakes, giving each of them a more or less unique representation of taxa (figure 5). However, we cannot expect to have fully saturated the possible types of sequences from any of these lakes. Because the sequences are from single collections, and neither the clones nor the single animals have been sampled exhaustively, the picture should be considered only a snapshot at a given time.
Figure 5.
Taxon representation in lakes. The numbers of different sequences in each taxon group are related to the lake in which they were found. It is evident that major differences exist with respect to taxon representation in the different lake samples. Taxon groups as in figure 4a, but Crustaceans (Cru) and insects are in single groups.
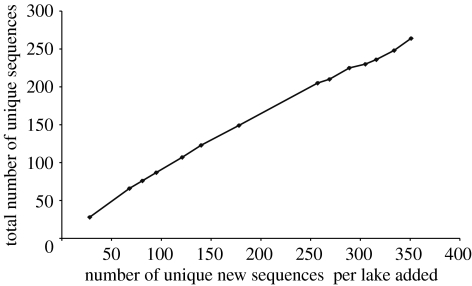
To assess how far away we are from saturation, we have plotted the new unique sequences that were found per lake versus the total number of unique sequences. Such a plot should approach a plateau, once saturation is reached. However, this is clearly not the case in our study (figure 6). We find that there are on average about 75% new unique sequences with each lake sample added.
Figure 6.
Graphical representation of the accumulation of new unique sequences with every lake sample added. The addition of lake samples was in a random order. The graphic shows that there is no sign of saturation of the diversity obtained. On average about 75% of the sequences of each new sample were new sequences.
4. Discussion
Although the meiobenthos fauna plays undoubtedly a significant role in the ecology of water bodies, it remains poorly studied. The main reason for this is that most species of the fauna can only be identified by expert taxonomists, who are specialists for the respective groups. Routine surveys of the whole fauna are, therefore, very difficult, if not impossible. Our approach of using DNA signature sequences may be a solution for this dilemma. The initial results from our study are very promising in this respect. In the following we want to discuss the various aspects of our results that need to be considered, if a broad application to ecological studies is envisaged.
(a) Choice of marker sequence
Our study has focused on a fragment of the LSU ribosomal RNA as a basis of obtaining taxon specific sequence signatures. It was previously known that this fragment can be aligned between very diverse taxon groups and can be used for phylogeny reconstruction (Friedrich & Tautz 1995, 1997). It was less clear whether this would also be useful for distinguishing closely related species. With a 74% overall sequence conservation across the phyla, the chances for this might have seemed low. However, there are a few highly variable parts in the region that apparently provide enough information for distinguishing closely related taxa with good discriminatory power. For those cases, where we have species pairs from the same genus, we always find a sufficient number of nucleotide differences. Although the full discriminatory power of the D3–D5 sequences will only become clear when a sufficiently large number of sequences exists from closely related species, it seems that we deal with a highly suitable signature sequence region, at least for the taxon groups analysed here.
The fact that the region is not free of constraints may also be the reason why we have found no sequence polymorphisms within species, at least in the cases where we could test this. This may even be advantageous, since neutral sequence polymorphisms can be a potential problem because they require to sequence a large number of samples from each species to assess the divergence within the group. Conversely, it is not to be expected that the most closely related species can be easily discriminated on the basis of D3–D5 sequences alone.
Ribosomal RNA genes offer an additional advantage for DNA-taxonomy schemes, because they are pre-amplified in the nucleus and because their products are very abundant in any living cell. This will allow devising detection schemes that do not need to rely on PCR amplification, if one focuses directly on the transcribed RNA.
We conclude that the D3–D5 LSU region may be a very good compromise between conservation and divergence across a large range of taxa. In particular, we should like to emphasize that the primers that we have used appear to be universally applicable for all eukaryotic taxa. However, there are still other regions of the LSU that might be even more suitable, in particular for discriminating very closely related taxa. In a parallel study we are currently exploring the D1–D2 region, which appears to show even greater discriminatory power (Nolte, Sonnenberg and Tautz, unpublished).
(b) Taxon assignment
The fact that we have obtained identical signatures from different lakes suggests that the taxon diversity is not infinite. However, our sampling was certainly not yet exhaustive either. Our sampling strategy was designed to obtain an overview on the total diversity of organisms, i.e. we have intentionally sampled lakes from very different ecological contexts.
In our batch cloning approach we have detected a significant number of sequences that were artificially generated through PCR induced recombination. Such an approach can, therefore, lead to an overestimate of taxon diversity, even if one corrects for obvious recombination artefacts. Another problem with the batch approach is that there can be biases with respect to the ‘amplifyability’ of certain fragments, which results in wrong conclusions with respect to taxon representation. We have observed this for one case, a sequence from a harpacticoid species, which turned out in high numbers among the clones, but never among the individual sequences. Thus, the approach to pick individuals and to directly sequence the PCR fragments from them is clearly the better strategy to obtain reliable sequences and appropriate representations. Unfortunately, this strategy is also much more laborious and less easy to automate. Thus, batch approaches may still be warranted, as long as the shortcomings are fully considered.
Most taxa appear to harbour only one ribosomal sequence cluster. The sequence variants in this cluster are subject to concerted evolution (Elder & Turner 1995), i.e. intra-cluster divergence is rather low. On the other hand, some organisms appear to harbour two clusters with rather different sequences. This has for example been described for Plathelmintes (Carranza et al. 1996) and we have also found this when we sequenced several individuals of Dugesia polychroa from the Ammersee. Two sequence types were found which differed at 27 positions, which is as much as one can find for differences at the family level. It remains unclear how such very separate clusters evolve and what their function might be. There might be stage specific differences in expression but this has still to be further explored. Although such separate clusters can complicate the analysis it should be noted that both sequence variants are nonetheless specific for the respective species.
(c) Reverse taxonomy
Although the majority of the sequence classes determined in a pure sequencing approach originate from anonymous taxa, this information will nonetheless be extremely useful (see also Blaxter 2004, Blaxter et al. 2005). The reason is that even the anonymous sequences can be assigned to taxon groups that represent different trophic levels and will thus allow studying foodweb structure. For those sequence types that appear to play a particularly important role, it will then be warranted to actually identify and properly describe the species that harbours it. Such an approach may be called ‘reverse taxonomy’ akin to ‘reverse genetics’ where one identifies the sequence of a new gene first and its function later. Given that sequence determination and re-identification has become so highly efficient nowadays, we expect that ‘reverse taxonomy’ will become a fruitful approach towards all those cases where taxon diversity cannot be handled with traditional approaches.
(d) Outlook
Once a comprehensive database for meiobenthos organisms exists, one would have to develop further techniques to make it useful for ecological studies. The challenge is to devise a tool that allows to re-identify the sequence classes in temporal and spatial samples and to correlate this with ecological parameters. Technically this would best be achieved via a microarray approach. Here, one selects short oligo-nucleotides that represent the different sequence classes (Pozhitkov & Tautz 2002) and fixes them onto the surface of a microarray. These can then be directly hybridized with the RNA extracted from a sediment sample, providing a qualitative and quantitative measure of the sequence classes present. It should be emphasized that the amount of ribosomal RNA that can be extracted from a multicellular organism is enough for a direct determination without PCR amplification. We estimate that the sensitivity of microarray techniques is sufficient to identify e.g. single nematodes in a given sample (Markmann 2000). Furthermore, it will be technically possible to develop hybridization schemes that can be performed with low cost chemicals and equipment. Thus, a broad scale application of this technique for ecological research is within short reach.
Acknowledgments
We thank Walter Traunspurger for discussion and his support in sampling and extraction of the meiobenthos fauna. Gerhard Mayr and Sabine Giessler have provided rotifers and daphnid cultures, Florian Bernhard has helped with sampling, sample processing and sequencing, Wolfgang Ludwig and Konny Rassmann with setting up the Arb program and Arne Nolte has provided comments on the manuscript. This work was done at the Zoological Institute in Munich and partially funded through the DFG.
One contribution of 18 to a Theme Issue ‘DNA barcoding of life’.
New address: Genedata GmbH, Lena-Christ-Strasse 50, 82152 Martinsried, Germany.
Supplementary Material
References
- Blaxter M.L. The promise of a DNA taxonomy. Phil. Trans. R. Soc. B. 2004;359:669–679. doi: 10.1098/rstb.2003.1447. 10.1098/rstb.2003.1447 [DOI] [PMC free article] [PubMed] [Google Scholar]
- Blaxter M, Mann J, Chapman T, Thomas F, Whitton C, Floyd R, Abebe E. Defining operational taxonomic units using DNA barcode data. Phil. Trans. R. Soc. B. 2005;360:1935–1943. doi: 10.1098/rstb.2005.1725. 10.1098/rstb.2005.1725 [DOI] [PMC free article] [PubMed] [Google Scholar]
- Burgess R. An improved protocol for separating meiofauna from sediments using colloidal silica sols. Mar. Ecol. Prog. Ser. 2001;214:161–165. [Google Scholar]
- Carranza S, Giribet G, Ribera C, Baguna Riutort M. Evidence that two types of 18S rDNA coexist in the genome of Dugesia (Schmidtea) mediterranea (Platyhelminthes, Turbellaria, Tricladida) Mol. Biol. Evol. 1996;13:824–832. doi: 10.1093/oxfordjournals.molbev.a025643. [DOI] [PubMed] [Google Scholar]
- Elder J.F, Jr, Turner B.J. Concerted evolution of repetitive DNA sequences in eukaryotes. Q. Rev. Biol. 1995;70:297–320. doi: 10.1086/419073. 10.1086/419073 [DOI] [PubMed] [Google Scholar]
- Floyd R, Abebe E, Papert A, Blaxter M. Molecular barcodes for soil nematode identification. Mol. Ecol. 2002;11:839–850. doi: 10.1046/j.1365-294x.2002.01485.x. 10.1046/j.1365-294X.2002.01485.x [DOI] [PubMed] [Google Scholar]
- Friedrich M, Tautz D. Ribosomal DNA phylogeny of the major extant arthropod classes and the evolution of myriapods. Nature. 1995;376:165–167. doi: 10.1038/376165a0. 10.1038/376165a0 [DOI] [PubMed] [Google Scholar]
- Friedrich M, Tautz D. An episodic change of rDNA nucleotide substitution rate has occurred during the emergence of the insect order Diptera. Mol. Biol. Evol. 1997;14:644–653. doi: 10.1093/oxfordjournals.molbev.a025804. [DOI] [PubMed] [Google Scholar]
- Giere O. Springer; Berlin: 1993. Meiobenthology: the microscopic fauna in aquatic sediments. [Google Scholar]
- Hassouna N, Michot B, Bachellerie J.P. The complete nucleotide sequence of mouse 28S rRNA gene. Implications for the process of size increase of the large subunit rRNA in higher eukaryotes. Nucleic Acids Res. 1984;12:3563–3583. doi: 10.1093/nar/12.8.3563. [DOI] [PMC free article] [PubMed] [Google Scholar]
- Hebert P.D, Cywinska A, Ball S.L, deWaard J.R. Biological identifications through DNA barcodes. Proc. R. Soc. B. 2003;270:313–321. doi: 10.1098/rspb.2002.2218. 10.1098/rspb.2002.2218 [DOI] [PMC free article] [PubMed] [Google Scholar]
- Long E.O, David I.B. Repeated genes in eukaryotes. Annu. Rev. Biochem. 1980;49:727–764. doi: 10.1146/annurev.bi.49.070180.003455. 10.1146/annurev.bi.49.070180.003455 [DOI] [PubMed] [Google Scholar]
- Ludwig W, et al. Arb: a software environment for sequence data. Nucleic Acids Res. 2004;32:1363–1371. doi: 10.1093/nar/gkh293. 10.1093/nar/gkh293 [DOI] [PMC free article] [PubMed] [Google Scholar]
- McIntyre A.D. Ecology of marine meiobenthos. Biol. Rev. 1969;44:245–290. [Google Scholar]
- Markmann, M. 2000 Entwicklung und Anwendung einer 28S rDNA-Sequenzdatenbank zur Aufschlüsselung der Artenvielfalt limnischer Meiobenthosfauna im Hinblick auf den Einsatz moderner Chiptechnologie. Thesis, University of Munich.
- Meyerhans A, Vartanian J.P, Wain-Hobson S. DNA recombination during PCR. Nucleic Acids Res. 1990;18:1687–1691. doi: 10.1093/nar/18.7.1687. [DOI] [PMC free article] [PubMed] [Google Scholar]
- Pääbo S, Irwin D.M, Wilson A.C. DNA damage promotes jumping between templates during enzymatic amplification. J. Biol. Chem. 1990;265:4718–4721. [PubMed] [Google Scholar]
- Pearson W.R, Lipman D.J. Improved tools for biological sequence comparison. Proc. Natl Acad. Sci. USA. 1988;85:2444–2448. doi: 10.1073/pnas.85.8.2444. [DOI] [PMC free article] [PubMed] [Google Scholar]
- Porteus L.A, Seidler R.J, Watrud L.S. An improved method for purifying DNA from soil for polymerase chain reaction amplification and molecular ecology applications. Mol. Ecol. 1997;6:787–791. 10.1046/j.1365-294X.1997.00241.x [Google Scholar]
- Pozhitkov A.E, Tautz D. An algorithm and program for finding sequence specific oligonucleotide probes for species identification. BMC Bioinform. 2002;3:9. doi: 10.1186/1471-2105-3-9. 10.1186/1471-2105-3-9 [DOI] [PMC free article] [PubMed] [Google Scholar]
- Schizas N.V, Street G.T, Coull B.C, Chandler G.T, Quattro J.M. An efficient DNA extraction method for small metazoans. Mol. Mar. Biol. Biotechnol. 1997;6:381–383. [PubMed] [Google Scholar]
- Soltwedel T. Metazoan meiobenthos along continental margins: a review. Prog. Oceanogr. 2000;46:59–84. 10.1016/S0079-6611(00)00030-6 [Google Scholar]
- Swofford D.L. Illinois Natural History Survey Champaign; Illinois: 1993. PAUP: phylogenetic analysis using parsimony. [Google Scholar]
- Tautz D, Arctander P, Minelli A, Thomas R.H, Vogler A.P. A plea for DNA taxonomy. Trends Ecol. Evol. 2003;18:70–74. 10.1016/S0169-5347(02)00041-1 [Google Scholar]
- Traunspurger W, Drews C. Toxicity analysis of freshwater and marine sediments with meio- and macrobenthic organisms: a review. Hydrobiologia. 1996;328:215–261. 10.1007/BF00017632 [Google Scholar]
Associated Data
This section collects any data citations, data availability statements, or supplementary materials included in this article.


