

Abstract
We used a kinematic analysis to investigate the growth processes responsible for variation in primary root growth between 18 ecotypes of Arabidopsis. Root elongation rate differed 4-fold between the slowest (Landsberg erecta, 71 μm h−1) and fastest growing line (Wassilewskija [Ws]; 338 μm h−1). This difference was contributed almost equally by variations in mature cortical cell length (84 μm [Landsberg erecta] to 237 μm [Ws]) and rate of cell production (0.63 cell h−1 [NW108] to 1.83 cell h−1 [Ws]). Cell production, in turn, was determined by variation in cell cycle duration (19 h [Tsu] to 48 h [NW108]) and, to a lesser extent, by differences in the number of dividing cells (32 [Weiningen] to 61 [Ws]). We found no correlation between mature cell size and endoreduplication, refuting the hypothesis that the two are linked. However, there was a strong correlation between cell production rates and the activity of the cyclin-dependent kinase (CDKA). The level of the protein could explain 32% of the variation in CDKA. Therefore, it is likely that regulators of CDKA, such as cyclins and inhibitors, are also involved. These data provide a functional link between cell cycle regulation and whole-plant growth rate as affected by genetic differences.
The rate at which plants grow is an important agronomic trait in cultivated plants, as well as an adaptive trait under natural growth conditions. Therefore, the physiological characteristics associated with fast and slow growth have been extensively investigated (for an overview, see Lambers et al., 1998). They involve the acquisition of growth-supporting substances (photosynthesis and nutrient uptake) and their utilization (anatomy, chemical composition, cell division, and cell expansion). In contrast to the multitude of physiological investigations into the basis of growth rate differences, genetic studies are scarce.
Arabidopsis, the model plant for genetic research, has been collected from a wide range of habitats distributed primarily over most of the northern hemisphere. Genetic differences between local populations (commonly called ecotypes, despite that this term does not conform strictly to its ecological definition [Pigliucci, 1998]) are presumably associated with adaptation to the prevailing environmental conditions. Numerous ecotypes were collected by the pioneers of Arabidopsis research and have since been use to investigate a wide range of physiological processes, through comparisons between ecotypes and by genetic mapping using recombinant inbred lines (Alonso-Blanco and Koornneef, 2000). With some notable exceptions (Li et al., 1998), little is published about differences in the rate at which Arabidopsis ecotypes grow when compared under standardized laboratory conditions.
There are two complementary views on how root growth is regulated (Silk, 1984). The spatial model describes at what rate division and expansion occur as a function of position along the root axis. Root elongation rate in this model is determined by the size of the growth zone and local rates of expansion. According to this view, cell division merely subdivides cellular space provided by the expansion process. In an alternate manner, a cellular model can be adopted whereby cell production in the meristem drives growth by producing the cells that will subsequently expand to reach a given mature size (Fiorani et al., 2000). Data obtained from analyses of ontogenetic acceleration of root elongation rate (Beemster and Baskin, 1998), inhibition of root elongation in response to the stp1 mutation, and to externally applied hormones (Beemster and Baskin, 2000) are easiest explained in terms of a cellular model, implying a crucial role for cell division in determining organ growth rates. Contradictory to this proposition are observations from γ-radiated seedlings and transgenic lines overexpressing cell cycle genes that show that cell division and organ growth can be partly uncoupled (Haber, 1962; Hemerly et al., 1995; De Veylder et al., 2001a). However, evidence from transgenic plants overexpressing other cell cycle genes conclusively shows that modulated cell division directly affects organ growth rates (Doerner et al., 1996; Cockcroft et al., 2000; De Veylder et al., 2001b). Based on detailed analyses of such transgenic lines, as well as wild-type plants responding to environmental stimuli, we are now starting to unravel the mechanism by which cell division activity in higher plants organs is controlled and how this is related to growth.
To study the regulation of plant growth rate in Arabidopsis, we adapted the existing kinematic framework for quantifying cell division and expansion in the growth zone of the primary root tip (Beemster and Baskin, 1998). Root tips and intercalary meristems of monocotyledonous leaves grow essentially linearly, and growth occurs in a well-defined region. Therefore, they are ideal model systems for investigating the relationship between cell division and growth rate. The growth of these organs can be analyzed in terms of a single representative cell file. In such a file, cell production resulting from co-occurring division and expansion is restricted to the apical region bordering the quiescent center (root tips; Fig. 1) and the basal region bordering the junction with the stem (monocotyledonous leaves). In these meristems, the production of new cells causes a flux of cells that increases with distance from the quiescent center and leaf base (Beemster and Baskin, 1998). At the end of the meristem, cells stop dividing, but continue to elongate, often at higher rates than in the meristem (Beemster and Baskin, 1998). Cells will reach the end of the growth zone, where cell expansion also stops and they have reached their final size. In such a linear system, adopting the cellular view, the steady-state rate at which an organ grows (E) is determined by the final length cells reach when exiting the growth zone (lmat; primarily determined in the elongation zone) and the number of cells produced in the meristem per unit of time (P) according to:
 |
Eq. 1 |
The cell production rate (P), in turn, is a function of the number of cells in the meristem (Ndiv) and their average cell cycle duration (Tc):
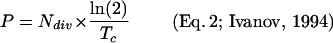 |
Thus, we can decompose root elongation rate in three functional parameters, lmat, Ndiv, and Tc. What could be the mechanisms that regulate these parameters? Mature cell size has frequently been correlated with nDNA content in Arabidopsis (Melaragno et al., 1993; Kondorosi et al., 2000) and other plants as well as in animal species (Cavalier-Smith, 1978). The DNA content of individual cells can be increased above the basic 2C (G1) and 4C (G2) levels by the process of endoreduplication, a modified cell cycle where cells go through S-phase but then bypass mitosis to go directly into G1. We hypothesize that cell cycle regulation controls the degree of endoreduplication, which, in turn, determines mature cell size. As mature cell size partly determines organ growth rate (Eq. 1), this would be a first link between cell cycle regulation at the molecular level and root elongation rates. A second link was recently demonstrated in corn (Zea mays) leaves that respond to changes in water deficit and temperature. The growth of such leaves was closely correlated with cell division activity. It is interesting that local rates of cell division were linearly related to the activity of the cyclin-dependent kinase (CDKA) (Granier et al., 2000). This leads to the model where CDKA controls cell production rates and, thereby, the second component that determines growth rate. The aim of this article is to explore these putative roles of cell cycle regulation in mediating genetically determined growth rate differences. We report that variation in mature cortical cell length, average cell cycle duration, and number of dividing cells all contribute to differences in the elongation rate of the primary root between 18 ecotypes of the model plant Arabidopsis. Moreover, we demonstrate the absence of a correlation between endoreduplication and mature cell length, while confirming the relationship between CDKA and cell production.
Figure 1.

Localization of cell division and expansion in the cortical cell file of primary root tip of Arabidopsis. Cortical cell files originate from initials directly adjacent to the quiescent center (QC). Basal to these initials is the meristematic region where new cells are produced by ongoing cell division and cell expansion, resulting in a flux of cells away from the root tip (arrows). When cells leave the meristem, they enter the elongation zone. Here, they no longer divide, but continue to elongate, resulting in a rapid increase in length as a function of position. Basal to the elongation zone, cells are of constant size and considered mature. The size of the growth zone (meristem + elongation zone) typically ranges between 1 and 2.5 mm in Arabidopsis roots grown on agar media (Beemster and Baskin, 1998, 2000; De Veylder et al., 2001b).
RESULTS
Variation in Root Elongation Rate
For our analysis we selected 18 ecotypes of Arabidopsis, comprising the most commonly used laboratory strains and some that originated from contrasting growth habitats (Table I). Under our growth conditions (see “Materials and Methods”), we readily observed large differences in whole-plant growth rates between these lines (data not shown). These differences were reflected by the rate of growth of their primary root as determined by measurements of the daily length increments (Table II). In contrast to the situation on Hoagland medium (Beemster and Baskin, 1998), the primary root of most ecotypes grew at a constant rate on 1× Murashige and Skoog. On this medium, only three lines, which consequently grew fastest on d 9, were found to increase their elongation rate over time (Ws, Est, and Tsu; data not shown). On this day, there was over 4-fold variation between the growth rate of the slowest growing (Ler, 71 μm h−1) and the fastest growing ecotype (Ws, 338 μm h−1; Table II). Although part of the difference was associated with the ability of the fastest lines to accelerate, there was also a nearly 3-fold difference in growth rate between steady-state growing ecotypes (71 μm h−1 [Ler] to 201 μm h−1 [Wt]; Table II).
Table I.
Overview of the ecotypes investigated
| No. | Abbreviation | NASC Ecotype | Origina |
|---|---|---|---|
| 1 | Ler-0 | NW20 | Gorsow-Wilekoploski, Poland. Selected from x-ray mutagenised population |
| 2 | Cvi-0 | N902 | Cape Verdi Islands |
| 3 | C24 | N906 | Laboratory strain of unknown origin |
| 4 | Estonia (Est) | N911 | Estonia |
| 5 | RLD1 | N913 | Rschew/Starize, Russia. Distinct from Rsch-0 |
| 6 | S96 | N914 | Homozygous line derived from a cross Di (Dijon, France) × Li-2 (Limburg, Germany) |
| 7 | Dijon-M (Djn) | N919 | Dijon, France |
| 8 | An-1 | N945 | Antwerpen, Belgium |
| 9 | Be-0 | N965 | Bensheim, Germany |
| 10 | Col-0 | N1093 | Landsberg/Warthe, Poland (Selected from original Landsberg population) |
| 11 | Lz-0 | N1355 | Lezoux, Puy-de-Dome, France |
| 12 | Nd-0 | N1391 | Niedrezenz, Germany |
| 13 | Nw108 | unknown | Laboratory strain of unknown origin |
| 14 | Ty-0 | N1573 | Taynuilt, United Kingdom |
| 15 | Wt-4 | N1610 | Wietze, Germany |
| 16 | Tsu-1 | N1640 | Tsu, Japan |
| 17 | Wei-0 | N3110 | Weiningen, Switzerland |
| 18 | Ws-4 | N5390 | Vasljevichi/Wassilewskija, Belarus |
According to NASC listing (http://nasc.nott.ac.uk/).
Table II.
Kinematic analysis of root growth rate differences between 18 Arabidopsis ecotypes
| Ecotype | E | lmat | P | Tc | Ndiv |
|---|---|---|---|---|---|
| μm h−1 | μm | cells h−1 | h | ||
| Ler | 71 ± 10 | 84 ± 6 | 0.86 ± 0.05 | 36 ± 4 | 44 ± 3 |
| Cvi | 92 ± 14 | 87 ± 1 | 1.05 ± 0.01 | 25 ± 1 | 39 ± 1 |
| C24 | 99 ± 8 | 94 ± 2 | 1.06 ± 0.02 | 25 ± 1 | 38 ± 1 |
| RLD | 112 ± 9 | 170 ± 5 | 0.66 ± 0.02 | 36 ± 2 | 34 ± 1 |
| NW | 118 ± 15 | 186 ± 3 | 0.63 ± 0.01 | 48 ± 0 | 44 ± 1 |
| S96 | 135 ± 16 | 167 ± 7 | 0.83 ± 0.04 | 35 ± 1 | 42 ± 1 |
| Djn | 138 ± 5 | 121 ± 5 | 1.15 ± 0.04 | 27 ± 3 | 45 ± 3 |
| Wei | 139 ± 6 | 169 ± 3 | 0.83 ± 0.02 | 27 ± 2 | 32 ± 2 |
| Nd | 155 ± 12 | 189 ± 3 | 0.83 ± 0.01 | 38 ± 1 | 46 ± 1 |
| Be | 160 ± 8 | 140 ± 6 | 1.15 ± 0.05 | 30 ± 5 | 49 ± 6 |
| An | 161 ± 8 | 180 ± 9 | 0.90 ± 0.04 | 33 ± 2 | 43 ± 4 |
| Lz | 176 ± 8 | 184 ± 11 | 0.97 ± 0.05 | 36 ± 5 | 49 ± 3 |
| Col | 182 ± 11 | 171 ± 12 | 1.09 ± 0.09 | 29 ± 3 | 43 ± 2 |
| Ty | 184 ± 8 | 172 ± 2 | 1.07 ± 0.01 | 30 ± 2 | 46 ± 3 |
| Wt | 201 ± 14 | 189 ± 8 | 1.07 ± 0.04 | 33 ± 3 | 50 ± 3 |
| Tsu | 207 ± 20 | 145 ± 6 | 1.55 ± 0.06 | 19 ± 1 | 42 ± 0 |
| Est | 281 ± 8 | 203 ± 15 | 1.45 ± 0.08 | 26 ± 4 | 55 ± 3 |
| Ws | 338 ± 18 | 237 ± 13 | 1.83 ± 0.09 | 24 ± 2 | 61 ± 1 |
Average root elongation rate (E) ± se (n = 8 plates, each with 8–10 seedlings). Mature cortical cell length (lmat), cell production rate (P), average cell cycle duration (Tc), and the no. of dividing cells per cortical cell file (Ndiv) ± se (n = 5 representative roots).
Relationships between Root Elongation Rate, Cell Production, and Mature Cell Length
To investigate the relationship between cell cycle regulation and plant growth rates, we first determined the respective contributions of mature cell size and cell production, focusing on the cortical cell files. Under steady-state growth, root elongation rate is the product of cell production and mature cell size (see Eq. 1). Under conditions where the root accelerates, a small fraction of the cell production is “invested” in the expansion of the meristem (Beemster and Baskin, 1998). As mentioned, this was the case for the three fastest growing ecotypes, Ws, Est, and Tsu. To correct for this phenomenon, we calculated the rate of change of the number of cells in the region that represents the meristem on d 9. This factor was calculated from the cell length data from d 7 and 11 and was included in the total cell production (for a detailed description of this procedure, see Beemster and Baskin, 2000). From the thus obtained cell production rate and the number of dividing cells, the cell cycle duration, Tc, was calculated (Eq. 2).
To investigate the correlation between growth parameters, the data were log transformed and used for multiple linear regression analysis (see “Materials and Methods”). The data showed that the regression model containing cell production rate and mature cell length accounted for 99% of the variance in root elongation rate (Fig. 2A; R2 value in Table III). Both parameters contributed, given that both partial regression coefficients were significantly different from 0 (C1 and C2 in Table III). The data for the three non-steady (and fastest) growing ecotypes slightly deviated from the linear relationship (Fig. 2A). This is due to the extra cells produced for the expansion of the meristem, and causes the R2 to be 0.99 instead of 1.00. When analyzed separately, the model with cell production (ranging from 0.63 [Nw] to 1.83 cells h−1 [Ws]; Table II) accounted for 47% of the variance in root elongation rate, whereas the model with mature cortical cell length (ranging from 84 [Ler] to 237 μm [Ws-3]; Table II) could explain 62% of variation in growth rate (R2 in Table III). For both explanatory variables, the correlation with root elongation rate was highly significant (Fig. 2, B and C; P values in Table III). Hence, variation in mature cell size accounted for a little over one-half and, consequently, cell production for a little less than one-half of the variation in root elongation rate. There was no significant correlation between cell production and mature cell size, implying that cell growth in the elongation zone is independent from cell production in the meristem.
Figure 2.

Variation in root elongation rate between 18 Arabidopsis ecotypes is correlated with cell production and mature cortical cell length. A, The complete model describing the correlation between root elongation rate (E), cell production rate (P), and mature cell length (lmat; Eq. 3). B, Partial model of the relationship between root elongation rate (E) and cell production (P). C, Partial model of the relationship between root elongation rate (E) and mature cortical cell length (lmat). Details of the regression parameters are listed in Table III.
Table III.
Multiple linear regression analysis of the relationship between root elongation rate (E) and cell production (P) and mature cell length (lmat)
| Model | R2 | C0a | C1a | C2a |
|---|---|---|---|---|
| Log (E) = C0+ C1 log (P) + C2 log (lmat) | 0.99 | 0.12N.S. | 0.85** | 0.94** |
| Log (E) = C0+ C1 log (P) | 0.47 | 2.18** | 1.0** | – |
| Log (E) = C0+ C2 log (lmat) | 0.62 | 0.0N.S. | – | 1.0** |
Significance:
0.01 < P < 0.05;
0.001 < P < 0.01;
P < 0.001; not significant (n.s.).
Relationship between Cell Production, Number of Dividing Cells, and Cell Cycle Duration
The number of dividing cells in each file and average cell cycle duration determine cell production (Eq. 2). After linearizing this relationship by log transformation (Eq. 4), it was possible to further analyze the role of these two cell division parameters in cell production by means of multiple linear regression analysis. Given that the number of dividing cells and the average cell cycle duration are the only two parameters that determine overall cell production, the regression model including them both accounted for all variation in cell production (Fig. 3A; R2 of 1.00 in Table IV). The model with the number of dividing cells (Ndiv, ranging from 32 [Wei] to 61 [Ws]; Table II) individually accounted for 37% of the variance in cell production (Table IV). The model with average cell cycle duration (Tc, ranging from 18.6 h [Tsu] to 47.7 h [Nw]; Table II) explained 66% of the variation in cell production (Table IV). The correlation was highly significant for both models (Fig. 3, B and C; P values in Table IV), implying that both parameters play a role in determining differences in cell production and, thus, in root elongation rates. There was no correlation between average cell cycle duration and the number of dividing cells, implying that these two cell production parameters are independently regulated (data not shown).
Figure 3.

Variation in the rate of cell production in the primary root meristem of 18 Arabidopsis ecotypes is correlated with the number of dividing cells and their average cell cycle duration. A, The complete model describing the correlation between cell production (P) in the meristem, the number of dividing cells (Ndiv), and mature cell length (lmat; Eq. 4). B, Partial model of the relationship between cell production rate (P) and number of dividing cells (Ndiv). C, Partial model of the relationship cell production rate (P) and mature cell length (lmat). Details of the regression parameters are listed in Table IV.
Table IV.
Multiple linear regression analysis of the relationship between cell production rate (P) and number of dividing cells (Ndiv) and average cell cycle (Tc)
| Model | R2 | C0a | C1a | C2a |
|---|---|---|---|---|
| Log (P) = C0+ C1 log (Ndiv) + C2 log (Tc) | 1.00 | −0.19** | 1.02** | −0.99** |
| Log (P) = C0+ C1 log (Ndiv) | 0.37 | −1.8** | 1.1** | – |
| Log (P) = C0+ C2 log (Tc) | 0.66 | 1.5** | – | −1.0** |
Significance:
0.01 < P < 0.05;
0.001 < P < 0.01;
P < 0.001; not significant (N.S.).
Relationship between Mature Cell Size and DNA Content
To test if the observed variation in mature cortical cell size was correlated with nDNA content, we performed flow cytometry on the roots of all ecotypes. For this analysis, nuclei were isolated from whole root systems, which predominantly consist of mature tissue. Flow diagrams typically contain peaks corresponding to 2C, 4C, 8C, and, in some cases, 16C DNA content, whereby 2C DNA content corresponds to cells in G1. The 4C population encompasses “normal” cells in G2 and cells that have gone through a single round of endoreduplication and are in G1. Therefore, only the 8C and 16C populations contain cells that must have all undergone endoreduplication. The fraction of cells in these two populations varied from only 1% [Nd] to nearly 40% [Nw]; Fig. 4), indicating a considerable variation in the degree of endoreduplication. However, in contrast to the hypothesis, we did not find a correlation between nDNA content and mature cortical cell length (Fig. 4A), indicating that these parameters were independent.
Figure 4.

The absence of a relationship between endoreduplication and mature cortical cell size (A) and CDKA (B) in the roots of 18 Arabidopsis ecotypes. The fraction of endoreduplicated cells was estimated from 10 complete root systems from which the nuclei were isolated and analyzed by flow cytometry. Mature cortical cell length was determined as the average over all positions in the mature part of the root (see “Materials and Methods”).
Relationships between CDKA, Cell Division, and Endoreduplication
The current model for the molecular regulation of cell division involves the regulation of CDKA (Mironov et al., 1999). In corn leaves, the rate of cell division was tightly correlated with the spatial distribution of CDKA histone H1 kinase activity (Granier et al., 2000). The Arabidopsis root apical meristem is too small (500 and 700 μm for Col and C24, respectively; Beemster and Baskin, 1998; De Veylder et al., 2001b) to enable sampling of subsections that would be required to resolve the spatial distribution of kinase activity. For this reason, we harvested the apical 5 mm of 250 9-d-old primary root tips of each ecotype. This section includes the entire apical meristem, the elongation zone (approximately 2 mm; Beemster and Baskin, 1998; De Veylder et al., 2001b), and a section of mature tissue. However, it did not comprise lateral root meristems that contain dividing cells not contributing to the elongation of the primary root. For 11 ecotypes, CDKA was determined in two independent experiments, and we found a 5-fold variation (Fig. 5). As our samples contained the entire root apical meristem, it is appropriate to correlate kinase activity with the total cell production over the whole of the meristem, effectively integrating cell cycle duration and number of dividing cells (Eq. 2). Using this approach, we found a significant positive correlation between CDKA and cell production rate that accounted for 56% of the observed variation (Fig. 5A). It must be noted that this correlation is only clear for the three ecotypes with the highest cell production (Ws, Tsu, and Djn) relative to a large group of ecotypes with a lower cell production rate. The lack of correlation between cell production and kinase activity within this latter group of ecotypes illustrates the sensitivity limits of the kinase essay in these small samples. In contrast, no correlation was found between endoreduplication and kinase activity (Fig. 4B). To test if CDKA levels could explain variation in kinase activity, we conducted a western-blot analysis. A positive correlation between CDKA protein concentration and kinase activity was found (Fig. 5B), albeit that it was not highly significant (P = 0.089) and only explained 32% of the observed variation in kinase activity, suggesting that additional regulatory mechanisms play a role.
Figure 5.

Cell production rates are correlated with kinase activity and CDKA levels in the root tip of 11 Arabidopsis ecotypes. A, Relationship between kinase activity (A) and cell production (P; regression, P = −0.47 + 0.7 A; R2 = 0.56, P < 0.001). B, Relationship between CDKA levels (C) and kinase activity (regression, C = 0.02 + 0.19 A; R2 = 0.32, P = 0.09). Kinase activities were calculated relative to the average of all samples from each individual experiment and then averaged between two replicate experiments. Error bars denote ses (n = 2). CDKA levels were determined by measuring the integrated intensity on western blots. The regressions were obtained from multiple linear regression analysis.
DISCUSSION
Our results highlight the large inherent variation in growth between Arabidopsis ecotypes. As a first step resolving the relationship between cell cycle regulation and growth, we investigated the cellular basis of the observed growth rate differences, using the primary root as a model system. The data presented show that the differences are not attributable to a single growth parameter. Rather, variation in cell production and mature cell length contribute roughly equally to the total variation of root elongation rate. The rate of cell production, in turn, was primarily correlated with the average cell cycle duration, although the number of dividing cells also contributed. It is significant that we could not discover any correlation between variations in mature cell length, cell cycle duration, and the number of dividing cells, which suggests that they are all independent. For several reasons, correlation between cell production in the meristem and cell expansion in the elongation zone could be expected. First, the two processes might compete for limited resources. Second, under the spatial hypothesis, the process of cell expansion is independent upon cell division (Fiorani et al., 2000). Therefore, increasing cell division activity would not affect overall growth, but instead lead to smaller cells being produced. It could have been that differences in “general vigor” genes would affect both processes in a similar way. However, the observed independence implies that under the conditions used the two processes do not seem to compete for limited resources. Given that we analyzed genetic differences, these results also mean that separate genes probably regulate individual growth parameters. This result agrees with the observations that individual growth parameters are differentially affected by auxin, cytokinin, and the stp1 mutation (Beemster and Baskin, 2000) and by overexpression of the cell cycle gene CKS1 (De Veylder et al., 2001b). Independence of cell production and mature cell length shows that high cell production does not result in a smaller cell size. This would be predicted from a spatial model where growth results from expansion and cell division merely subdivides existing cellular compartments (Green, 1976). Therefore, the cellular model that includes cell division as a driving process is consistent with our observations. This validates the use of Equations 1 and 2 as a basis for the kinematic analysis performed here.
Kinematic Methodology
To enable multiple linear regression analysis for estimation of the relative contribution of various growth parameters to variation in root elongation rate between ecotypes, a sufficient number of lines needed to be analyzed. We arbitrarily chose 18, which proved to be sufficient. It is unfortunate that the kinematic method developed earlier for Arabidopsis roots is rather laborious, as it entails time-lapse and cell length measurements on each replicate root (Beemster and Baskin, 1998). The amount of time required for this analysis probably explains why only a limited number of treatments have been analyzed to date. Automation may ultimately help to resolve this bottleneck. However, to reduce the amount of work involved with the manual analysis, we decided to omit the time-lapse analysis and base the calculations on cell length profile and overall root elongation rate only, analogous to Baskin et al. (1995). Crucial for this approach is the determination of the basal margin of the meristem. We defined it as the position where cortical cells reach a length of 40 μm, a value representative for earlier experiments (Beemster and Baskin, 1998, 2000; De Veylder et al., 2001b). How sensitive are the results for fallacies of this assumption? Published data for the Col ecotype (Beemster and Baskin, 1998) show that the cell length of 40 μm occurs in a region where cell length changes rapidly over a relatively small distance. Based on these data, we can estimate the consequences of over- and underestimation of the length at which cells leave the meristem. If cortical cells stop dividing at a length of 20 μm, one-half of what we expected, the meristem would have been about 100 μm shorter, resulting in an underestimation of the number of meristematic cells by 6% (49 rather than 52). In a converse manner, when cells were to leave the meristem at a length of 80 μm, or double the expected value, the meristem would have been roughly 150 μm longer but contain only 4% more cells (54 cells). As average cell cycle duration was derived from overall cell production, which is not affected by the choice of the meristem boundary, and the number of meristematic cells, the errors involved in this parameter are similarly small. Therefore, an important aspect to this paper is that it presents a less laborious alternative to the full-blown kinematic analysis, which is relatively accurate, particularly with respect to the most important cell division parameters. However, there are some trade-offs. It is obvious that by using a predefined cell length for estimating the basal margin of the meristem, the actual size of cells exiting the meristem cannot be determined, nor is estimation of the physical size of the meristem very accurate (see above). As the total number of cells in the growth zone as a whole is independently estimated, the choice of the margin of the meristem partitions the same cells between meristem and elongation zone.
Relative to the number of cells in the meristem, the number of cells in the elongation zone (Nel) is rather small. Therefore, the same absolute difference in cell number will create larger relative errors. In the above example, overestimating the size of the meristem by three cells (cells are 20 μm rather than 40 μm when they exit the meristem) will result in underestimation of the number of rapidly elongating cells by 16% (16 instead of 19). In a similar manner, underestimating the number of meristematic cells by two (if cells exiting the meristem are 80 μm) will cause overestimation of the number of rapidly elongating cells by 14% (16 instead of 14). Residence time in the elongation zone can be calculated the ratio between Nel and P (Beemster and Baskin, 1998). Because P is independent of the size of the meristem, the accuracy of the calculated residence time is affected to the same extent as Nel. In conclusion, this approach is relatively accurate in terms of meristem parameters, whereas the precision of elongation zone parameters is compromised.
Molecular Basis of Differences in Cell Production
As a second step toward linking cell cycle regulation to organ growth rates, we tested if the correlation between cell division and kinase activity in the response to environmental conditions observed in corn leaves (Granier et al., 2000) could also be validated by genetic variations and in Arabidopsis roots. The data suggest that this is the case. In fact, we recently found that even in transgenic lines that are inhibited in cell production as a consequence of the overexpression of the cell cycle gene CKS1At (De Veylder et al., 2001b), kinase activity and cell production are reduced simultaneously (G.T.S. Beemster and L. De Veylder, unpublished data). Therefore, we conclude that evidence is mounting to support a pivotal regulatory role for kinase activity in plant growth regulation, in response to the environment (Granier et al., 2000) and genetic predisposition (this paper). Important in this context is how CDKA is regulated. Our data show a significant correlation between CDKA protein levels and kinase activity, implicating differences in transcription or protein stability. However, there was also considerable variation in CDKA levels that resulted in similar kinase activities (Fig. 5B), suggesting that CDKA levels could be limiting in some, but not all ecotypes. The latter situation would be analogous to that of tobacco (Nicotiana tabacum) Bright Yellow 2 suspension cultures, where most of the CDKA protein was found to be in its inactive, monomeric form (Porceddu et al., 2001). This could well explain the absence of a growth stimulatory effect when CDKA was overexpressed in C24 background (Hemerly et al., 1995). In these plants, kinase activity in the root tips was, in contrast to what was seen at the whole-plant level, not higher than wild type (G.T.S. Beemster and L. De Veylder, unpublished data). It may well be that when the same construct is overexpressed in an ecotype with intrinsically low and rate-limiting CDKA expression levels, it will result in increased kinase activity and cell division. Nevertheless, additional mechanisms are likely to operate in plants with relatively high CDK levels. It can be presumed that many of the CDK interacting proteins could fulfill this role. It has been demonstrated that overexpression of B- and D-type cyclins can enhance plant growth rates, presumably by increasing cell production in the meristems (Doerner, 1994; Cockcroft et al., 2000). In a similar manner, overexpression of the CDK inhibitor KRP2 was shown to inhibit kinase activity and cell division rates in Arabidopsis leaves (De Veylder et al., 2001a).
Endoreduplication and Mature Cell Size
Our data shows that between the 18 ecotypes analyzed, there was large variation in mature cortical cell size. We investigated the hypothesis that differences in cell size would be associated nDNA content, determined by the number of endoreduplication cycles each cell undergoes. However, we found no correlation between the fraction of cells that had undergone endoreduplication and mature cortical cell length. This is in contrast with other observations in Arabidopsis on leaf epidermal cells (Melaragno et al., 1993), hypocotyls (Gendreau et al., 1997), and trichomes. In addition, we recently reported that overexpression of the cell cycle gene KRP2 in Arabidopsis results in a large increase in the size of most cell types, whereas nDNA content in the same leaves was reduced (De Veylder et al., 2001a). Together, these data refute the conception that endoreduplication would drive or is even required for obtaining a large cell size. Rather, it seems that endoreduplication and mature cell size are genetically independent phenomena in these ecotypes. As for the regulation of the endoreduplication process itself, our data showed no correlation between CDKA kinase activity and endoreduplication levels (Fig. 4B). This could be explained in two ways. First, the kinase activity signal associated with endoreduplication is independent of and obscured by the much higher activity associated with cell production. Second, it is conceivable that endoreduplication is regulated by other CDKs such as CDKB (Yoshizumi et al., 1999) or depends upon the relative activity of a combination of different CDK types. Further research targeted directly at the regulation of this process should deliver more insight as to the validity of each of these explanations. With regard to the molecular mechanism that determines mature cell size, the processes associated with cell wall formation and expansion are obvious candidates. Most progress in this field has been made with regards to expansins. They have first been shown to be correlated with cell expansion (Cosgrove and Li, 1993), and more recently, it was also demonstrated that their overexpression alters plant growth, a change that is correlated with differences in mature cell size (Cho and Cosgrove, 2000). Therefore, it would be interesting to investigate to what extent differences in mature cell length observed here are associated with the activity and expression levels of these proteins.
Prospects
With the availability of the complete genome sequence of Arabidopsis (The Arabidopsis Initiative, 2000) and several mapping populations (Alonso-Blanco and Koornneef, 2000), it seems feasible to map and clone the genes that are responsible for the observed variations in growth parameters. One interesting aspect from such an approach is that from all the genes that potentially affect plant growth rate in some way, it would identify the ones that actually do so in natural conditions. However, the fact that such genes result in variation in cell cycle or cell expansion should not be taken as evidence that they are directly involved in these processes. It is very well possible that they involve crucial upstream events that, in turn, impact on particular growth processes. Finding the genes and functions that underlie variation in growth characteristics is going to be an exciting challenge for future research. Such work holds great promise for improvements of growth characteristics of agronomically important crop species.
MATERIALS AND METHODS
Root Growth and Microscopy
Seeds of each of 18 ecotypes (see Table I) were sterilized in 12.5% sodium hypochloride for 10 min, and eight were subsequently plated approximately 1 cm from the edge of each of 10 replicate square (9 × 9 cm) petri dishes (Greiner Biochemica, Flacht, Germany), containing 1× Murashige and Skoog medium (Duchefa, Haarlem, The Netherlands), 1 g L−1 Suc (Merck Eurolab, Darmstadt, UK), and 0.8 g L−1 plant tissue culture agar (Lab M, Bury, UK). After sowing, the plates were stored in a refrigerator at 4°C for 3 d, and were subsequently placed near vertically in a growth chamber set at 22°C and with constant light (PAR = 80 μE m−2 s−1) supplied by a bank of cool-white fluorescent tubes. Directly after germination, the position of the root tip was marked daily on the back of the dishes with a razorblade. At d 7, 9, and 11, 10 roots were harvested from two representative plates. These roots were mounted on a microscope slide in the same culture medium without the agar. Two strips of scotch tape were used as spacers to reduce pressure from the coverslip. Cortical cells were visualized using differential interference contrast optics of a microscope (DMLB; Leica, Wetzlar, Germany) fitted with a 20× lens (HL PL Fluotar; Leica, n.a. = 0.50), and an imaging system encompassing a CCD camera (4910 CCIR; Cohu, San Diego) and frame grabber board (LG3 CCIR; Scion, Frederick, MD) fitted in a PentiumII PC running the image analysis program ScionImage (WinNT version b3b; Scion). Using this imaging software, a series of overlapping images spanning 2 to 3 mm of the root apex, covering the entire growth zone and well into the mature region were obtained. The remaining plates were digitized at a resolution of 5.9 pixels mm−1 using a flatbed scanner (Scanjet 4C/T; Hewlett-Packard, Palo Alto, CA). On the latter images, the growth rate of individual roots was determined from daily length increments, i.e. its length between subsequent marks, divided by the corresponding time interval. These rates were subsequently averaged for all observed roots (E).
Kinematic Analysis
In case root growth was steady state, the cell length profile of only d 9 roots was determined. In case root growth accelerated over time, this was also done for d 7 and 11. For this, a composite image was created by pasting overlapping sections together using the imaging program Photoshop (version 5.0; Adobe Systems, Mountain View, CA). On these composite images the length of all cortical cells was measured per file and was expressed as a function of their position relative to the base of the quiescent center. The data of all files of a root were combined and interpolated into 25-μm spaced points using a kernel smoothing routine described earlier (Beemster and Baskin, 1998) implemented as a macro in Excel (version 97; Microsoft, Redmond, WA). From these data, the number of meristematic cells (Ndiv) as well as the mature cell length (lmat) was estimated for each root individually. To this end, the base of the meristem was defined as the position where the cells reach a length of 40 μm, a value typically observed in earlier experiments (Beemster and Baskin, 1998, 2000; De Veylder et al., 2001b). Average cell division rates and cell cycle duration were calculated using the equations described earlier (Beemster and Baskin, 2000).
Multiple Linear Regression Analysis
The relationships between growth parameters were investigated by multiple linear regression analysis. For this, we log transformed the data, effectively changing Equations 1 and 2 into Equations 3 and 4, respectively:
 |
Eq. 3 |
 |
Eq. 4 |
The regression analysis itself was performed using the add-in analysis toolpack of Excel (Microsoft).
Flow Cytometry
To determine DNA content of root cells, approximately 25 complete root systems of 9-d-old seedlings were harvested after the plates were scanned for evaluation of root elongation rate (see “Root Growth and Microscopy”) and prepared by chopping the roots in 300 μL of Galbraith buffer (Galbraith et al., 1991) using a razor blade. The resulting solution was filtered using a 30-μm mesh after which 1 μL of a 1 mg mL−1 stock of 4′,6-diamidino-2-phenylindole was added. The DNA content distribution was analyzed with the aid of a flow cytometer and accompanying software (Bryte HS and WinBryte, respectively; Bio-Rad, Hercules, CA).
CDKA and Concentration Assays
Histone H1 kinase activity was analyzed in two separate experiments on samples of 5-mm tips from approximately 250 roots grown on 10 plates as described above. These were cut, immediately frozen, and stored in liquid nitrogen-cooled 2-mL Eppendorf tubes. Protein extracts were prepared by grinding the frozen tissue in a cooled ball mill (mm20; Retsch, Haan, Germany), after which the protein fraction was isolated by centrifuging in a homogenization buffer (50 mm Tris-HCL, pH 7.2, 60 mm β-glycero-phosphate, 15 mm nitrophenyl phosphate, 15 mm EGTA, 15 mm MgCl2, 2 mm dithiothreitol, 0.1 mm vanadate, 50 mm NaF, 20 μg ml−1 soybean trypsin inhibitor, 100 μm benzamidine, 1 mm phenylmethylsulfonylfluoride, and 0.1% Triton X-100). Total protein concentration in the extracts was determined with a protein assay kit (Bio-Rad, Hercules, CA). CDKA complexes were purified from total plant extracts by affinity binding to p9CKS-Sepharose beads, which specifically bind A-type CDKs (Stals et al., 2000). Otherwise, the protocol described earlier was followed (Hemerly et al., 1995). To ascertain fidelity of the kinase data, we repeated the kinase assay twice in independent experiments.
CDKA protein levels were determined by western-blot analysis. For this, total protein extract was denatured for 10 min at 95°C in SDS loading buffer, separated on a 12.5% SDS-PAGE gel, and blotted on a nitrocellulose membrane (Hybond-C+; Amersham Pharmacia Biotech, Piscataway, NJ). Filters were blocked overnight with 2% milk powder in phosphate-buffered saline (PBS) containing 0.1% Tween 20 (PBST), washed five times with PBST, and probed for 2 h with anti-CDKA;1 (diluted 1/5,000 in blocking solution). The blots were rinsed five times with PBST and were incubated for 1 h with anti-rabbit horseradish peroxidase-conjugated antibodies (Amersham Pharmacia Biotech) diluted in blocking solution. The membranes were washed five times with PBST, and signals were developed using a chemiluminescent detection kit (PerkinElmer Life Sciences, Boston). The integrated intensity of the bands was measured correcting for background intensities by image analysis using the image analysis program ScionImage.
ACKNOWLEDGMENTS
The authors are grateful to Gerrit West for expert help with the kinase assays, Tom Beeckman for his support with the microscopy, and Marnik Vuylsteke for helpful suggestions. Lieven de Veylder, Marnik Vuylsteke, Tom Beeckman, Kristiina Himanen, and Fabio Fiorani are gratefully acknowledged for their constructive comments on earlier versions of this manuscript.
Footnotes
This work was supported by grants from the European Union (no. QLG2–CT–1999–00454 and no. QLK5–CT–2001) and the Interuniversity Poles of Attraction Programme (Belgian State, Prime Minister's Office-Federal Office for Scientific, Technical and Cultural Affairs; no. P5/2).
Article, publication date, and citation information can be found at www.plantphysiol.org/cgi/doi/10.1104/pp.002923.
LITERATURE CITED
- Alonso-Blanco C, Koornneef M. Naturally occurring variation in Arabidopsis: an underexploited resource for plant genetics. Trends Plant Sci. 2000;5:22–29. doi: 10.1016/s1360-1385(99)01510-1. [DOI] [PubMed] [Google Scholar]
- Baskin TI, Cork A, Williamson RE, Gorst JR. STUNTED PLANT 1, a gene required for expansion in rapidly elongating but not in dividing cells and mediating root growth responses to applied cytokinin. Plant Physiol. 1995;107:233–243. doi: 10.1104/pp.107.1.233. [DOI] [PMC free article] [PubMed] [Google Scholar]
- Beemster GTS, Baskin TI. Analysis of cell division and elongation underlying the developmental acceleration of root growth in Arabidopsis. Plant Physiol. 1998;116:515–526. doi: 10.1104/pp.116.4.1515. [DOI] [PMC free article] [PubMed] [Google Scholar]
- Beemster GTS, Baskin TI. Stunted Plant 1 mediates effects of cytokinin, but not of auxin, on cell division and expansion in the root of Arabidopsis. Plant Physiol. 2000;124:718–727. doi: 10.1104/pp.124.4.1718. [DOI] [PMC free article] [PubMed] [Google Scholar]
- Cavalier-Smith T. Nuclear volume control by nucleoskeletal DNA, selection for cell volume and cell growth rate, and the solution of the DNA C-value paradox. J Cell Sci. 1978;34:247–278. doi: 10.1242/jcs.34.1.247. [DOI] [PubMed] [Google Scholar]
- Cho HT, Cosgrove DJ. Altered expression of expansin modulates leaf growth and pedicel abscission in Arabidopsis thaliana. Proc Natl Acad Sci USA. 2000;97:9783–9788. doi: 10.1073/pnas.160276997. [DOI] [PMC free article] [PubMed] [Google Scholar]
- Cockcroft CE, Den Boer BGW, Healy JMS, Murray JAH. Cyclin D control of growth rate in plants. Nature. 2000;405:575–579. doi: 10.1038/35014621. [DOI] [PubMed] [Google Scholar]
- Cosgrove DJ, Li Z-C. Role of expansin in cell enlargement of oat coleoptiles: analysis of developmental gradients and photocontrol. Plant Physiol. 1993;103:1321–1328. doi: 10.1104/pp.103.4.1321. [DOI] [PMC free article] [PubMed] [Google Scholar]
- De Veylder L, Beeckman T, Beemster GTS, Krols L, Terras F, Landrieu I, Van der Schueren E, Maes S, Naudts M, Inzé D. Functional analysis of cyclin-dependent kinase inhibitors of Arabidopsis. Plant Cell. 2001a;13:1653–1668. doi: 10.1105/TPC.010087. [DOI] [PMC free article] [PubMed] [Google Scholar]
- De Veylder L, Beemster GTS, Beeckman T, Inzé D. CKS1At overexpression in Arabidopsis thaliana inhibits growth by reducing meristem size and inhibiting cell-cycle progression. Plant J. 2001b;25:617–626. doi: 10.1046/j.1365-313x.2001.00996.x. [DOI] [PubMed] [Google Scholar]
- Doerner P, Jorgensen J-E, You R, Steppuhn J, Lamb C. Control of root growth and development by cyclin expression. Nature. 1996;380:520–523. doi: 10.1038/380520a0. [DOI] [PubMed] [Google Scholar]
- Doerner PW. Cell cycle regulation in plants. Plant Physiol. 1994;106:823–827. doi: 10.1104/pp.106.3.823. [DOI] [PMC free article] [PubMed] [Google Scholar]
- Fiorani F, Beemster GTS, Bultynck L, Lambers H. Can meristematic activity determine variation in leaf size and elongation rate among four Poa species? A kinematic study. Plant Physiol. 2000;124:845–856. doi: 10.1104/pp.124.2.845. [DOI] [PMC free article] [PubMed] [Google Scholar]
- Galbraith DW, Harkins KR, Knapp S. Systemic endopolyploidy in Arabidopsis thaliana. Plant Physiol. 1991;96:985–989. doi: 10.1104/pp.96.3.985. [DOI] [PMC free article] [PubMed] [Google Scholar]
- Gendreau E, Traas J, Desnos T, Grandjean O, Caboche M, Höfte H. Cellular basis of hypocotyl growth in Arabidopsis thaliana. Plant Physiol. 1997;114:295–305. doi: 10.1104/pp.114.1.295. [DOI] [PMC free article] [PubMed] [Google Scholar]
- Granier C, Inzé D, Tardieu F. Spatial distribution of cell division rate can be deduced from that of p34cdc2 kinase activity in maize leaves grown at contrasting temperatures and soil water conditions. Plant Physiol. 2000;124:1393–1402. doi: 10.1104/pp.124.3.1393. [DOI] [PMC free article] [PubMed] [Google Scholar]
- Green PB. Growth and cell pattern formation on an axis: critique of concepts, terminology and modes of study. Bot Gaz. 1976;137(3):187–202. [Google Scholar]
- Haber AH. Nonessentiality of concurrent cell divisions for degree of polarization of leaf growth: studies with radiation-induced mitotic inhibition. Am J Bot. 1962;49(6):583–589. [Google Scholar]
- Hemerly AS, de Almeida-Engler J, Bergounioux C, Van Montagu M, Engler G, Inzé D, Ferreira P. Dominant negative mutants of the Cdc2 kinase uncouple cell division from iterative plant development. EMBO J. 1995;14:3925–3936. doi: 10.1002/j.1460-2075.1995.tb00064.x. [DOI] [PMC free article] [PubMed] [Google Scholar]
- Ivanov VB. Root growth responses to chemicals. Sov Sci Rev D Physicochem Biol. 1994;13:1–70. [Google Scholar]
- Kondorosi É, Roudier F, Gendreau E. Plant cell-size control: growing by ploidy? Curr Opin Plant Biol. 2000;3:488–492. doi: 10.1016/s1369-5266(00)00118-7. [DOI] [PubMed] [Google Scholar]
- Lambers H, Poorter H, Van Vuren MMI. Inherent Variation in Plant Growth. Leiden, Germany: Vol Backhuys Publishers; 1998. [Google Scholar]
- Li B, Suzuki JI, Hara T. Latitudinal variation in plant size and relative growth rate in Arabidopsis thaliana. Oecologia. 1998;115:293–301. doi: 10.1007/s004420050519. [DOI] [PubMed] [Google Scholar]
- Melaragno JE, Mehrotra B, Coleman AW. Relationship between endopolyploidy and cell size in epidermal tissue of Arabidopsis. Plant Cell. 1993;5:1661–1668. doi: 10.1105/tpc.5.11.1661. [DOI] [PMC free article] [PubMed] [Google Scholar]
- Mironov V, De Veylder L, Van Montagu M, Inzé D. Cyclin-dependent kinases and cell division in plants: the nexus. Plant Cell. 1999;11:509–521. doi: 10.1105/tpc.11.4.509. [DOI] [PMC free article] [PubMed] [Google Scholar]
- Pigliucci M. Ecological and evolutionary genetics of Arabidopsis. Trends Plant Sci. 1998;3:485–489. [Google Scholar]
- Porceddu A, Stals H, Reichheld J-P, Segers G, De Veylder L, de Pinho Barröcco R, Casteels P, Van Montagu M, Inzé D, Mironov V. A plant-specific cyclin-dependent kinase is involved in the control of G2/M progression in plants. J Biol Chem. 2001;276:36354–36360. doi: 10.1074/jbc.M011060200. [DOI] [PubMed] [Google Scholar]
- Silk WK. Quantitative descriptions of development. Annu Rev Plant Physiol. 1984;35:479–518. [Google Scholar]
- Stals H, Casteels P, Van Montagu M, Inzé D. Regulation of cyclin-dependent kinases in Arabidopsis thaliana. Plant Mol Biol. 2000;43:583–593. doi: 10.1023/a:1006409907831. [DOI] [PubMed] [Google Scholar]
- The Arabidopsis Initiative. Analysis of the genome sequence of the flowering plant Arabidopsis thaliana. Nature. 2000;408:796–815. doi: 10.1038/35048692. [DOI] [PubMed] [Google Scholar]
- Yoshizumi T, Nagata N, Shimada H, Matsui M. An Arabidopsis cell cycle-dependent kinase-related gene, CDC2b, plays a role in regulating seedling growth in darkness. Plant Cell. 1999;11:1883–1895. doi: 10.1105/tpc.11.10.1883. [DOI] [PMC free article] [PubMed] [Google Scholar]