Abstract
A transgenic mouse has been created that provides a powerful tool for revealing genetic and environmental factors that modulate mitotic homologous recombination. The fluorescent yellow direct-repeat (FYDR) mice described here carry two different copies of expression cassettes for truncated coding sequences of the enhanced yellow fluorescent protein (EYFP), arranged in tandem. Homologous recombination between these repeated elements can restore full-length EYFP coding sequence to yield a fluorescent phenotype, and the resulting fluorescent recombinant cells are rapidly quantifiable by flow cytometry. Analysis of genomic DNA from recombined FYDR cells shows that this mouse model detects gene conversions, and based on the arrangement of the integrated recombination substrate, unequal sister-chromatid exchanges and repair of collapsed replication forks are also expected to reconstitute EYFP coding sequence. The rate of spontaneous recombination in primary fibroblasts derived from adult ear tissue is 1.3 ± 0.1 per 106 cell divisions. Interestingly, the rate is ≈10-fold greater in fibroblasts derived from embryonic tissue. We observe an ≈15-fold increase in the frequency of recombinant cells in cultures of ear fibroblasts when exposed to mitomycin C, which is consistent with the ability of interstrand crosslinks to induce homologous recombination. In addition to studies of recombination in cultured primary cells, the frequency of recombinant cells present in skin was also measured by direct analysis of disaggregated cells. Thus, the FYDR mouse model can be used for studies of mitotic homologous recombination both in vitro and in vivo.
Human cells incur ≈106 base lesions per day (1), many of which inhibit DNA replication and/or induce DNA strand breaks. Homology-directed repair provides an important strategy for preventing toxicity caused by such DNA lesions. More specifically, when the replication machinery stalls, recombination between sister chromatids can replace the damaged template with an undamaged copy (2). In addition, should a replication fork collapse to form a double-strand break (e.g., because of an encounter with a single-strand break in the template DNA), the fork can be repaired by homology-directed reinsertion of the broken end (3–5). Thus, the frequency of recombination reflects the levels of certain types of DNA damage.
Repair and lesion-avoidance pathways that involve homology searching are integral to DNA replication (3–7). It is estimated that ≈10 double-strand breaks are formed each time the mammalian genome is replicated (3), and proteins that are essential for homologous recombination (e.g., Rad51) are also essential for life (8–10). Most of the time, sequences are aligned perfectly, and flanking sequences are not exchanged. However, misalignments may result in deletions, and exchanges between homologous chromosomes may lead to loss of heterozygosity, events that are known to promote cancer (11–14).
A useful approach to studying recombination is to engineer two mutant expression cassettes in a direct repeat and assay for restoration of wild-type gene expression in cultured cells (2, 15, 16). For example, by using direct-repeat substrates, it has been shown that homologous recombination repairs 30–50% of double-strand breaks in mammalian cells (17). Furthermore, direct repeats have been used to demonstrate that many tumor-suppressor genes including BRCA1, BRCA2, ATM, WRN, MSH2, and NBS1 modulate spontaneous mitotic homologous recombination in mammalian cells (18–23). Despite their proven efficacy, few animal models have been created that exploit direct-repeat substrates (24–26), and none are suitable for the detection of mitotic homologous recombination events in somatic tissues of mature animals. Consequently, little is known about the relative susceptibility of different cell types to homologous recombination or how DNA repair and tumor-suppressor genes influence homologous recombination in mammals (27).
Here we describe the f luorescent yellow direct-repeat (FYDR) mouse model in which cells become fluorescent after homologous recombination at a direct repeat. The spontaneous frequency and rate of homologous recombination in primary cells from these mice can be determined by using flow cytometry. Interestingly, we found that the rate of spontaneous recombination is ≈10-fold greater in embryonic fibroblasts compared with fibroblasts from ear tissue. Furthermore, recombinant cells within skin can be quantified without culturing cells ex vivo. Thus, the FYDR mice provide an effective means for studying homologous recombination in primary somatic cells both in vitro and in vivo.
Materials and Methods
Enzymes, Oligonucleotides, and Plasmids. Restriction enzymes were from New England Biolabs. Advantage II polymerase (CLONTECH) was used for preparative PCR. Oligonucleotides were from Amitof (Allston, MA). Vectors used were pEYFP-N1 (CLONTECH), pCX-enhanced GFP (EGFP) [gift of M. Okabe, Osaka University, Suita, Osaka (28)], and pBluescript (Stratagene). Primer sequences are available on request.
Construction of the Recombination Substrate. Truncated coding sequences (lacking either 96 bp from the 5′ end or 42 bp from the 3′ end) were PCR-amplified from pEYFP-N1 by using primers carrying synthetic ApoI sites. ApoI-digested PCR products were subcloned into EcoRI-digested pCX-EGFP (28) (coding regions were sequenced). In pCX-5′eyfp [an expression vector for truncated enhanced yellow fluorescent protein cDNA (EYFP) coding sequence], SalI was converted to NotI, and an adaptor containing SalI–XhoI–HindIII–NotI was inserted between BamHI sites (BamHI sites were not regenerated). The 3′eyfp (another expression cassette for truncated EYFP coding sequence) was released by using SalI/HindIII and subcloned into XhoI/HindIII-digested pCX-5′eyfp to create a direct repeat.
Creation of Transgenic Mice. A direct-repeat NotI fragment was purified by using QiaexII (Qiagen, Valencia, CA). Pronuclear injection into C57BL/6-fertilized eggs was performed by the Brigham and Women's Transgenics Facility (Boston).
Isolation of Ear Fibroblasts and Ventral Skin Cells. Cells were isolated as described (29). Briefly, minced skin was incubated in medium containing collagenase D and dispase neutral protease. After 45 min at 37°C, two volumes of fibroblast medium was added [DMEM/15% FBS/100 units/ml penicillin/100 μg/ml streptomycin/5 μg/ml fungizone (GIBCO/BRL)]. After 24 h at 37°C and 5% CO2, cells were triturated, filtered (70-μm mesh; Falcon), and analyzed by flow cytometry (ventral skin cells) or seeded into dishes (ear fibroblasts).
Isolation and Transformation of Primary Mouse Embryo Fibroblasts (MEFs). Day-14.5 embryos were isolated, minced, and resuspended in 15 ml of trypsin/EDTA. After 25 min at 37°C with agitation, cells were pelleted, resuspended in fibroblast medium (see above), and seeded. MEFs were transformed as described (30).
Flow Cytometry. Pelleted cells were resuspended in OptiMEM (GIBCO/BRL) and passed through a 70-μm filter (Falcon) before analysis with a Becton Dickinson FACScan flow cytometer (excitation 488 nm, argon laser) or sorting with a Cytomation (Fort Collins, CO) MoFlo cytometer (excitation 488 nm, argon laser; emission 580/30). Live cells were gated by using forward and side scatter.
Calculation of Spontaneous Recombination Frequency and Rate in Primary Fibroblasts. Approximately 104 cells were seeded into ≈24 independent cultures. For frequency studies, cultures were harvested once the density reached 106 cells per dish. The method of p0 was used to determine the recombination rate per cell division as described (31, 32). Samples with frequencies of recombinant cells consistent with the presence of a fluorescent cell in the initial population were excluded from analysis.
Southern Analysis. 32P-labeled probes were prepared by random priming (NEBlot, New England Biolabs), and blots were processed by using standard procedures (33). Blots were analyzed on a Storm 840 Molecular Dynamics PhosphorImager.
Subcloning Genomic DNA from FYDR Mice. Genomic DNA from FYDR mice was cloned into a ZAP Express λ library following manufacturer instructions (Stratagene). The library was screened by using a coding-sequence probe from pEYFP-N1.
Quantification of DNA Damage-Induced Recombination. Primary ear fibroblasts from FYDR mice were pooled and seeded at 3 × 10⁶ cells per 148-cm2 dish. After 24 h, triplicate samples were exposed to 0.5–4 μg/ml mitomycin C (MMC) for 1 h. After 72 h (≈3.25 population doublings in control cells), samples were analyzed by flow cytometry. Relative population growth was determined from the number of viable cells per dish.
Results
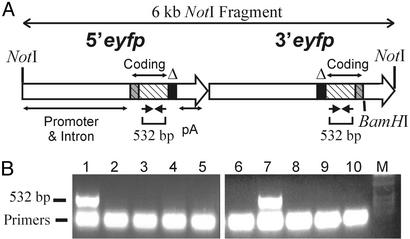
Creation of FYDR Mice. To create a substrate for detecting recombinant cells in transgenic mice, essential sequences (34) were deleted from either end of the EYFP coding sequence to create 5′eyfp and 3′eyfp. These truncated coding-sequence expression cassettes are flanked upstream and downstream by identical promoter, intron, and polyadenylation signal sequences. The flanking sequences were selected based on their proven efficacy for high-level expression in most mouse tissues (28). A direct repeat was created by subcloning 5′eyfp and 3′eyfp in tandem, and the resulting 6-kb NotI fragment (Fig. 1A) was injected into mouse pronuclei to create transgenic mice. PCR analysis with primers that anneal to EYFP coding sequences revealed that 2 of 15 candidate transgenic mice carried at least a portion of the injected DNA (data identifying one candidate are shown in Fig. 1B, lane 7).
Fig. 1.
Arrangement of injected DNA and PCR screen of candidate transgenic mice. (A) Sequences in 5′eyfp and 3′eyfp are represented by two large arrows with emphasis on the coding sequences (hatched), deleted regions (black), and sequences unique to each cassette (gray). Promoter, intron, and polyadenylation signal (pA) sequences are indicated. Expression is driven by the chicken β-actin promoter and cytomegalovirus enhancer. (B) PCR analysis of candidate mice with primers that anneal to EYFP coding sequence as shown in A. Template DNA was from mouse cells expressing EGFP (lane 1), wild-type mouse cells (lanes 2 and 3), and a subset of candidate mice (lanes 4–10). M, size standards.
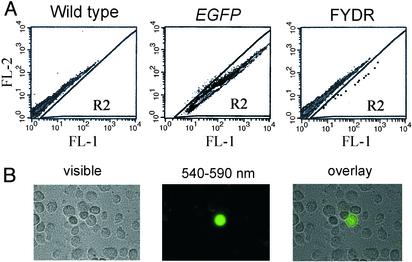
Quantification of recombinant cells is possible only if the injected DNA is integrated into a locus that is expressed and undergoes spontaneous recombination at a detectable frequency. To determine whether mice that were positive by PCR had integrated the DNA at such a locus, we used flow cytometry to test for the presence of recombinant fluorescent cells within cultures of primary ear fibroblasts (Fig. 2A). When the relative fluorescence intensity per cell is plotted, normal unstained fibroblasts show a range of natural fluorescence intensities. As a positive control, we analyzed fluorescent cells from a mouse that expresses EGFP (28). Given that EGFP and EYFP are indistinguishable under these conditions (data not shown), we delineated the R2 region to capture almost all of the EGFP-expressing cells. Fluorescent cells were detected both by flow cytometry (Fig. 2 A Right) and fluorescence microscopy (Fig. 2B) in cultures derived from one of the candidates. This founder was crossed with wild-type C57BL/6 mice to establish the FYDR mouse line. The integrated DNA is inherited in a Mendelian fashion (51% of offspring carry the integrated DNA; n = 129), suggesting that the integrated DNA does not affect viability significantly.
Fig. 2.
Analysis of cells from the FYDR founder mouse. (A) Flow-cytometry results for fibroblasts from a wild-type mouse, an EGFP-expressing mouse (28), and the FYDR founder mouse. Relative fluorescence intensity is 515–545 nm (FL-1) versus 562–588 nm (FL-2). For clarity, data for individual cells (dots) have been darkened in the FYDR R2 region. (B) Images of fibroblasts from the FYDR founder mouse.
Genomic Arrangement of the Recombination Substrate in FYDR Mice. To learn about the mechanisms of homologous recombination that can yield full-length EYFP sequence in FYDR mice, the locus of integration and arrangement of the integrated DNA were determined as follows.
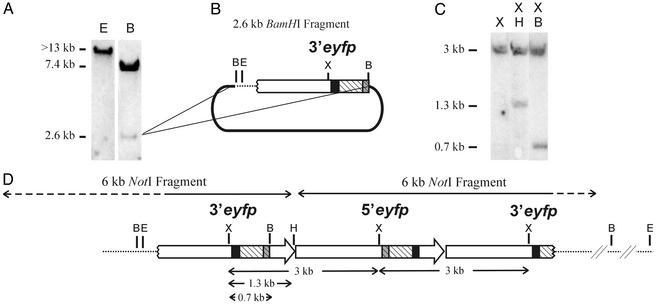
The number of integration sites was assessed by Southern analysis of FYDR genomic DNA. Because there are no EcoRI sites within the injected substrate, the presence of a single EcoRI fragment indicates that there is a single integration site (Fig. 3A). To determine whether multiple copies of the substrate had been integrated, a BamHI digest was Southern-blotted. Because the injected NotI fragment has a single BamHI site downstream of the 3′eyfp coding sequences (Fig. 1 A), a single BamHI band is expected if only one copy of the 6-kb NotI fragment is present. The presence of 7.4- and 2.6-kb fragments (Fig. 3A) indicates that more than one copy of the injected DNA had integrated into the mouse genome.
Fig. 3.
Arrangement of the integrated DNA within FYDR mice. (A) Southern analysis of FYDR genomic DNA probed with EYFP coding sequence. (B) Map of the 2.6-kb BamHI fragment subcloned into pBluescript (thick line). (C) Southern analysis of FYDR genomic DNA probed with EYFP coding sequences. (D) Diagram of the DNA integrated within the FYDR mice. Expression cassettes are indicated by large arrows as in Fig. 1 A. Dotted lines, genomic DNA; dashed portions of the upper arrows, degraded sequences. Restriction sites are BamHI (B), EcoRI (E), XbaI (X), and HindIII (H).
To characterize the integrated DNA further, we created a λ library from BamHI-digested FYDR genomic DNA. Cloning and sequencing the 2.6-kb BamHI fragment revealed that it contains 473 bp of genomic DNA and part of a 3′eyfp cassette (Fig. 3 A and B). By using this genomic sequence to query the NCBI mouse genome database, a perfect match was obtained to a single site on mouse chromosome 1. PCR with primers that anneal to published flanking sequences confirmed the site of integration (data not shown). There are no known genes at this site, thus we do not anticipate that the integrated DNA will have significant biological effects.
Extensive Southern, PCR, and sequencing analysis (data not shown) suggests that the arrangement of the integrated DNA is as shown in Fig. 3D. An example of an experiment that tests this arrangement is shown in Fig. 3C. FYDR genomic DNA was digested with XbaI alone and in combination with either HindIII or BamHI. A 3-kb XbaI fragment was reduced to either 1.3 or 0.7 kb by these digestions, which is consistent with the arrangement shown in Fig. 3D. We therefore conclude that the FYDR mice carry a degraded 3′eyfp cassette (missing the promoter and the first 250 bp of the intron) followed by a complete 5′eyfp cassette and a downstream degraded 3′eyfp cassette (lacking coding sequence and the entire polyadenylation signal).
Given that the downstream 3′eyfp cassette lacks essential coding sequences for both the amino terminus (engineered deletion) and the carboxyl terminus (degraded during integration), recombination between the 5′eyfp cassette and this downstream 3′eyfp fragment cannot give rise to full-length EYFP sequence. Thus, recombination between the upstream 3′eyfp and the central 5′eyfp is responsible for reconstitution of full-length EYFP coding sequence and the observed expression of EYFP.
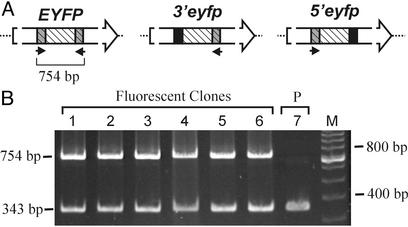
Mechanisms of Homologous Recombination in FYDR Cells. FYDR MEFs were immortalized with simian virus 40 large tumor antigen to facilitate clonal expansion of isolated cells. Yellow fluorescent cells then were isolated by fluorescence-activated cell sorting and expanded in culture. PCR with primers that only amplify full-length EYFP sequence (Fig. 4A) revealed that full-length coding sequence is only present in fluorescent clones and not in the nonfluorescent parent population (Fig. 4B). We therefore conclude that the yellow fluorescent phenotype is caused by restoration of full-length coding sequence by homologous recombination events that join essential 5′ coding sequences (uniquely present in 5′eyfp) with essential 3′ coding sequences (uniquely present in the upstream 3′eyfp cassette).
Fig. 4.
PCR analysis of recombinant yellow fluorescent clones. (A) Primers that bind sequences unique to either 3′eyfp or 5′eyfp yield a 754-bp product from full-length EYFP only (the large arrows are as in Fig. 1 A but not to scale). (B) PCR analysis of parent transformed cells (P, lane 7) and yellow fluorescent clones (lanes 1–6) with primers that specifically amplify full-length EYFP (indicated in A) and primers that amplify an internal control locus (343 bp of the Aag gene). M, size standards.
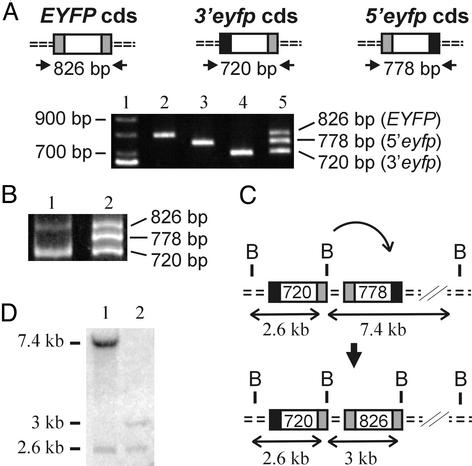
To explore the mechanism of homologous recombination, DNA from fluorescent clones was analyzed by PCR and Southern analysis, and an example is presented in Fig. 5. PCR with primers that anneal to sequences flanking the coding region yields products of distinct lengths for the full-length EYFP and each of the truncated copies (3′eyfp and 5′eyfp) (Fig. 5A). Interestingly, these primers yielded products for only EYFP and 3′eyfp when DNA from fluorescent clone Y1 was used as a template (Fig. 5B, lane 1). This result is consistent with a nonreciprocal gene-conversion event in which the upstream 3′eyfp has donated sequences to 5′eyfp. In such an event, the BamHI site in the 3′eyfp cassette is likely to be copied along with coding sequences (Fig. 5C). Indeed, Southern analysis shows the presence of a BamHI site at the expected location within the genome of clone Y1 (Fig. 5D, lane 2). We therefore conclude that clone Y1 underwent a gene-conversion event.
Fig. 5.
Analysis of the recombination mechanism in a recombinant clone. Diagrams depict coding sequences (cds) only. Common sequences are in white, essential terminal coding sequences are in gray, and deleted sequences are in black. (A) Primers that amplify coding sequences yield the indicated products (Upper). PCRs of template DNA from plasmids carrying EYFP (lane 2), 5′eyfp (lane 3), and 3′eyfp (lane 4) are shown. Lane 1 shows size markers, and lane 5 shows a mixture of PCR products from lanes 2–4. (B) PCR results from yellow fluorescent clone Y1 (lane 1) and a mixture of control PCR products (lane 2). (C) Schematic diagram of gene conversion. B, BamHI. (D) BamHI-digested DNA from the nonfluorescent parent population (lane 1) and fluorescent clone Y1 (lane 2), probed with EYFP coding sequences. Note that the degraded downstream 3′eyfp cassette (Fig. 3D) cannot participate in events that reconstitute EYFP, cannot be amplified by using the primers indicated in A, does not yield a detectable signal by Southern analysis, and thus is not depicted in C.
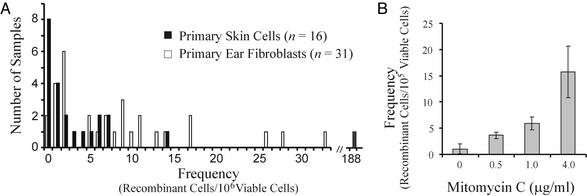
Quantification of Fluorescent Recombinant Cells Within FYDR Mouse Tissues and Cells. The use of fluorescence as an indicator of recombination enables direct analysis of cells from a mouse. In 16 different samples of disaggregated skin tissue, the recombinant cell frequency ranges from 0 to 188 fluorescent cells per million viable cells (Fig. 6A, black bars). Cultures of primary untransformed ear fibroblasts were expanded from 31 different samples of ear tissue and analyzed similarly (Fig. 6A, white bars). The observed variations in recombinant cell frequency are consistent with fluorescent cells giving rise to daughter cells during clonal expansion either in vitro (ear cells) or in vivo (ventral skin cells). Overall, the frequency of recombinant cells was similar in vitro and in vivo.
Fig. 6.
Recombination in FYDR skin cells and ear fibroblasts. (A) Spontaneous frequency of recombinant cells per 106 viable cells. n, number of independent samples. (B) MMC-induced recombination in cultured ear fibroblasts. A representative histogram from one of three independent experiments is shown. The 95% confidence intervals are indicated.
Frequency and Rate of Homologous Recombination in Primary Fibroblasts. Having a mouse model makes it possible to compare recombination susceptibility among cells from different stages of development. We measured the rate of recombination [using the p0 method (31, 32)] and the frequency of recombinant cells in primary untransformed fibroblasts from embryos (MEFs) and from ear tissue. Interestingly, we found both the frequency and rate of recombination to be 8- to 10-fold higher in embryonic fibroblasts compared with fibroblasts from adult animals (Tables 1 and 2).
Table 1. Frequencies of homologous recombination in primary fibroblasts.
| Experiments | n | Frequency, mean × 10-6 |
|---|---|---|
| Ear fibroblasts | ||
| 1 | 17 | 4.7 |
| 2 | 22 | 3.9 |
| 3 | 20 | 3.5 |
| Embryo fibroblasts | ||
| 1 | 16 | 22.0 |
| 2 | 9 | 32.0 |
| 3 | 17 | 50.0 |
The averages ± SD were 4.0 ± 0.6 (ear fibroblasts) and 34.7 ± 14.2 (embryo fibroblasts), which show a significant difference (Student's t test; P < 0.05).
Table 2. Rates of homologous recombination in primary fibroblasts.
| Experiments | n | Rate, per cell division × 10-6 |
|---|---|---|
| Ear fibroblasts | ||
| 1 | 17 | 1.2 |
| 2 | 22 | 1.4 |
| 3 | 20 | 1.4 |
| Embryo fibroblasts | ||
| 1 | 19 | 14.8 |
| 2 | 21 | 14.1 |
| 3 | 23 | 11.9 |
The averages ± SD were 1.3 ± 0.1 (ear fibroblasts) and 13.6 ± 1.5 (embryo fibroblasts), which show a significant difference (Student's t test; P < 0.05).
DNA Damage-Induced Recombination in Primary FYDR Fibroblasts. Primary FYDR ear fibroblasts were exposed to a potent DNA crosslinking agent, MMC. At doses of MMC that cause between 33% and 90% reduction in relative growth, the frequency of fluorescent cells rises dramatically (Fig. 6B). An increase in recombination frequency was also observed in primary MEFs exposed to MMC (data not shown). Thus, primary untransformed cells from FYDR mice can be used to study damage-induced homologous recombination.
Discussion
Despite the importance of homology-directed repair, both as a fundamental process during mitosis and as a risk factor in neoplasia, very few mouse models have been developed for the purpose of studying homologous recombination in mammals. The lack of such models has not only hampered studies of recombination in vivo but has also prevented the application of the most basic tool of geneticists, namely the analysis of offspring from crossbreeding. Further, the link between DNA damage and recombination indicates that such a mouse model could enable studies of environmentally induced DNA damage in animals. Here we have described a mouse model that provides an effective means for studying recombination both in vitro and in vivo.
The direct-repeat recombination substrate present in the FYDR mice allows detection of gene-conversion events (Fig. 5), one of the most common mechanisms of recombination in mammalian cells (35, 36). In addition, the arrangement of the integrated DNA is compatible with detection of other types of recombination events such as unequal sister-chromatid exchanges and repair of collapsed replication forks. Single-strand annealing, however, is not a mechanism that can restore EYFP expression, because annealing of a double-strand break located between the upstream 3′eyfp and the 5′eyfp cassettes will result in an expression cassette lacking coding sequence from both the 5′ and 3′ ends. Although it is theoretically possible that strand slippage could restore EYFP coding sequence (37, 38), recombination at long direct repeats (similar to integrated DNA in the FYDR mice) has been shown to be both Rad51- and Rad52-dependent in eukaryotic cells (39), indicating that these events involve homology searching. Taken together, the arrangement of the integrated DNA within the FYDR mice allows for detection of mitotic homologous recombination and thus provides a simple and powerful approach for measuring recombination frequency in normal untransformed primary cells.
We measured the rates of recombination in primary ear fibroblasts and in embryonic fibroblasts and found the rates to be 1.3 ± 0.1 and 13.6 ± 1.5 per 106 cell divisions, respectively. Recombination rates reported for comparable direct-repeat substrates in transformed mammalian cell lines are highly variable but are generally between ≈1 and ≈7 per 106 cell divisions (15, 40–44). Thus, despite fundamental differences in methodology (i.e., fluorescence versus drug-resistant phenotypes), the observed rates of recombination in fibroblasts of FYDR mice encompass the majority of previously reported rates.
Interestingly, embryonic fibroblasts appear to have a 10-fold higher rate of spontaneous recombination compared with fibroblasts cultured from ear tissue. Although it is formally possible that this difference could be due to variations in EYFP expression, it seems more likely to reflect a difference in recombination rate, because the average fluorescence intensity per recombinant cell was essentially identical in embryonic and ear fibroblasts (data not shown). A possible cause for these apparent differences in recombination rates may be that embryonic cells have a greater propensity for homologous recombination (45), possibly because of differences in regulation of this pathway. Clearly, additional studies are necessary to reveal the underlying biological basis for the observed differences in recombination rates for embryonic versus adult cells.
Two mouse models, pun and APRT+/-, have been used in studies of homologous recombination in somatic cells. The pun mice carry a natural duplication in a gene that controls pigmentation and have been used in studies of damage-induced recombination (e.g., refs. 46–48). An important difference between pun and FYDR mice is that in pun mice, only recombination events that arise during development can be detected, whereas recombination events that occur both during development as well as in adult tissues can be detected in FYDR mice. Additionally, recombination can be detected in FYDR MEFs, making it relatively easy to determine how specific genes influence recombination. For example, whereas >400 pun mice were needed to determine the effects of WRN on spontaneous homologous recombination (49), an analogous study with FYDR MEFs would require only ≈10 mice.
APRT+/- mice provide a valuable system for studies of loss of heterozygosity caused by mitotic homologous recombination. However, loss of heterozygosity can also be caused by other mechanisms including point mutations, deletions, aneuploidy, and mitotic homologous recombination (29, 50–52). Specific identification of clones in which mitotic homologous recombination occurred required a combination of PCR, G-banding, and chromosome painting (29). In contrast, only mitotic homologous recombination can restore EYFP coding sequences in FYDR mice, which thus provide a more direct approach for studying mitotic homologous recombination.
In addition to studies of recombination in cultured cells, the FYDR mice permit the detection of recombination events that occur in vivo. Fluorescent recombinant cells within disaggregated skin tissue can be readily quantified by flow cytometry. Further studies are required to determine the frequency of recombination in other tissues.
Direct-repeat recombination substrates offer an effective approach for elucidating the effects of specific genes on recombination susceptibility. However, such studies are hampered by the fact that the locus of integration and the arrangement of the integrated DNA drastically influence the rate of recombination (42, 53–55). To overcome these problems, researchers have targeted homologous recombination substrates to specific loci (e.g., refs. 18, 21, and 56). However, it remains technically difficult to simultaneously alter expression of multiple genes while keeping a recombination substrate constant. The FYDR mice offer a simple means for overcoming this barrier. For example, one application of FYDR mice is that they can be crossed with mice that carry specific mutations in DNA-repair genes. These mice then can be crossed further with mice that carry mutations in additional genes of interest such as p53. Without a mouse model, it would not be feasible to create primary somatic cells that carry mutations in multiple genes of interest while maintaining an identical substrate for detecting recombination. Furthermore, the detection of recombination events in animals may have great utility as a measure of DNA damage caused by environmental factors such as ionizing radiation or potential carcinogens. In conclusion, the FYDR mice can be used to study homologous recombination in vivo and to provide primary cells for studies of recombination in vitro, thus providing valuable approaches for revealing genetic and environmental factors that affect genome stability in mammals.
Acknowledgments
We are grateful to Drs. G. N. Wogan, J. Cairns, and L. D. Samson for helpful suggestions in preparing this manuscript. We thank Dr. A. J. Engelward for statistical consultation; Dr. B. J. Glassner, T. Matsuguchi, L. Vuong, Y. Yun, Dr. C. Liu, Dr. L. Du, Dr. S. Erdman, G. Paradis, the Massachusetts Institute of Technology (MIT) Cancer Center, and the MIT Division of Comparative Medicine for technical support; Drs. R. Sasisekharan and D. A. Lauffenburger for helpful advice; and Dr. M. Okabe for pCX-EGFP and EGFP mice. This work was supported by National Institutes of Health Grants CA79827 and CA84740 and the Burroughs Wellcome Fund. Support was also received from the National Defense Science and Engineering Graduate Fellowship (to C.A.H.), National Institute of General Medical Sciences Biotechnology Training Grant T32GM008334 (to C.A.H. and M.S.S.), National Institutes of Health Training Grant 5 T32 ES07020 (to K.H.A.), and the MIT Center for Environmental Health Sciences, National Institute on Environmental Health Sciences Grant 5 P30 S02109.
Abbreviations: FYDR, fluorescent yellow direct repeat; EYFP, enhanced yellow fluorescent protein; EGFP, enhanced GFP; 5′eyfp and 3′eyfp, expression cassettes for truncated EYFP coding sequence; MEF, mouse embryo fibroblast; MMC, mitomycin C.
References
- 1.Holmquist, G. P. (1998) Mutat. Res. 400, 59–68. [DOI] [PubMed] [Google Scholar]
- 2.Paques, F. & Haber, J. E. (1999) Microbiol. Mol. Biol. Rev. 63, 349–404. [DOI] [PMC free article] [PubMed] [Google Scholar]
- 3.Haber, J. E. (1999) Trends Biochem. Sci. 24, 271–275. [DOI] [PubMed] [Google Scholar]
- 4.Kuzminov, A. (2001) Proc. Natl. Acad. Sci. USA 98, 8461–8468. [DOI] [PMC free article] [PubMed] [Google Scholar]
- 5.Michel, B., Flores, M. J., Viguera, E., Grompone, G., Seigneur, M. & Bidnenko, V. (2001) Proc. Natl. Acad. Sci. USA 98, 8181–8188. [DOI] [PMC free article] [PubMed] [Google Scholar]
- 6.Arnaudeau, C., Lundin, C. & Helleday, T. (2001) J. Mol. Biol. 307, 1235–1245. [DOI] [PubMed] [Google Scholar]
- 7.Johnson, R. D. & Jasin, M. (2000) EMBO J. 19, 3398–3407. [DOI] [PMC free article] [PubMed] [Google Scholar]
- 8.Tsuzuki, T., Fujii, Y., Sakumi, K., Tominaga, Y., Nakao, K., Sekiguchi, M., Matsushiro, A., Yoshimura, Y. & Morita, T. (1996) Proc. Natl. Acad. Sci. USA 93, 6236–6240. [DOI] [PMC free article] [PubMed] [Google Scholar]
- 9.Lim, D. S. & Hasty, P. (1996) Mol. Cell. Biol. 16, 7133–7143. [DOI] [PMC free article] [PubMed] [Google Scholar]
- 10.Pittman, D. L. & Schimenti, J. C. (2000) Genesis 26, 167–173. [DOI] [PubMed] [Google Scholar]
- 11.Lasko, D., Cavenee, W. & Nordenskjold, M. (1991) Annu. Rev. Genet. 25, 281–314. [DOI] [PubMed] [Google Scholar]
- 12.Cooper, D. N., Krawczak, M. & Antonarakis, S. E. (1998) in The Genetic Basis of Human Cancer, eds. Vogelstein, B. & Kinzler, K. W. (McGraw–Hill, New York), pp. 65–95.
- 13.Moynahan, M. E. & Jasin, M. (1997) Proc. Natl. Acad. Sci. USA 94, 8988–8993. [DOI] [PMC free article] [PubMed] [Google Scholar]
- 14.Bishop, A. J. & Schiestl, R. H. (2000) Hum. Mol. Genet. 9, 2427–2434. [DOI] [PubMed] [Google Scholar]
- 15.Hellgren, D. (1992) Mutat. Res. 284, 37–51. [DOI] [PubMed] [Google Scholar]
- 16.Lambert, S., Saintigny, Y., Delacote, F., Amiot, F., Chaput, B., Lecomte, M., Huck, S., Bertrand, P. & Lopez, B. S. (1999) Mutat. Res. 433, 159–168. [DOI] [PubMed] [Google Scholar]
- 17.Liang, F., Han, M., Romanienko, P. J. & Jasin, M. (1998) Proc. Natl. Acad. Sci. USA 95, 5172–5177. [DOI] [PMC free article] [PubMed] [Google Scholar]
- 18.Moynahan, M. E., Chiu, J. W., Koller, B. H. & Jasin, M. (1999) Mol. Cell 4, 511–518. [DOI] [PubMed] [Google Scholar]
- 19.Bishop, A. J., Barlow, C., Wynshaw-Boris, A. J. & Schiestl, R. H. (2000) Cancer Res. 60, 395–399. [PubMed] [Google Scholar]
- 20.Moynahan, M. E., Pierce, A. J. & Jasin, M. (2001) Mol. Cell 7, 263–272. [DOI] [PubMed] [Google Scholar]
- 21.Elliott, B. & Jasin, M. (2001) Mol. Cell. Biol. 21, 2671–2682. [DOI] [PMC free article] [PubMed] [Google Scholar]
- 22.Saintigny, Y., Makienko, K., Swanson, C., Emond, M. J. & Monnat, R. J., Jr. (2002) Mol. Cell. Biol. 22, 6971–6978. [DOI] [PMC free article] [PubMed] [Google Scholar]
- 23.Tauchi, H., Kobayashi, J., Morishima, K., van Gent, D. C., Shiraishi, T., Verkaik, N. S., vanHeems, D., Ito, E., Nakamura, A., Sonoda, E., et al. (2002) Nature 420, 93–98. [DOI] [PubMed] [Google Scholar]
- 24.Murti, J. R., Bumbulis, M. & Schimenti, J. C. (1992) Mol. Cell. Biol. 12, 2545–2552. [DOI] [PMC free article] [PubMed] [Google Scholar]
- 25.Moynahan, M. E., Akgun, E. & Jasin, M. (1996) Hum. Mol. Genet. 5, 875–886. [DOI] [PubMed] [Google Scholar]
- 26.Mathis, L., Bonnerot, C., Puelles, L. & Nicolas, J. F. (1997) Development (Cambridge, U.K.) 124, 4089–4104. [DOI] [PubMed] [Google Scholar]
- 27.Friedberg, E. C. & Meira, L. B. (2000) Mutat. Res. 459, 243–274. [DOI] [PubMed] [Google Scholar]
- 28.Okabe, M., Ikawa, M., Kominami, K., Nakanishi, T. & Nishimune, Y. (1997) FEBS Lett. 407, 313–319. [DOI] [PubMed] [Google Scholar]
- 29.Shao, C., Deng, L., Henegariu, O., Liang, L., Raikwar, N., Sahota, A., Stambrook, P. J. & Tischfield, J. A. (1999) Proc. Natl. Acad. Sci. USA 96, 9230–9235. [DOI] [PMC free article] [PubMed] [Google Scholar]
- 30.Sobol, R. W., Horton, J. K., Kuhn, R., Gu, H., Singhal, R. K., Prasad, R., Rajewsky, K. & Wilson, S. H. (1996) Nature 379, 183–186. [DOI] [PubMed] [Google Scholar]
- 31.Luria, S. E. & Delbruck, M. (1943) Genetics 28, 491–511. [DOI] [PMC free article] [PubMed] [Google Scholar]
- 32.Rosche, W. A. & Foster, P. L. (2000) Methods 20, 4–17. [DOI] [PMC free article] [PubMed] [Google Scholar]
- 33.Ausubel, F. M., Brent, R., Kingston, R. E., Moore, D. D., Siedman, J. G., Smith, J. A. & Struhl, K. (1995) Current Protocols in Molecular Biology (Wiley, New York).
- 34.Dopf, J. & Horiagon, T. M. (1996) Gene 173, 39–44. [DOI] [PubMed] [Google Scholar]
- 35.Liskay, R. M., Stachelek, J. L. & Letsou, A. (1984) Cold Spring Harbor Symp. Quant. Biol. 49, 183–189. [DOI] [PubMed] [Google Scholar]
- 36.Johnson, R. D. & Jasin, M. (2001) Biochem. Soc. Trans. 29, 196–201. [DOI] [PubMed] [Google Scholar]
- 37.Lovett, S. T., Drapkin, P. T., Sutera, V. A., Jr., & Gluckman-Peskind, T. J. (1993) Genetics 135, 631–642. [DOI] [PMC free article] [PubMed] [Google Scholar]
- 38.Bzymek, M. & Lovett, S. T. (2001) Proc. Natl. Acad. Sci. USA 98, 8319–8325. [DOI] [PMC free article] [PubMed] [Google Scholar]
- 39.Ivanov, E. L., Sugawara, N., Fishman-Lobell, J. & Haber, J. E. (1996) Genetics 142, 693–704. [DOI] [PMC free article] [PubMed] [Google Scholar]
- 40.Stringer, J. R., Kuhn, R. M., Newman, J. L. & Meade, J. C. (1985) Mol. Cell. Biol. 5, 2613–2622. [DOI] [PMC free article] [PubMed] [Google Scholar]
- 41.Bollag, R. J. & Liskay, R. M. (1988) Genetics 119, 161–169. [DOI] [PMC free article] [PubMed] [Google Scholar]
- 42.Bollag, R. J. & Liskay, R. M. (1991) Mol. Cell. Biol. 11, 4839–4845. [DOI] [PMC free article] [PubMed] [Google Scholar]
- 43.Godwin, A. R. & Liskay, R. M. (1994) Genetics 136, 607–617. [DOI] [PMC free article] [PubMed] [Google Scholar]
- 44.Hellgren, D., Sahlen, S. & Lambert, B. (1990) Mutat. Res. 243, 75–80. [DOI] [PubMed] [Google Scholar]
- 45.Essers, J., van Steeg, H., de Wit, J., Swagemakers, S. M. A., Vermeij, M., Hoeijmakers, J. H. J. & Kanaar, R. (2000) EMBO J. 19, 1703–1710. [DOI] [PMC free article] [PubMed] [Google Scholar]
- 46.Russell, L. B., Selby, P. B., von Halle, E., Sheridan, W. & Valcovic, L. (1981) Mutat. Res. 86, 355–379. [DOI] [PubMed] [Google Scholar]
- 47.Schiestl, R. H., Aubrecht, J., Khogali, F. & Carls, N. (1997) Proc. Natl. Acad. Sci. USA 94, 4576–4581. [DOI] [PMC free article] [PubMed] [Google Scholar]
- 48.Jalili, T., Murthy, G. G. & Schiestl, R. H. (1998) Cancer Res. 58, 2633–2688. [PubMed] [Google Scholar]
- 49.Lebel, M. (2002) Carcinogenesis 23, 213–216. [DOI] [PubMed] [Google Scholar]
- 50.Engle, S. J., Stockelman, M. G., Chen, J., Boivin, G., Yum, M. N., Davies, P. M., Ying, M. Y., Sahota, A., Simmonds, H. A., Stambrook, P. J. & Tischfield, J. A. (1996) Proc. Natl. Acad. Sci. USA 93, 5307–5312. [DOI] [PMC free article] [PubMed] [Google Scholar]
- 51.Wijnhoven, S. W., Van Sloun, P. P., Kool, H. J., Weeda, G., Slater, R., Lohman, P. H., van Zeeland, A. A. & Vrieling, H. (1998) Proc. Natl. Acad. Sci. USA 95, 13759–13764. [DOI] [PMC free article] [PubMed] [Google Scholar]
- 52.Van Sloun, P. P., Wijnhoven, S. W., Kool, H. J., Slater, R., Weeda, G., van Zeeland, A. A., Lohman, P. H. & Vrieling, H. (1998) Nucleic Acids Res. 26, 4888–4894. [DOI] [PMC free article] [PubMed] [Google Scholar]
- 53.Hellgren, D., Sahlen, S. & Lambert, B. (1989) Mutat. Res. 226, 1–8. [DOI] [PubMed] [Google Scholar]
- 54.Gebow, D., Miselis, N. & Liber, H. L. (2000) Mol. Cell. Biol. 20, 4028–4035. [DOI] [PMC free article] [PubMed] [Google Scholar]
- 55.Zhou, Z. H., Akgun, E. & Jasin, M. (2001) Proc. Natl. Acad. Sci. USA 98, 8326–8333. [DOI] [PMC free article] [PubMed] [Google Scholar]
- 56.Dronkert, M. L., Beverloo, H. B., Johnson, R. D., Hoeijmakers, J. H., Jasin, M. & Kanaar, R. (2000) Mol. Cell. Biol. 20, 3147–3156. [DOI] [PMC free article] [PubMed] [Google Scholar]


