Abstract
Leaf expansion in the fast-growing tree, Populus × euramericana was stimulated by elevated [CO2] in a closed-canopy forest plantation, exposed using a free air CO2 enrichment technique enabling long-term experimentation in field conditions. The effects of elevated [CO2] over time were characterized and related to the leaf plastochron index (LPI), and showed that leaf expansion was stimulated at very early (LPI, 0–3) and late (LPI, 6–8) stages in development. Early and late effects of elevated [CO2] were largely the result of increased cell expansion and increased cell production, respectively. Spatial effects of elevated [CO2] were also marked and increased final leaf size resulted from an effect on leaf area, but not leaf length, demonstrating changed leaf shape in response to [CO2]. Leaves exhibited a basipetal gradient of leaf development, investigated by defining seven interveinal areas, with growth ceasing first at the leaf tip. Interestingly, and in contrast to other reports, no spatial differences in epidermal cell size were apparent across the lamina, whereas a clear basipetal gradient in cell production rate was found. These data suggest that the rate and timing of cell production was more important in determining leaf shape, given the constant cell size across the leaf lamina. The effect of elevated [CO2] imposed on this developmental gradient suggested that leaf cell production continued longer in elevated [CO2] and that basal increases in cell production rate were also more important than altered cell expansion for increased final leaf size and altered leaf shape in elevated [CO2].
Given the importance of forests for global bioproductivity, the consequences of increased atmospheric [CO2] for the global carbon cycle are potentially extremely large (Malhi et al., 1999). Despite this, there are still relatively few large-scale, long-term experiments from which predictions about likely forest responses can be made. Few studies have been completed where trees are allowed to develop to canopy closure and where a “stable” response to [CO2] is likely. Determining the response of leaf area development to elevated [CO2] is important. It is still unknown whether forests of the future will maintain a higher leaf area index (LAI), as implied from small-tree studies (Ceulemans et al., 1997) or whether the long-term (decades) responses will be reduced allocation to foliage and lower LAI, as suggested by some modeling approaches (Medlyn and Dewar, 1996) or involve acclimation to limited nitrogen (Oren et al., 2001).
Leaf growth is often stimulated in short-term response to elevated [CO2] (Taylor et al., 1994; Pritchard et al., 1999), and both leaf cell expansion and cell production are sensitive to [CO2] (Taylor et al., 1994). It is likely that these processes respond to additional carbohydrate from photosynthesis and, as such, altered atmospheric [CO2] provides a critical insight into how carbon regulates plant development and growth (Masle, 2000). The importance of leaf development cannot be overstated, and in poplar (Populus spp.), as in other species, the rapid development of large leaves is an important determinant of productivity (Ridge et al., 1986; Barigah et al., 1994). In addition, Populus is very quickly becoming recognized as the “model” forest tree, equivalent to Arabidopsis (Taylor, 2002), because it is one of a few woody species where transformation is routine (Rottmann et al., 2000), where a large genomic initiative with several thousand expressed sequence tags is already developed (Sterky et al., 1998), and where the complete physical sequence of the genome will be completed within the next 2 years, as described by Wullschleger et al. (2002).
No data are available on the detailed spatial effects of [CO2] on leaf development, cell expansion, and cell production. The way in which cell expansion and cell production are thought to interact in the control of leaf growth rate and final leaf size is the subject of on-going speculation. In a detailed analysis of sunflower (Helianthus annuus) leaf growth, Granier and Tardieu (1998) showed that epidermal cell expansion and production rates were determined spatially, with smaller cells produced at the base of the leaf, associated with rapid rates of cell production. In contrast, Donnelly et al. (1999) showed that few spatial restraints on cell expansion were apparent in leaf growth of Arabidopsis. Overall morphogenetic constraints on leaf growth seem to regulate final leaf area synchronously with environmental factors (Van Volkenburgh, 1999), and there is great interest in determining how environmental conditions might affect the processes of cell division (Cockcroft et al., 2000) and cell expansion (Rose et al., 2000) at the various stages of development (Fiorani et al., 2000). Increase in growth has been associated with increased cell production rates (Beemster and Baskin, 1998), and further analysis of the cell division process may support evidence for its significance in growth and morphogenesis (Wang et al., 2000) or agree with predictions that it acts merely as a “marker” for growth (Hemerly et al., 1999). In contrast, cell expansion, determined at the primary cell wall by loosening and reassembly, generates substantial growth in all plants (Cosgrove, 1999). For now, the mechanisms involved are not fully understood, and the evidence for a relationship between the processes of cell division and expansion is unclear, suggesting differences between species (Vernoux et al., 2000) and in response to contrasting environmental stimuli.
The aim of the work reported here was to quantify for the first time, to our knowledge, the effects of elevated [CO2] on spatial and temporal patterns of leaf development and to determine the relevance of cell production and cell expansion for final leaf size and shape. This was achieved using a realistic field (free air CO2 enrichment [FACE]) exposure, as the canopy closed in this fast-growing forest plantation.
RESULTS
Temporal Effects of Elevated [CO2] on Leaf Growth in Populus × euramericana
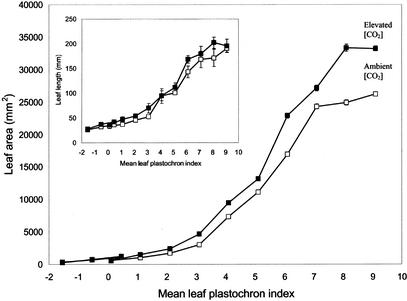
Leaf growth was rapid in both elevated (550 μmol mol−1) and ambient [CO2] (approximately 370 μmol mol−1). All measured leaves had reached their maximum size within 20 d. Minimum measured leaf plastochron index (LPI) was −1.54, maximum was 9.11, and the mean LPI of leaf n (Ln) was 0.57. Leaf length increased by an average of 700% and area by an average of 900%, and increases in area were highly significant with each increment in leaf developmental age (Fig. 1). Interestingly, and in accordance with PI measurements, leaf length was not enhanced by elevated [CO2] (Fig. 1, inset). In contrast, leaf area was significantly increased by the CO2 treatment, and this was particularly apparent at LPIs 5 to 9. This resulted in a mean final individual leaf area that was increased by more than 26% in elevated compared with ambient [CO2], a similar overall enhancement to that recorded in these trees in 1999, in an open canopy (Ferris et al., 2001).
Figure 1.
Increase in leaf area and length (inset) of P. × euramericana from either ambient (□) or elevated (▪) [CO2] (550 μmol mol−1) with age (LPI). Data points are means ± se of nine leaves at each concentration [CO2] at each stage.
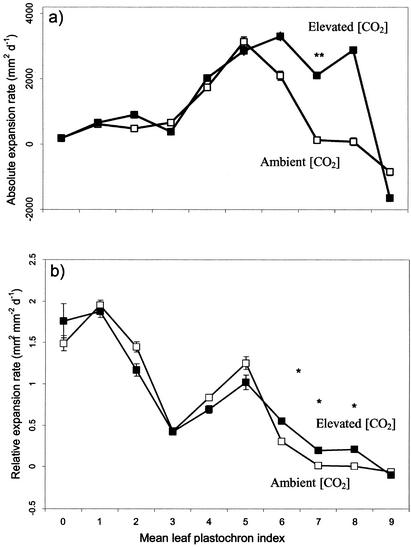
Leaf size was increased by elevated [CO2] as a result of a stimulation in growth rate (Table I), an effect that was apparent for both young (LPI 3) and older (LPI 6–8) leaves (Fig. 2). This effect was only statistically significant for absolute leaf expansion rate (square millimeters per day) and relative leaf expansion rate (per day) in the latter stages of leaf development (Fig. 2). Despite this, Figure 2 also showed that growth of very young leaves (less than LPI 1 and at LPI 3) was probably stimulated by elevated [CO2] as indicated by the relative expansion rates for LPI 0.
Table I.
Spatial and temporal effects of elevated [CO2] (550 μmol mol−1) on leaf growth of P. × euramericana at contrasting LPI
| Leaf Age | Mean Leaf Area | Absolute Leaf Expansion Rate | Relative Leaf Expansion Rate | Leaf Thickness | Epidermal Cell Area | Epidermal Cell Number | Spongy Mesophyll Cell Area | Palisade Cell Area | Cell Production Rate |
|---|---|---|---|---|---|---|---|---|---|
| 103 mm2 | mm2 d−1 | d−1 | μm | μm2 | 106 leaf−1 | μm2 | μm2 | d−1 | |
| LPI 3 (after 5 d) | |||||||||
| Ambient [CO2] | 1 | 617 | 1.95 | 141 | 18 | 133 | 42 | 42 | 3.02 |
| Elevated [CO2] | 1.5 ** | 659 | 1.87 | 135 | 34*** | 88** | 63 | 72 | 1.87 |
| LPI 8 (after 13 d) | |||||||||
| Ambient [CO2] | 25 | 87 | 0.01 | 155 | 221 | 155 | 106 | 105 | 0.58 |
| Elevated [CO2] | 33 * | 289** | 0.21 | 160 | 206 | 200*** | 153 | 190*** | 19.7*** |
| Summary of Analysis of Variance | |||||||||
| CO2 | *** | * | ns | ns | ns | ns | ** | *** | *** |
| LPI | *** | ns | ns | *** | *** | *** | *** | *** | *** |
| CO2 × LPI | ** | * | ns | ns | * | *** | ns | * | *** |
Results are the mean values of nine leaves at each stage from each concentration [CO2]. *, **, and ***, Significant at the <0.05, <0.01, and <0.001 levels of probability; ns, not significant. Significance of post-hoc comparisons for elevated [CO2] is shown where a significant interaction with LPI was found
Figure 2.
Expansion rates of P. × euramericana leaves from either ambient (□) or elevated (▪) [CO2] (550 μmol mol−1) with age. a, Absolute expansion rate (mm2 d−1); b, relative expansion rate (mm2 mm−2 d−1). Data points are means ± se of nine leaves at each concentration [CO2] at each LPI. The results of a one-way ANOVA are indicated where significant: *, P < 0.05; **, P < 0.01; and ***, P < 0.001.
Spatial Effects of Elevated [CO2] on Leaf Growth
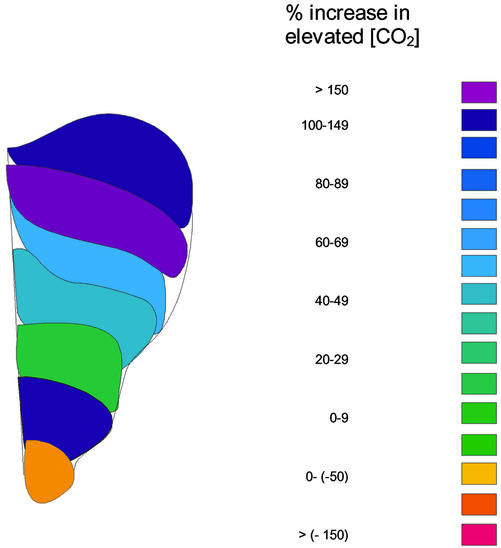
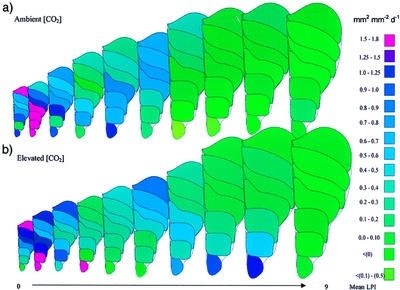
Spatial patterns of leaf growth were also quantified and revealed a characteristic basipetal gradient in expansion rate across the lamina with a stimulatory effect of [CO2] particularly marked toward the basal areas of the leaf (Fig. 3), suggesting the mechanism for the altered leaf shape proposed from data in Figure 1. Over the full course of development, relative expansion rates for each leaf interveinal area show that spatial effects of elevated [CO2] are also suggested, although these were more complex (Fig. 4). For young leaves (LPI 0) stimulations in basal relative expansion (interveinal area 1) were apparent, whereas for older leaves, the whole lamina appeared sensitive to elevated [CO2].
Figure 3.
Schematic representation of the effect of elevated [CO2] (550 μmol mol−1) on the absolute spatial expansion rates (mm2 d−1), calculated as (elevated − ambient)/ambient × 100, for P. × euramericana leaves, after exposure to either ambient or elevated [CO2] (550 μmol mol−1). Data represent the mean spatial values for nine leaves.
Figure 4.
Schematic representation of relative spatial expansion rates (mm2 mm−2 d−1) at each interveinal area of a P. × euramericana leaf from either ambient (a) or elevated (b) [CO2] (550 μmol mol−1) at each developmental age. Data are means of nine leaves at each [CO2] at each developmental stage.
Temporal and Spatial Cellular Leaf Growth
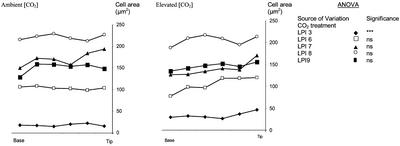
Cell area (μm2) was small at LPI 3 (Table I) but expanded rapidly—approximately 9-fold—over the successive five leaf age increments in both ambient and elevated [CO2]. Mean (± se) epidermal cell area was significantly enhanced in young leaves grown at elevated [CO2] (34 μm2 ±4.3) compared with those from ambient [CO2] (18 μm2 ±3.3). There was, however, no significant effect of elevated [CO2] on mature epidermal cell area. At maximum size, mean epidermal cell area in the elevated [CO2] treatment was 206 μm2 (±6.2) and slightly higher in ambient [CO2] at 221 μm2 (±14.5). At the final LPI, epidermal cell area decreased in both treatments. In contrast, epidermal cell number increased only slowly in leaves grown in ambient [CO2] and much faster in leaves grown in elevated [CO2], so that over a 9-d period, cell number increased by approximately 16% in ambient [CO2] and by over 126% in elevated [CO2]. Interaction between [CO2] treatment and leaf age had a highly significant impact on epidermal cell number (P = <0.001) but not area (P = 0.052).
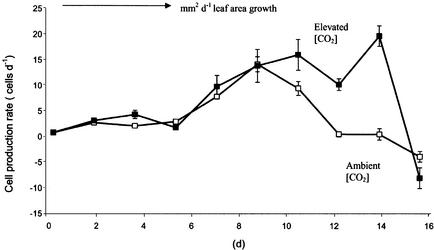
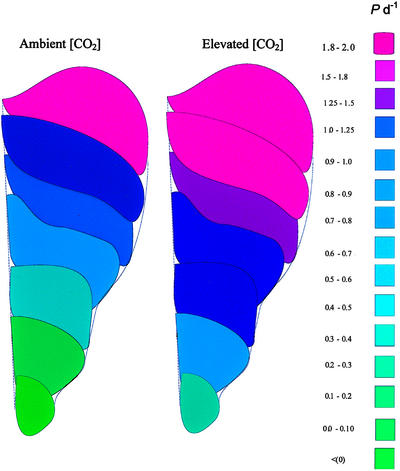
There was no significant variation in cell area across the interveinal areas of the leaf at any stage of development, with a constant epidermal cell size observed from leaf tip to leaf base for each LPI, although cell size increased progressively as the leaves aged (Fig. 5). The [CO2] treatment stimulated epidermal cell size for young, LPI 3 leaves (confirming the data of Table I), but there was no evidence of any effect on the spatial patterns of cell expansion across the lamina. Cell production rate (P per day) in leaves grown in both ambient and elevated [CO2] increased gradually in the early phase of development, but the rate began to slow earlier in ambient than in elevated [CO2] (Fig. 6). There was no effect of elevated [CO2] on measured leaf thickness (Table I), a result that agreed with the measurement of specific leaf area (data not shown), but the cells of spongy mesophyll and palisade tissues were significantly larger in the elevated [CO2] in both stages of development. This is an interesting observation, because at LPI 8, epidermal cells were equivalent in both ambient and elevated [CO2]. The effects of elevated [CO2] on cell expansion were further investigated for LPI 3 and LPI 6 leaves that were subjected to an Instron analysis (Taylor et al., 1994) for assessment of cell wall extensibility. This analysis showed (Table II) that young leaves had significantly higher cell wall extensibility in elevated compared with ambient [CO2] but that this effect was not apparent for the older leaves. Spatial patterns of cell production rate (P) showed a clear basipetal trend for both levels of [CO2] (Fig. 7), whereas the effects of elevated [CO2] throughout the development of the leaves were often most pronounced in interveinal area 2, close to the leaf base.
Figure 5.
Distribution of cell areas from the base to the tip of a P. × euramericana leaf. Data are means from 10 cells each at each interveinal area from nine leaves per treatment. The results of one-way ANOVA for each LPI are also given where: *, P < 0.05; **, P < 0.01; and ***, P < 0.001.
Figure 6.
Cell production rate (P) of leaves from either ambient (□) or elevated (▪) [CO2] (550 μmol mol−1) treatment. Data are means ± se from 20 cells, each from nine leaves per treatment at five growth stages.
Table II.
Cell wall extensibility in P. × euramericana at contrasting LPI in ambient and elevated [CO2] − 550 μmol m−2 s−1
| Leaf Age | Plasticity |
|---|---|
| % 10 mol−1 | |
| LPI 3 (after 5 d) | |
| Ambient [CO2] | 6.24 (±1.3) |
| Elevated [CO2] | 17.1 (±3.8) |
| LPI 6 (after 10 d) | |
| Ambient [CO2] | 25.3 (±8.8) |
| Elevated [CO2] | 25.0 (±6.0) |
Results are the mean values of nine leaves at each stage from each [CO2].
Figure 7.
Schematic representation of cell production rate (P) at each interveinal area of a P. × euramericana leaf from either ambient or elevated [CO2] (550 μmol mol−1) treatment. Data are means from nine leaves per treatment over all stages of development at each interveinal area.
DISCUSSION
The development of leaves of P. × euramericana was extremely sensitive to atmospheric [CO2]. Leaves were larger in response to the elevated [CO2] treatment. This is one of the most consistent effects of elevated [CO2] (Taylor et al., 2001), although exceptions do exist, for example in the study of Masle (2000) where limited effects of [CO2] on final leaf size were apparent. Here, we have shown clearly that leaf shape is sensitive to [CO2] and most importantly, have identified the spatial and temporal patterns of cell production and expansion that explain this effect. The determination of leaf size and shape in dicotyledonous leaves is complex. For P. × euramericana, a basipetal growth gradient similar to those reported by Maksymowych (1973) and Schmundt et al. (1998) was seen. We have also shown clearly that epidermal cell size remained constant across the lamina, within each developmental stage, with the implication that spatial patterns of lamina growth must be largely driven by the timing and rate of leaf cell production. Basipetal growth gradients for dicotyledonous leaves are well established, for example, in sunflower (Granier and Tardieu, 1998) and Arabidopsis (Donnelly et al., 1999). In both, cell analysis suggested spatial differences in epidermal cell size, such that spatial control of lamina expansion was determined by a combination of cell production and expansion. A very striking gradient of cell cycle activity was characterized by Donnelly et al. (1999) using a β-glucuronidase reporter in wild-type plants for the cyclin1 (cyc1At) gene. This is known to act at the checkpoint between G2/M and revealed increased cell cycle activity in the basal areas of expanding Arabidopsis leaves, lending support to the findings for sunflower. This type of “compensatory” growth is consistent with the notion that cell production and cell expansion act together in a coordinated manner to determine leaf size and shape. Research on mutants has also confirmed the importance of both cell production rate and cell expansion (Tsuge et al., 1996; Kim et al., 2002) for determination of leaf size and shape. For poplar, it would appear that cell size is tightly regulated across the lamina, implying that the relative importance of cell production and expansion varies among species and is under genetic control. In their work with Poa spp., Fiorani et al. (2000) found dissimilarity even in two species of the same genus.
Both processes of cell expansion and production were sensitive to elevated [CO2] and contributed to the stimulation of leaf area observed in P. × euramericana. However, effects of [CO2] on epidermal cell expansion appeared transitory and were only significant for very young leaves, suggesting that the contribution through this mechanism to increased leaf growth was limited to a specific time in development and was unaltered spatially across the lamina. There was no suggestion of a spatial effect of elevated [CO2] on leaf cell expansion, because cell size across the lamina remained constant irrespective of [CO2]. This limited temporal stimulation of cell expansion is in contrast to a number of other reports where leaf cell expansion has appeared extremely sensitive to [CO2], including our own research on poplar (Gardner et al., 1995; Ferris et al., 2001) and where it has recently been possible to identify quantitative trait loci for leaf cell size in response to elevated [CO2] (Ferris et al., 2002). Increased leaf cell expansion was related to a stimulation in cell wall loosening (Ranasinghe and Taylor, 1996; Ferris et al., 2001). In general, it seems likely that both processes of cell production and expansion are sensitive to the supply of CO2, but their influence on leaf size and shape varies depending on species and other environmental conditions. Pien et al. (2001) have suggested a link between carbon supply, cell wall loosening, and leaf cell expansion in the alteration of leaf shape, and such a mechanism could be operating here. Cell expansion was clearly altered at one time by elevated [CO2] for young leaves, but there was no evidence that this effect persisted and was responsible for altered leaf shape. Rather, this appears to be driven by leaf cell production, and this is an important finding. Cell cycle events are sensitive to the carbon status of cells, and we hypothesize a direct role for Suc in stimulating cell cycle, given that the activities of d-type cyclins are regulated by Suc availability (Riou-Khamlichi et al., 2000), probably varying in response to [CO2], but this does not explain adequately how distinct spatial patterns of cell production are maintained across the lamina. Such control is likely to involve different signaling pathways and the possibility of plant hormones interacting with C status would seem likely. Ljung et al. (2001) have shown that indole-3-acetic acid could fulfill such a role in developing leaves because a basipetal gradient that appears to be highly correlated with cell cycle activity in the concentration of this hormone is apparent. Interaction between cell cycle and other plant hormones is also likely, particularly cytokinins where leaf cell production was reduced by 97% in cytokinin-deficient plants (Werner et al., 2001).
Limited increase in epidermal cell area in young leaves was also in contrast to the responses of spongy mesophyll cell areas that continued to respond to [CO2] even for older (LPI 8) leaves, when development was almost complete (Table I). Donnelly et al. (1999) showed that patterns of cell expansion were organized differently in different leaf tissues and that prolonged expansion of mesophyll tissue was explained by the prolonged duration of cell cycling in this tissue compared with the earlier cessation of cell cycling in the epidermis. If such a pattern is repeated in poplar, it suggests that for the LPI 8 leaves, cell expansion had slowed in epidermal cells, with no effect of elevated [CO2], whereas for underlying tissue, expansion was still active, contributing to leaf thickness and where increased [CO2] continued to stimulate cell growth. Despite this, in the later stages of leaf development, the early decrease in cell production rate under ambient [CO2] conditions served to limit overall leaf growth and suggested an inhibition of the cell cycle not present to the same degree in elevated [CO2]. As cell production continued for several days beyond the inflection point in both sets of leaves, a complete block of all cells at the transition between cell cycle phases that would cause cell production to cease in 3 to 6 h was extremely unlikely (Francis and Halford, 1995). In their study of plants expressing the ICK1 cyclin-dependent kinase inhibitor (KRP1), Wang et al. (2000) found that leaf shape was substantially altered, and in their review, Mironov et al. (1999) have described how cyclins, cyclin-dependent kinases, and their activities qualitatively influence cell cycle at different phases. Cyclin-dependent kinases are good candidates for causing the types of change in cell production rates seen here. Strong evidence for the constancy of cell division rates within tissues (Granier et al., 2000; Baskin, 2000) implies that the number of cells dividing is more changeable than the rate of that division in calculating P. The different leaf cell production rate in elevated [CO2] seen here suggests that the number of cells entering the cell cycle is progressively decreased sooner in ambient than elevated [CO2].
In summary, we have shown that leaf area development was stimulated in a closed-canopy forest following long-term exposure to elevated [CO2]. For P. × euramericana, increased leaf expansion in response to elevated [CO2] involved a temporal stimulation of cell expansion and a highly spatial stimulation of cell production that resulted in enhanced leaf size and altered leaf shape.
MATERIALS AND METHODS
Site and Growth Conditions
The experimental plantation and FACE facility is located in Central Italy, near the city of Tuscania (province of Viterbo, latitude 42°37′04" N, longitude 11°80′87" E, altitude 150 m). The 9-ha plantation was planted with cuttings of three different poplar (Populus spp.) during the spring of 1999. The species were: Populus alba (clone 2AS-11), Populus nigra (clone Jean Pourtet) and the hybrid, Populus × euramericana (Populus deltoides × P. nigra, clone I-214). Within the plantation, six 314-m2 plots were treated either with atmospheric (three plots) or enriched (550 μmol mol−1) CO2 concentration via octagonal-shaped FACE rings (three plots). Details of this system and performance are described by Miglietta et al. (2001).
Detailed measurements on the spatial and temporal development of P. × euramericana leaves were conducted between 1 and 16 July 2000 when canopy closure had been achieved but main stem leaves were not shaded and leaves had not fallen. The entire area and all of the plants were drip irrigated. The mean long-term CO2 concentrations in the three FACE plots varied by less than 5 μmol mol−1, with the mean daily values of [CO2] for the majority of cases within a few micromoles per mole from the target. Details of these exposures are given by Miglietta et al. (2001) and Taylor et al. (2001) for years 1 and 2 of exposure, respectively. Meteorological data for the region were collected at 30-min intervals, and during the sampling period, mean air temperature measured 20°C (±5°C), reaching a maximum of 31°C. Precipitation was 14 mm with 10 mm falling on July 11, 2000, and mean relative humidity measured 73% (±18%). Average wind speed was 2.5 m s−1 (±1.6), reaching a maximum of 8.1 m s−1. Global radiation was 24 × 103 kJ m−2 d−1 (±599) and mean photosynthetically active radiation was 11 × 103 kJ m−2 d−1 (±269).
The Plastochron Index (PI) and LPI
The PI was calculated using the formula below (Erickson and Michelini, 1957)
 |
where Ln+1 was the length (millimeters) of a leaf just shorter than 30 mm and Ln was the length of the next leaf that was longer than 30 mm. n was the serial number of leaf. A reference length of 30 mm was found to be appropriate for this species. The PI was therefore equivalent to the distance in time between two successive leaves reaching 30 mm. Data for PI are not shown but were used to calculate LPI.
Ten main stem leaves, closest to the tree apex and in complete full sun, of three P. × euramericana trees chosen from within one sector of each plot, avoiding guard rows, were labeled in accordance with the PI system (Erickson and Michelini, 1957) from Ln+1 to Ln − 8, where n was defined as the leaf with length equivalent or closest to 30 mm (the “reference length” as given above). The 10 chosen leaves represented the full range of development from extremely young to fully mature lamina. The lengths of leaves Ln+1 (the first leaf of length shorter than the reference length) and Ln were measured, and a reference length of 30 mm was established for calculation of PI as above. The same leaves were measured for length again after an interval averaging 2.2 d. Subsequent calculation of LPI meant that a leaf exactly 30 mm long would have an LPI of 0 on the first date measured
 |
where a was the serial number of the chosen leaf. PI was calculated for each of the 180 labeled leaves, one-way ANOVA was performed both within and between [CO2] treatments, and no significant differences were found (data not shown). The number of days per increment in LPI (LPId) was calculated using the equation
 |
where Ln0 was the first measured LPI of Ln, Lni the second measured LPI of Ln, and d the number of days between measurements.
Spatial and Temporal Development of Leaf Area
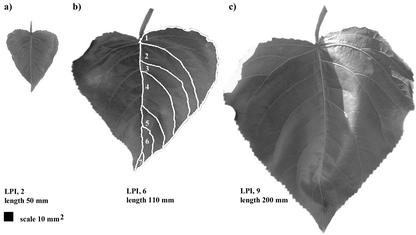
Digital images of the 10 leaves at contrasting stages of development were taken flat against a white background (with marked scale) using a digital camera (Coolpix 950, Nikon UK Ltd, Kingston-upon-Thames, UK) and then retaken 3 to 5 d later (for full description, see Ferris et al., 2001). Images were imported into an image processing and analysis program (Scion Image, Scion Corporation, Frederick, MD) for resizing and format conversion. Spatial and temporal leaf development was assessed using these images, where seven interveinal areas were visibly outlined by major leaf veins (see Fig. 8) that were labeled from 1 to 7 in series from the base to the tip of the leaf. CorelDraw (v9.0, Coral Corporation, Ottawa) was used for color mapping of these spatial data across the lamina of leaves at each developmental time point.
Figure 8.
Leaves of P. × euramericana at LPI 2 (a), LPI 6 (b), and LPI 9 (c) and showing the leaf divided into spatial areas (b) for measurements of absolute and relative spatial expansion rates.
Absolute expansion rate of leaves (square millimeters per day) was calculated using the equation
 |
where Ai and Ao were the second and first areas (square millimeters) measured and d the number of days between measurements. Relative expansion rate (square millimeters per square millimeter per day) was calculated as
 |
Absolute and relative expansion rates were also calculated for each interveinal area. These are referred to as “spatial” absolute and relative expansion rates. Mean spatial expansion rate was calculated as the mean of absolute spatial expansion rates (square millimeters per day) over the full period of development for each interveinal area. Mean spatial expansion rates (square millimeters per day) were plotted against interveinal areas from the base to the tip of the leaf.
Measurement of Epidermal Cell Size and Number
While trees were labeled for leaf growth analysis, a further three P. × euramericana trees chosen from one sector of each experimental plot, excluding guard rows, were labeled for cell growth analysis. Once again, the topmost 10 leaves of main stems were labeled in series down the tree from Ln+1 (smallest, <30 mm length) to Ln−8 (> 200 mm length) so as to correspond with the leaf area samples. These leaves were cut from the tree, and petioles were immediately recut under water within a polythene bag to prevent dehydration. Each leaf was then cut longitudinally into two halves. The first leaf half was taken, excess moisture blotted off, and interveinal areas were labeled from 1 to 7 from the base to the tip of each leaf. A small area of adaxial tissue within each of these interveinal sections was painted with nail varnish and left to dry for 15 to 25 min. The seventh interveinal area was not always clear under these conditions and no samples were taken. The leaf imprint was removed from the leaf by placing a piece of “sellotape” over the dried varnish, and pressure was applied to obtain an imprint, which was mounted onto a microscope slide (Gardner et al., 1995). Images of the epidermal cell area were taken using a digital camera attached to the microscope. Cells in these images were traced and imported into Scion Image, and the areas of 10 cells measured per leaf and three leaves per plot were used for analysis. Epidermal cell numbers per leaf were estimated by dividing leaf area by average epidermal cell area. Throughout the analysis, the assumption was made that the epidermal cell layer acts as the cell layer limiting growth, as reported by Kutschera (1992) for stems and coleoptiles and by Thompson et al. (1998) for tomato (Lycopersicon esculentum) fruit growth.
Measurement of Cell Wall Extensibility
Half-leaves from those sampled for epidermal cell impressions were placed immediately at the field site into 70% (v/v) methanol. This sampling, as for that of epidermal cell impressions was undertaken on a single occasion between 2 and 3 pm (GMT), to ensure diurnal changes in cell wall properties were minimized (Taylor and Davies, 1985). Once in methanol, samples were stored at a temperature of 5°C. Five months after sampling, leaf halves were rehydrated in distilled water for exactly 20 min, with fresh water replaced after 10 min. During this rehydration samples were kept on an orbital shaker on the lowest setting (LH Engineering Co., Ltd., Stoke Poges, UK). After rehydration, the leaf was mounted in distilled water on a glass plate, and a strip of tissue (3 × 5 mm) from the basal area cut from each leaf. As described by Ferris et al. (2001), the leaf strips were attached by brass clamps to an Instron apparatus and stretched twice to give a value of percentage plasticity (% P, the percentage plasticity per 10 g load), analogous to the “cell wall extensibility-Wex” defined by Van Volkenburgh et al. (1983).
Preparation of Transverse Sections
Leaf sections (10 mm2) from the base of nine leaves of P. × euramericana at LPI 3 and LPI 8, were placed initially in fixative (formalin:glacial acetic acid:70% [v/v] ethanol [1:1:18, v/v]). For light microscopy, the discs were cut into 1- to 2-mm squares and fixed in buffered osmium tetroxide, to increase contrast. The specimens were then rinsed in 0.1 m PIPES buffer, dehydrated in an ethanol series, cut into 1-mm squares, and embedded in TAAB resin (TAAB Laboratories, Aldermaston, UK) in the normal way. Then 0.5-μm sections were cut on an OMU 3 Ultramicrotome (Leica Microsystems, Milton Keynes, UK) and stained with 1% (v/v) toluidine blue in 1% (v/v) borax. Images were captured at ×400 magnification using a digital camera attached to a light microscope. The area of the spongy mesophyll (square micrometers) and palisade parenchyma cells (square micrometers) and leaf thickness (millimeters) were obtained and measured using Scion Image.
Cell Production Rate
The calculation of cell production rate (P) interpreted work by Fiorani et al. (2000) who analyzed growth of four Poa spp. In a monocotyledonous species like Poa spp., under steady-state growth conditions, the number of cells entering the elongation-only zone is equal to the number of cells displaced from the zone where they have reached mature length. P (cells produced per cell per unit time) can therefore be defined as
 |
where LER is leaf elongation rate and lm is the mature length of cells (Fiorani et al., 2000). In a dicot such as poplar, growth is multidimensional and not limited by zone. However, two-dimensional mature cell area could be determined empirically here, and at the final measured LPI, cell area declined. It could therefore be shown that cell area did not increase beyond the penultimate measurement point and that, thereafter, cells were effectively “displaced” in both dimensions, i.e. no longer formed part of an increase in leaf area. The equation could therefore be modified for these P. × euramericana leaves so that
 |
where P was cell production rate, ASER was absolute spatial expansion rate (square millimeters per day) and cm was the mature area of cells (square micrometers). Mean leaf area (square millimeters × 106) at each LPI was divided by mean cell area (square micrometers) in each interveinal area at the corresponding developmental age to calculate mean cell number for each interveinal area at each LPI. Whole-leaf mean cell numbers could then also be determined.
Statistical Analysis
The data were analyzed using the statistical software packages Minitab 12.0 for Windows (Minitab Inc., Philadelphia). ANOVA custom factorial block design was used, with [CO2] and LPI both fixed factors and block a random but untested source of variation in the model (Sokal and Rohlf, 1981). Averages were based on leaves from between nine and 12 trees per treatment, where “tree” was considered as the unit of replication. Pseudoreplication was avoided for cell data by taking averages at the leaf (tree) level before statistical treatment. Some measured and calculated values were analyzed for statistical significance with a one-way ANOVA at each data point because of lack of independent data for a full factorial analysis. Bartlett's and Levene's tests were conducted for homogeneity of variance and post-hoc Dunnett's tests applied where appropriate. Significant effects are shown as *, P < 0.05; **, P < 0.01; and ***, P < 0.001.
ACKNOWLEDGMENTS
We thank Dr. A. Page (Biomedical Imaging Unit) for help in preparing the leaf sections and Dr. R. Ferris for help with the analysis of PI data.
Footnotes
This work was supported by the EC through its Environment R and D program within the Fourth Framework as research contract ENV4–CT97–0657 (POPFACE) coordinated by the University of Viterbo and by Natural Environment Research Council and Department of Environment, Food and Rural Affairs (grant nos. GR9/04077 and NFO410 to GT). P.J.T. was awarded a research studentship from the Natural Environment Research Council (no. GT04/99/TS250). This study also contributes to the Global Change and Terrestrial Ecosystems elevated CO2 consortium of the International Geosphere-Biosphere Programme.
Article, publication date, and citation information can be found at www.plantphysiol.org/cgi/doi/10.1104/pp.011296.
LITERATURE CITED
- Barigah TS, Saugier B, Mousseau M, Guillet J, Ceulemans R. Photosynthesis, leaf-area and productivity of five poplar clones during their establishment year. Anal Sci Forest. 1994;51:613–625. [Google Scholar]
- Baskin TI. On the constancy of cell division rate in the root meristem. Plant Mol Biol. 2000;43:545–554. doi: 10.1023/a:1006383921517. [DOI] [PubMed] [Google Scholar]
- Beemster GTS, Baskin TI. Analysis of cell division and elongation underlying the developmental acceleration of root growth in Arabidopsis thaliana. Plant Physiol. 1998;116:1515–1526. doi: 10.1104/pp.116.4.1515. [DOI] [PMC free article] [PubMed] [Google Scholar]
- Ceulemans R, Taylor G, Bosac C, Wilkins D, Besford R. Photosynthetic acclimation to elevated CO2 in poplar grown in glasshouse cabinets or in open top chambers depends on duration of exposure. J Exp Bot. 1997;48:1681–1689. [Google Scholar]
- Cockcroft CE, den Boer BGW, Healy JMS, Murray JAH. Cyclin D control of growth rate in plants. Nature. 2000;405:575–579. doi: 10.1038/35014621. [DOI] [PubMed] [Google Scholar]
- Cosgrove DJ. Enzymes and other agents that enhance cell wall extensibility. Annu Rev Plant Physiol Plant Mol Biol. 1999;50:391–417. doi: 10.1146/annurev.arplant.50.1.391. [DOI] [PubMed] [Google Scholar]
- Donnelly P, Bonetta D, Tsukaya H, Dengler RE, Dengler NG. Cell cycling and cell enlargement in developing leaves of Arabidopsis. Dev Biol. 1999;215:407–419. doi: 10.1006/dbio.1999.9443. [DOI] [PubMed] [Google Scholar]
- Erickson RO, Michelini FJ. The plastochron index. Am J Bot. 1957;44:297–305. [Google Scholar]
- Ferris R, Long L, Bunn SM, Robinson KM, Bradshaw HD, Rae AM, Taylor G. Leaf stomatal and epidermal cell development: identification of putative QTL in relation to elevated carbon dioxide concentration in poplar. Tree Physiol. 2002;22:633–640. doi: 10.1093/treephys/22.9.633. [DOI] [PubMed] [Google Scholar]
- Ferris R, Sabatti M, Miglietta F, Mills RF, Taylor G. Leaf area is stimulated in Populus by free air CO2 enrichment through cell expansion and production. Plant Cell Environ. 2001;24:305–315. [Google Scholar]
- Fiorani F, Beemster GTS, Bultynck L, Lambers H. Can meristematic activity determine variation in leaf size and elongation rate among four Poa species? A kinematic study. Plant Physiol. 2000;124:845–855. doi: 10.1104/pp.124.2.845. [DOI] [PMC free article] [PubMed] [Google Scholar]
- Francis D, Halford NG. The plant cell cycle. Physiol Plant. 1995;93:365–374. [Google Scholar]
- Gardner SDL, Taylor G, Bosac C. Leaf growth of hybrid poplar following exposure to elevated CO2. New Phytol. 1995;131:81–90. doi: 10.1111/j.1469-8137.1995.tb03057.x. [DOI] [PubMed] [Google Scholar]
- Granier C, Inzé D, Tardieu F. Spatial distribution of cell division rate can be deduced from that of p34cdc2 kinase activity in maize leaves grown at contrasting temperatures and soil water conditions. Plant Physiol. 2000;124:1393–1402. doi: 10.1104/pp.124.3.1393. [DOI] [PMC free article] [PubMed] [Google Scholar]
- Granier C, Tardieu F. Spatial and temporal analysis of expansion and cell cycle in sunflower leaves. Plant Physiol. 1998;116:991–1001. doi: 10.1104/pp.116.3.991. [DOI] [PMC free article] [PubMed] [Google Scholar]
- Hemerly AS, Ferreira PCG, Van Montagu M, Inzé D. Cell cycle control and plant morphogenesis: Is there an essential link? BioEssays. 1999;21:29–37. [Google Scholar]
- Kim G-T, Shoda K, Tsuge T, Cho K-H, Uchimiya H, Yokoyama R, Nishitani K, Tsukaya H. The ANGUSTIFOLIA gene of Arabidopsis, a plant CtBP gene, regulates leaf-cell expansion, the arrangement of cortical microtubules in leaf cells and expression of a gene involved in cell-wall formation. EMBO J. 2002;21:1267–1279. doi: 10.1093/emboj/21.6.1267. [DOI] [PMC free article] [PubMed] [Google Scholar]
- Kutschera U. The role of the epidermis in the control of elongation growth in stems and coleoptiles. Bot Acta. 1992;105:246–252. [Google Scholar]
- Ljung K, Bhalerao RP, Sandberg G. Sites and homeostatic control of auxin biosynthesis in Arabidopsis during vegetative growth. Plant J. 2001;28:465–474. doi: 10.1046/j.1365-313x.2001.01173.x. [DOI] [PubMed] [Google Scholar]
- Maksymowych R. Analysis of leaf development. Cambridge, UK: Cambridge University Press; 1973. [Google Scholar]
- Malhi Y, Baldocchi DD, Jarvis PG. The carbon balance of tropical, temperate and boreal forests. Plant Cell Environ. 1999;22:715–740. [Google Scholar]
- Masle J. The effects of elevated CO2 on cell division rate, growth patterns and blade anatomy in young wheat plants are modulated by factors related to leaf position, vernalization and genotype. Plant Physiol. 2000;122:1399–1415. doi: 10.1104/pp.122.4.1399. [DOI] [PMC free article] [PubMed] [Google Scholar]
- Medlyn BE, Dewar RC. A model of the long-term response of carbon allocation and productivity of forests to increased CO2 concentration and nitrogen deposition. Global Change Biol. 1996;2:367–376. [Google Scholar]
- Miglietta F, Peressotti A, Vaccari FP, Zaldei A, deAngelis P, Scarascia-Mugnozza G. Free air carbon dioxide enrichment of a poplar plantation: description and performance of the POPFACE system. New Phytol. 2001;150:465–476. [Google Scholar]
- Mironov V, De Veylder L, Van Montagu M, Inzé D. Cyclin-dependent kinases and cell division in plants: the nexus. Plant Cell. 1999;11:509–521. doi: 10.1105/tpc.11.4.509. [DOI] [PMC free article] [PubMed] [Google Scholar]
- Oren R, Ellsworth DS, Johnsen KH, Phillips N, Ewers BE, Maier C, Schafer KVR, McCarthy H, Hendrey G, McNulty SG et al. Soil fertility limits carbon sequestration by forest ecosystems in a CO2-enriched atmosphere. Nature. 2001;411:469–472. doi: 10.1038/35078064. [DOI] [PubMed] [Google Scholar]
- Pien S, Wyrzykowska J, McQueen-Mason S, Smart C, Fleming A. Local expression of expansin induces the entire process of leaf development and modifies leaf shape. Proc Natl Acad Sci USA. 2001;98:11812–11817. doi: 10.1073/pnas.191380498. [DOI] [PMC free article] [PubMed] [Google Scholar]
- Pritchard SG, Rogers HH, Prior SA, Peterson CM. Elevated CO2 and plant structure: a review. Global Change Biol. 1999;5:807–837. [Google Scholar]
- Ranasinghe S, Taylor G. Mechanism for increased leaf growth in elevated CO2. J Exp Bot. 1996;47:349–358. [Google Scholar]
- Ridge CR, Hinkley TM, Stettler RF, Van Volkenburgh E. Leaf growth characteristics of fast growing poplar hybrids Populus trichocarpa × P. deltoides. Tree Physiol. 1986;1:209–216. doi: 10.1093/treephys/1.2.209. [DOI] [PubMed] [Google Scholar]
- Riou-Khamlichi C, Menges M, Healy JMS, Murray JAH. Sugar control of the plant cell cycle: differential regulation of Arabidopsis D-type cyclin gene expression. Mol Cell Biol. 2000;20:4513–4521. doi: 10.1128/mcb.20.13.4513-4521.2000. [DOI] [PMC free article] [PubMed] [Google Scholar]
- Rose JKC, Cosgrove DJ, Albersheim P, Darvill AG, Bennett AB. Detection of expansin proteins and activity during tomato fruit ontogeny. Plant Physiol. 2000;123:1583–1592. doi: 10.1104/pp.123.4.1583. [DOI] [PMC free article] [PubMed] [Google Scholar]
- Rottmann WH, Meilan R, Sheppard LA, Brunner AM, Skinner JS, Ma CP, Cheng SP, Jouanin L, Pilate G, Strauss SH. Diverse effects of overexpression of LEAFY and PTLF, a poplar (Populus) homolog of LEAFY/FLORICAULA, in transgenic poplar and Arabidopsis. Plant J. 2000;22:235–245. doi: 10.1046/j.1365-313x.2000.00734.x. [DOI] [PubMed] [Google Scholar]
- Schmundt D, Stitt M, Jähne B, Schurr U. Quantitative analysis of the local rates of growth of dicot leaves at a high temporal and spatial resolution, using image sequencing analysis. Plant J. 1998;16:505–514. [Google Scholar]
- Sokal RR, Rohlf FJ. Biometry. The Principles and Practice of Statistics in Biological Research. Ed 2. New York: Freeman; 1981. [Google Scholar]
- Sterky F, Regan S, Karlsson J, Hertzberg M, Rohde A, Holmberg A, Amini B, Bhalerao R, Larsson M, Villarroel R et al. Gene discovery in the wood-forming tissues of poplar: analysis of 5,692 expressed sequence tags. Proc Natl Acad Sci USA. 1998;95:13330–13335. doi: 10.1073/pnas.95.22.13330. [DOI] [PMC free article] [PubMed] [Google Scholar]
- Taylor G. Poplar: Arabidopsis for forestry. Do we need a model tree? Ann Bot. 2002;90:681–689. doi: 10.1093/aob/mcf255. [DOI] [PMC free article] [PubMed] [Google Scholar]
- Taylor G, Ceulemans R, Ferris R, Gardner SDL, Shao BY. Increased leaf area expansion of hybrid poplars in elevated CO2: from controlled environments to open-top chambers and to FACE. Environ Pollut. 2001;115:463–472. doi: 10.1016/s0269-7491(01)00235-4. [DOI] [PubMed] [Google Scholar]
- Taylor G, Davies WJ. The control of leaf growth of Betula and Acer by photoenvironment. New Phytol. 1985;101:259–268. [Google Scholar]
- Taylor G, Ranasinghe S, Bosac C, Gardner SDL, Ferris R. Elevated CO2 and plant growth: cellular mechanisms and responses of whole plants. J Exp Bot. 1994;45:1761–1774. [Google Scholar]
- Thompson DS, Davies WJ, Ho LC. Regulation of tomato fruit growth by epidermal cell wall enzymes. Plant Cell Environ. 1998;21:589–599. [Google Scholar]
- Tsuge T, Tsukaya H, Uchimiya H. Two independent and polarized processes of cell elongation regulate leaf blade expansion in Arabidopsis thaliana (L.) Heynh. Development. 1996;122:1589–1600. doi: 10.1242/dev.122.5.1589. [DOI] [PubMed] [Google Scholar]
- Van Volkenburgh E. Leaf expansion: an integrating plant behaviour. Plant Cell Environ. 1999;22:1463–1473. [Google Scholar]
- Van Volkenburgh E, Hunt S, Davies WJ. A simple instrument for measuring cell-wall extensibility. Anal Bot. 1983;51:669–672. [Google Scholar]
- Vernoux T, Kronenberger J, Grandjean O, Laufs P, Traas J. PIN-FORMED 1 regulates cell fate at the periphery of the shoot apical meristem. Development. 2000;127:5157–5165. doi: 10.1242/dev.127.23.5157. [DOI] [PubMed] [Google Scholar]
- Wang H, Zhou Y, Gilmer S, Whitwill S, Fowke LC. Expression of the plant cyclin-dependent kinase inhibitor ICK1 affects cell division, plant growth and morphology. Plant J. 2000;25:613–623. doi: 10.1046/j.1365-313x.2000.00899.x. [DOI] [PubMed] [Google Scholar]
- Werner T, Václav M, Strnad M, Schmülling T. Regulation of plant growth by cytokinin. Proc Natl Acad Sci USA. 2001;98:10487–10492. doi: 10.1073/pnas.171304098. [DOI] [PMC free article] [PubMed] [Google Scholar]
- Wullschleger S, Jansson S, Taylor G. Genomics and forestry biology: Populus emerges as a perennial favorite. Plant Cell. 2002;14:2561–2563. doi: 10.1105/tpc.141120. [DOI] [PMC free article] [PubMed] [Google Scholar]


