Abstract
In this paper we use ab initio multiconfigurational second-order perturbation theory to establish the intrinsic photoisomerization path model of retinal chromophores. This is accomplished by computing the ground state (S0) and the first two singlet excited-state (S1, S2) energies along the rigorously determined photoisomerization coordinate of the rhodopsin chromophore model 4-cis-γ-methylnona-2,4,6,8-tetraeniminium cation and the bacteriorhodopsin chromophore model all-trans-hepta-2,4,6-trieniminium cation in isolated conditions. The computed S2 and S1 energy profiles do not show any avoided crossing feature along the S1 reaction path and maintain an energy gap >20 kcal⋅mol−1. In addition, the analysis of the charge distribution shows that there is no qualitative change in the S2 and S1 electronic structure along the path. Thus, the S1 state maintains a prevalent ionic (hole–pair) character whereas the S2 state maintains a covalent (dot–dot) character. These results, together with the analysis of the S1 reaction coordinate, support a two-state, two-mode model of the photoisomerization that constitutes a substantial revision of the previously proposed models.
The photoisomerization of the retinal chromophore triggers the conformational changes underlying the activity of rhodopsin proteins (1). In rhodopsin itself (the human retina visual pigment) the retinal molecule is embedded in a cavity where it is covalently bound to a lysine residue via a protonated Schiff base (PSB) linkage. The absorption of a photon of light causes the isomerization (see equation below) of the 11-cis isomer of the retinal PSB (PSB11) to its all-trans isomer (PSBT). ![]()
Similarly in the bacterial proton-pump bacteriorhodopsin, the photoexcitation causes the isomerization of the PSBT to its 13-cis isomer (PSB13). The photoisomerization of PSB11 and PSBT in the protein environment are among the fastest chemical reactions observed so far. Thus, the photoexcitation of PSB11 in rhodopsin yields a fluorescent transient with a lifetime of ca. 150 fs (2). After this state is left, ground-state PSBT is formed within 200 fs (3). Similarly, irradiation of PSBT in bacteriorhodopsin leads to formation of a 200-fs (4–7) transient and production of the PSB13 within 500 fs. In contrast, the photochemistry of free PSB11 in solution (8) is more than 1 order of magnitude slower: in methanol, PSB11 has a ca. 3-ps fluorescence lifetime and PSBT is formed in 10 ps (9). Similar lifetimes have been reported for PSBT (10–12) and PSB13 (10) in solution.
The decrease in excited-state lifetime and the increase in reaction rate of chromophores bound within the protein with respect to the corresponding free forms in solution is a central problem of photobiology. The first step in the quest for a solution to this problem is the detailed understanding of the chromophore photoisomerization path. Recently, Anfinrud and coworkers (13, 14) have summarized the experimental evidence in support of a three-electronic state (S0, S1, and S2) model—the three-state model—of the photoisomerization path in bacteriorhodopsin originally formulated on the basis of quantum chemical computations (15). As schematically illustrated in Fig. 1a, this model is characterized by the presence of a ca. 1 kcal⋅mol−1 barrier (i.e., a transition state) on the first excited state (S1), which originates from an avoided crossing between the first (S1) and second (S2) singlet excited states. Upon photoexcitation, the chromophore structure evolves from the vertical excitation region (Franck–Condon, FC) toward transition state. After the barrier has been overcome the system undergoes a fully efficient decay to the ground state (S0) in the region of a deep energy minimum where the chromophore has a double bond twisted by ca. 90°. Recent computational work (16) has shown that this energy “minimum” is coincident with a conical intersection (CI) between the S1 and S0 energy surfaces.
Figure 1.
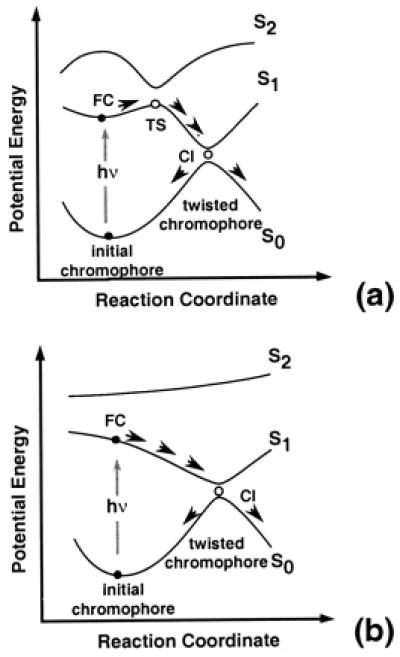
(a) The three-state model. TS, transition state. (b) The two-state model.
The three-state model represents an alternative to the earlier two-electronic state (S0, S1) model—the two-state model—proposed by Mathies et al. (4) and Dobler et al. (5) for bacteriorhodopsin, by Weiss and Warshel (17) and Schoenlein et al. (3) for rhodopsin, and by Ottolenghi and coworkers for rhodopsin proteins in general (18, 19). This model is illustrated in Fig. 1b and is characterized by a barrierless S1 relaxation leading from FC to CI directly. The two-state model originally was proposed to explain the ultrafast photoisomerization of the retinal chromophores in the protein cavity. The basic idea behind this model is that an initial nonzero slope along a S1 reaction coordinate, dominated by the double-bond torsional mode, would accelerate the molecule toward the decay channel. Anfinrud and coworkers (13, 14) have pointed out that, in bacteriorhodopsin, the fact that the S1 spectrum develops in about 30 fs and remains stable to beyond 1 ps seems incompatible with the barrierless model of Fig. 1b and that the three-state model must be preferred. ![]()
![]()
In the three-state and two-state models, the reaction coordinate is assumed to be dominated by torsional motion about the “reacting” double bond. In contrast with this hypothesis, the results of reaction path computations for the PSB11 model 4-cis-γ-methylnona-2,4,6,8-tetraeniminium cation (16) (formula 1) and the PSBT models all-trans-hepta-2,4,6-trieniminium cation (20) (formula 2) show that the S1 reaction coordinate is sequentially dominated by two substantially uncoupled modes. The first mode is totally symmetric and drives the initially planar system out of FC through a concerted double-bond stretch and single-bond compression. The second mode is nontotally symmetric and is dominated by a torsional motion about one of the central double bonds of the system. Thus, along the reaction coordinate the double-bond isomerization motion does not start immediately after photoexcitation but only after relaxation of the PSB carbon skeleton. Indeed, the initial S1 relaxation leads to a “metastable” planar species (stationary point, SP) where the central double bonds are stretched.
The formulation of the three-state model for the photoisomerization of the retinal chromophores has been inspired by the behavior of linear polyenes (21–27) [PSBs are polyenes where a terminal =CHR group has been replaced by =NHR(+)]. In short planar polyenes, the optically allowed excited state (in molecular orbital terms, the singly excited π-π* 1Bu state) is located below an optically forbidden excited state (the doubly excited π-π* 2Ag state) only in the vertical excitation region. [In valence bond terms the 1Bu state corresponds to a hole-pair (ionic) excitation whereas the 2Ag state corresponds to a dot-dot (covalent) excitation. In a twisted polyene the symmetry is lost and the molecular orbital description becomes difficult. However, the valence bond description remains simple even for highly twisted structures (28).] Upon relaxation on S1, the polyene structure evolves toward a region where the dot-dot electronic structure is more stable than the hole-pair electronic structure. Thus in the three-state model the S1 energy surface has a prevalent [because of the symmetry decrease caused by the presence of the NH2(+) group the S1 and S2 states of planar PSBs have a mixed hole-pair/dot-dot character] hole–pair character at FC and a prevalent dot–dot character after the avoided crossing (i.e., after transition state). In contrast, in the two-state model the electronic structure of the S1 energy surface remains hole–pair all along the path connecting FC to CI as the S1 and S2 states do not interact via an avoided crossing.
Our objective in this paper is to establish the intrinsic photoisomerization coordinate of retinal chromophores. This will be accomplished by using ab initio quantum chemical computations, within the framework of multiconfigurational second-order perturbation theory, to determine whether a S2/S1 avoided crossing exists along the photoisomerization coordinate of 1 and 2. Below we show that the results support the FC → SP → CI mechanism illustrated in Fig. 2, where the S1 state maintains a hole–pair character and the S2 state maintains a dot–dot character all along the two-mode reaction coordinate.
Figure 2.
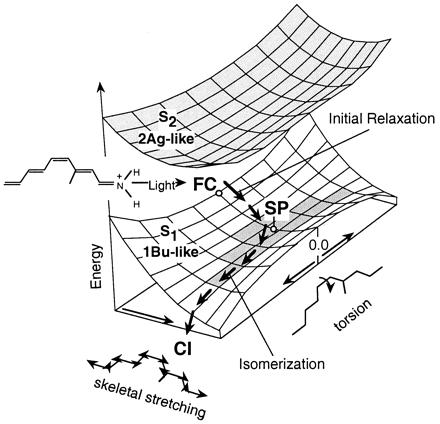
Structure of the S2 and S1 energy surfaces along the S1 reaction path for the PSB11 model 1. The stream of arrows on the S1 surface represents the reaction path. Point SP corresponds to a planar species where the torsional deformation leading to the S1 → S0 decay channel (CI) begins. The shaded area on the lower surface corresponds to an extended energy plateau.
Computational Methods
The computations reported in this paper for the PSB11 model 1 were performed by using the CASPT2 method (PT2F level) included in molcas-4 (29) with a generally contracted basis sets of atomic natural orbital obtained from the C,N (10s6p3d)/H (7s) primitive sets by using the C,N[3s2p1d]/H[2s] contraction scheme (30). The zero-order complete active space self-consistent field (CASSCF) wave function used in the calculation is characterized by an active space of 10 π-electrons in 10 π-orbitals (10e/10o). A state average computation was used including the first three roots (S0, S1, S2). For the CASPT2 computations on the shorter PSBT model 2 we used the standard 6–31G* basis set and a zero-order wave function with an 8e/8o complete active space. The seven molecular structures considered for 1 (planar FC, planar SP, twist 8°, twist 18°, twist 44°, twist 68°, and twist 90°) are from refs. 16 and 31 and were determined via minimum energy path (MEP) computations and geometry optimization at the CASSCF (32) level of theory.
The molecular dipole moments and charge distribution (Mulliken charges) along the backbone of 1 and 2 are determined at the CASSCF level of theory. Notice that the charge distribution along the −C=NH2(+) moiety is sensitive to the basis set. In particular, the charge is larger on the N atom when the atomic natural orbital basis set is used but become larger on the C atom when the 6–31G* basis is used (see Tables 1 and 2, which are published as supplemental material on the PNAS web site, www.pnas.org). Nevertheless as we will see below the charge distribution along the remaining hydrocarbon fragment of the chromophore is basis set-independent. In a previous paper (33) on a shorter PSB11 model (i.e., the penta-3,5-dieniminium cation) we demonstrated that, for this system, the atomic charges computed by using different schemes (NPA, CHelpG, MKS) yield the same distribution. Similarly the computed total natural bond orbital (32, 34) charges computed for the points planar FC and planar SP of 1 show, again, the same type of distribution. An analogous series of structures (20) were considered for model 2 (see also Tables 6–9, which are published as supplemental material).
Results and Discussion
All computed energy and charge data are given in Tables 1–5 (see supplementary material on www.pnas.org). The energy profiles along the S1 MEP of 1 are reported in Fig. 3. The energy values can be used to calibrate the quality of the model with respect to retinal PSBs in hydrocarbon solution. The experimental absorption maximum for the protonated N-butylamine of the retinal Schiff base (35) is 458 nm in hexane (for both the 11-cis and all-trans forms) and the experimental fluorescence maximum is ca. 620 nm (for the all-trans form) (36). These data compare reasonably well with the computed absorption maximum (482 nm at planar FC) and fluorescence maximum (590 and 594 nm at the twisted 8° and at the planar SP points, respectively). The fluorescence maximum has been obtained by assuming that the fluorescent state is dominated by planar or nearly planar configurations located along the initial part of the S1 energy plateau of Fig. 3. Further evidence for the quality of model 1 comes from a recent simulation of the PSB11 resonance Raman spectra (31). The computed excited- and ground-state charge distribution can be validated by comparison with the observed dipole moment for the all-trans N-butyl retinal PSB in dioxetane solution (37). The observed 12.0 Debyes S0-S1 dipole moment change |Δμ| is of the same magnitude of the 14.0 Debyes value computed for 1.
Figure 3.
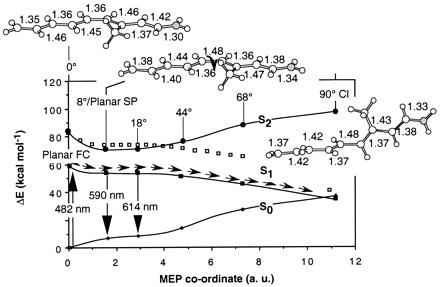
Energy profiles along the S1 photoisomerization coordinate of 1. The structures (geometrical parameters in Å and degrees) document the progression of the molecular structure along the coordinate (see ref. 16). ■ show the CASPT2 S1 energy profile, and □ show the CASSCF energy profile before PT2 correction. ● and ♦ show the CASPT2 S2 and S0 energy profiles along the same coordinate, respectively. Notice that, because of the S1/S0 curve crossing, at the 90° CI structure the state labeled S0 is ca. 1 kcal⋅mol−1 higher than that labeled S1. For the sake of simplicity we maintain this inverted labeling throughout the paper.
By inspection of Fig. 3 it is apparent that there is no evidence for the occurrence of an avoided crossing between the S2 and S1 energy profiles. Indeed, the energy gap between the two states remains almost constant (ca. 20 kcal⋅mol−1) during the initial relaxation then increases (never decreases!) along the remaining part of the path until the S1/S0 CI is reached. This behavior is related to the two-mode nature of the reaction coordinate illustrated in Fig. 2. The initial slope starting at planar FC corresponds to FC → SP, is dominated by a stretching relaxation, and is followed by double-bond twisting motion about the SP → CI region, starting at planar SP and leading to the CI.
Charge Distribution.
A demonstration of the lack of an S2/S1 avoided crossing along the isomerization path is obtained from the analysis of the S0, S1, and S2 charge distributions. The charge distribution is a manifestation of the electron distribution along the chain (position of the π-electrons and polarization of the σ-backbone), which is a consequence of the type of electronic configurations (e.g., dot–dot and hole–pair) that dominates the wave function (28). Thus at an avoided crossing between two states characterized by wave functions dominated by different configurations, a fast change in the position of the PSB positive charge must occur.
At the planar FC structure the S0 and S2 charge distributions (black and white bars in Fig. 4) are similar and yield a S2-S0 |Δμ| of ca. 4 Debyes (see Table 10, which is published as supplemental material). In contrast, the S1 charge distribution (gray bars in Fig. 4) is different (S1-S0 |Δμ| is ca. 14 Debyes). In this state, a significant amount of electron density has migrated from the C= C–C=C–C− fragment toward the −C–C=C–C=N fragment, leading to a more distributed positive charge. In particular, in the S0 and S2 states of the planar FC and SP points ca. 75% of the positive charge resides on the −C–C=C–C=N fragment. On the other hand, in the S1 state only ca. 40% of the positive charge resides on −C–C=C–C=N, yielding a 35% charge translocation upon S0 → S1 excitation. Although the same pattern is maintained all along the reaction coordinate, the magnitude of the C=C–C=C–C− and −C–C=C–C=N charges changes. In fact, as shown in Fig. 5 there is a regular increase in charge translocation along the part of the reaction coordinate dominated by torsional motion. Thus at the 90° twisted structure ca. 100% of the positive charge is found either on the nitrogen-containing fragment (S0 and S2 states) or in the C= C–C=C–C− fragment (S1 state). Natural bond orbital charges analysis show that only the change in the π-electron density is responsible for the charge translocation from the −C–C=C–C= N to the C=C–C=C–C− moiety. The same analysis indicates that in the S1 state the valence bond configurations (resonance structures) C=C–C=C–C(+)−, C=C–C(+)–C=C− and C(+)–C=C–C=C− increase in weight upon twisting. The trend of the S1-S0 |Δμ| values is consistent with the data of Fig. 5. This quantity decreases along the initial stretching relaxation coordinate up to the S1 planar equilibrium structure (ca. 6 Debyes). The following torsional deformation increases the |Δμ| value, which becomes ca. 26 Debyes at the 90° twisted structure where one has a full charge translocation. The electronic structure at the conical intersection of PSB can be related to the structure of the twisted charged transfer state of polyenes, which is dominated by hole–pair configurations (28). In terms of the two-electron, two-orbital model this structure corresponds to a critically heterosymmetric diradicaloid (see also ref. 38).
Figure 4.
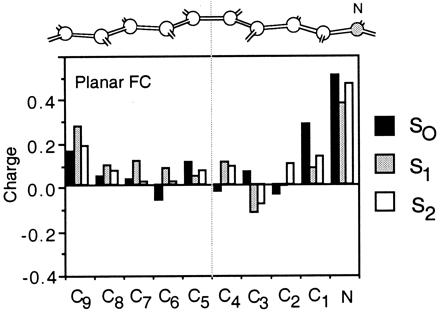
Distribution of the CASSCF atomic natural orbital Mulliken charges along the molecular backbone of 1. The bar diagram gives the S0, S1, and S2 charges at the planar FC point of Fig. 3. Hydrogen atom charges are summed to the corresponding backbone atom. The charge of the -CH3 substituent is summed on the C3 backbone atom.
Figure 5.
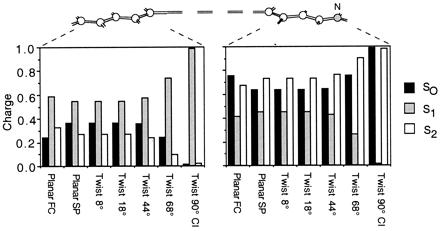
CASSCF atomic natural orbital Mulliken charges along the photoisomerization path of 1. The bar diagrams describe the change in the S0, S1, and S2 charges of the −C–C=C–C=N (Right) and the C=C–C=C–C− (Left) fragments along the points indicated in Fig. 3.
The triggering of “charge translocation” upon photoexcitation of PSB11 has been previously proposed by Michl and coworkers as a general rule in polyenes displaying fragments with different electronegativities (38) and on the basis of a computational investigation of the acroleiniminium cation (40) H2C=CH–CH=NH2(+). Our data show that this behavior occurs in realistic models.
Generalization to the All-trans Isomer.
Although model 1 is a realistic model for the PSB11 chromophore of rhodopsin, the photoreceptor bacteriorhodopsin has a PSBT chromophore. To establish the general validity of the FC → SP → CI path and the related charge distribution we have performed a series of computations (see Fig. 8, which is published as supplemental material) on PSBT model 2, which has four double bonds. The results show the same general features seen in Figs. 3 and 4 for 1. The structure of the conical intersection corresponds to the decay channel for the photoisomerization of the −C3=C4− double bond. [A competitive photoisomerization about the −C5=C6− bond also has been documented (20). The S1 energy profiles along the competing −C3=C4− and −C5=C6− reaction coordinates are similar but the second reaction occurs along a longer energy plateau and ends at a slightly higher conical intersection (the intersection structures are given in Tables 8 and 9).] The only differences between 2 and 1 are related to the nature of the SP point (which corresponds to a flat transition state rather than to a flat minimum) and to the extension of the S1 energy plateau (up to ca. 30° rather than 40° torsion). We shall now provide evidence that these differences are related to the shorter length of the π system of model 2.
Origin of the Energy Plateau and Reaction Barrier.
Although we find no evidence for an avoided crossing between the S2 and S1 energy surfaces, the flat S1 energy profile in Fig. 3 does not exclude the presence of a small (<2 kcal⋅mol−1) barrier. The fact that we find a long energy plateau rather than a flat transition state may be caused by different factors including (a) the neglected interactions with the solvent and counterion, (b) the neglected double bond, and (c) the limit in computational accuracy. Dynamics simulations carried out by using model potentials indicates that an excited-state barrier also may arise because of the cavity or solvent friction (55). However, the barrier observed in PSBT and PSB13 seems, at least in part, caused by an intramolecular electronic factor (see ref. 10). Indeed frequency computations indicate that SP (i.e., planar SP) is a local energy minimum and that a barrier must exist along the SP → CI region. Comparison of the S1 energy profile of 1 with those of two shorter PSBs with four (formula 2) and three (formula 3 in Fig. 6) conjugated double bonds provides information on the origin of the barrier. In Fig. 6, we show that the flatness of the energy profile increases by increasing the chain length. Frequency computations at the three planar S1 equilibrium points (i.e., SP) demonstrate that the lowest frequency modes correspond, in all cases, to a torsional deformation about the reactive double bond. The frequency values of 254, 45i, and 254i cm−1 for models 1, 2, and 3, respectively show that the curvature of the energy surface along these modes changes from positive to negative by decreasing the number of conjugated double bonds. In particular, in the three- and four-double bond systems (models 2 and 3) the frequency is imaginary (i.e., the curvatures are negative), demonstrating that SP is a transition structure and not a true energy minimum as in 1. This effect also is confirmed by the length (1.48, 1.49, and 1.53 Å for models 1, 2, and 3, respectively) of the reactive double bond at SP.
Figure 6.
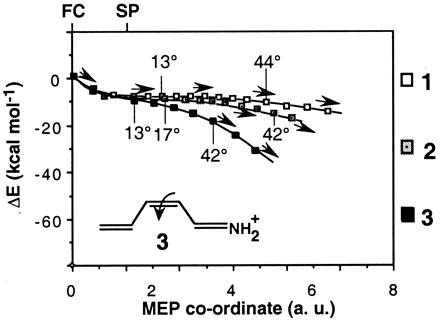
CAS-PT2 energy profiles along the S1 photoisomerization coordinate of the retinal models 1, 2, and 3. Two values for the angle of twisting (i.e., the −C−C−C−C− dihedral angle) about the isomerizing bond are given along the energy profiles to document the progression along the reaction coordinate.
These results suggest that the origin of the different shape of the three energy profiles lies in the π-electron delocalization still present on the first excited state. Thus, in 1 the delocalization is weakened upon torsional deformation and the system is destabilized, thus explaining the local stability of the torsional mode at SP. The corresponding S1 energy surface shape and reaction path are illustrated in Fig. 7a. The π-electron delocalization gradually is reduced with the decrease of the number of conjugated double bonds, resulting in the surface shape and steeper barrierless path shown in Fig. 7b and corresponding to model 3.
Figure 7.
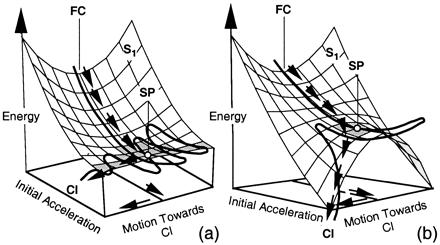
Shape of the FC → SP region of the S1 energy surface of (a) model 1 and (b) model 3.
Comparison with the Experimental Data.
The initial excited-state dynamics of a retinal PSB in ethanol (PSBT) has been investigated by femtosecond absorption spectroscopy (11, 12). The depopulation of the FC region occurs in <100 fs and involves propagation of the vibrational wave packet along the S1 energy slope. After this phase is completed a second phase begins, which involves vibrational energy redistribution on the S1 energy surface and lasts ca. 300 fs. Finally, a picosecond process begins, which should correspond to the S1 → S0 decay. This kind of model (not necessarily the given time scales) matches the isomerization dynamics suggested by the two-state, two-mode model of Fig. 2. Accordingly, the first process would correspond to the FC → SP relaxation, the second process would correspond to the energy redistribution from the initially populated stretching at SP, and, finally, the picosecond decay process would correspond to a barrier-controlled evolution of the, at least partially equilibrated, S1 species toward CI. This interpretation is supported by an ab initio semiclassical trajectory computation (41) carried out by using the short PSB11 model of Fig. 6. The resulting trajectory (and a classical trajectory computed for 1; ref. 16) indicates a time scale of only 10–20 fs for the FC → SP relaxation. However, because of the unstable SP region of this model (see Fig. 7b) the excited state is populated for only ca. 60 fs, corresponding to a couple of oscillations.
Resonance Raman spectra analysis suggests that the character of the force field controlling the initial excited-state dynamics of PSB11 in solution and inside the rhodopsin cavity is similar (42, 43). If this is true, the two-mode reaction coordinate indicates that the initial part of the photoisomerization path in the protein environment also should be dominated by stretching modes (in the protein this must be mixed with a torsional component as indicated by the intense C11=C12 HOOP mode seen in resonance Raman spectra of rhodopsin) (ref. 44; see also discussion in ref. 42). A series of different time-resolved femtosecond spectroscopic studies on bacteriorhodopsin (45–47) and rhodopsin (48, 49) provide evidence that this is the case. Zong et al. (45) have established that the formation of the transient excited-state species occurs <30 fs after promotion of the ground-state system to FC. This time scale matches well with the predicted 10–20 fs for the chromophore models and suggests that the time scale for the production of the fluorescent state in solution is much shorter than the previously reported 100 fs (11, 50). This finding suggests that the protein cavity itself should not dramatically change the initial excited-state dynamics of the retinal chromophore. As a consequence, the observed (14) 30-fs development and picosecond invariance of the stimulated emission spectra in bacteriorhodopsin may be explained by our two-state, two-mode reaction path.
Although the initial dynamics appears to be similar in the protein cavity and in solution the very different S1 lifetimes (ca. 150- to 200-fs and 2- to 3-ps time scale, respectively) indicate that the following twisting motion is not. Our computations suggest that the lifetime is, in part, controlled by the presence of a long energy plateau and/or a small barrier along the torsional mode. This barrier may be smaller or even disappear when the chromophore is enclosed in the protein cavity, thus explaining the increase in the reaction rate. Indeed although the existence of a 1 kcal⋅mol−1 barrier has been proposed for bacteriorhodopsin on the basis of low-temperature studies (14, 51) this hypothesis has been recently questioned by other authors (52). In the case of rhodopsin a very recent study (2) has revealed a S1 lifetime (ca. 170 fs) of the same order of magnitude of the S0 hot product appearance time (200 fs). This observation is only compatible with a fast barrierless excited-state motion. This situation suggests that the structure of the S1 potential energy surface given in Fig. 7a may be modified by the protein cavity to yield a less stable SP region. Such a situation may arise if the energy plateau is reduced or eliminated such as in the surface of Fig. 7b and/or when the surface is made “asymmetric” with respect to the twisting coordinate by the chiral environment, charged and dipolar groups of the rhodopsin cavity (53).
Conclusions
Above we have reported a MEP that provides an unambiguous cis → trans photoisomerization coordinate for PSB11 (and PSBT) in isolated conditions. This coordinate suggests the dynamic behavior illustrated in Fig. 7a, where a metastable species performs many skeletal oscillations along an energy plateau before the reactive torsional modes get fully populated. The plateau may be assigned to the picosecond “fluorescent state” observed in solution. A second basic feature of the computed path is the positive-charge translocation along the chromophore framework. As seen in Figs. 4 and 5 the positive charge partially shifts from the N end to the C end of the models upon S0 → S1 photoexcitation and S1 in-plane relaxation. The following twisting deformation leads to a complete translocation of the charge that localizes on the fragment containing the C end.
The mechanistic role played in rhodopsin proteins by the excited-state initial (stretching) relaxation and charge translocation of the retinal chromophore is a matter of current interest. Experimental evidence that this initial motion is directly involved in the triggering of the early protein conformational changes has been recently reported (54). In conclusion, we believe that the results of the analysis of both experimental and theoretical investigation call for a revision of the models previously proposed for the primary event in rhodopsin proteins.
Supplementary Material
Acknowledgments
We are grateful to Prof. Josef Michl and Prof. Michael Ottolenghi for many suggestions. Funding has been provided by the Università degli Studi di Siena (Fondi per Progetto di Ateneo A.A. 1999/2000), European Union Training and Mobility of Researchers network grant (FMRX-CT96–0079, Quantum Chemistry for the Excited State), and the North Atlantic Treaty Organization (CRG 950748).
Abbreviations
- PSB
protonated Schiff base
- PSB11
11-cis isomer of PSB
- PSBT
all-trans isomer of PSB
- FC
Franck–Condon
- CI
conical intersection
- SP
stationary point
- CASSCF
complete active space self-consistent field
- MEP
minimum energy path
References
- 1.Ottolenghi M, Sheves M, editors. Isr J Chem. 1995;35:193–513. [Google Scholar]
- 2.Chosrowjan H, Mataga N, Shibata Y, Tachibanaki S, Kandori H, Shichida Y, Okada T, Kouyama T. J Am Chem Soc. 1998;120:9706–9707. [Google Scholar]
- 3.Schoenlein R W, Peteanu L A, Mathies R A, Shank C V. Science. 1991;254:412–415. doi: 10.1126/science.1925597. [DOI] [PubMed] [Google Scholar]
- 4.Mathies R A, Brito Cruz C-H, Pollard T W, Shank C V. Science. 1988;240:777–779. doi: 10.1126/science.3363359. [DOI] [PubMed] [Google Scholar]
- 5.Dobler J, Zinth W, Kaiser K, Oesterhelt D. Chem Phys Lett. 1988;144:215–220. [Google Scholar]
- 6.Kobayashi T, Terauchi M, Yoshizawa M, Taiji M. Proc Intl Soc Opt Eng. 1990;144:407–409. [Google Scholar]
- 7.Haran G, Wynne K, Aihua X, He Q, Chance M, Hochstrasser R M. Chem Phys Lett. 1996;261:389–395. [Google Scholar]
- 8.Becker R S. Photochem Photobiol. 1988;48:369–399. doi: 10.1111/j.1751-1097.1988.tb02836.x. [DOI] [PubMed] [Google Scholar]
- 9.Kandori H, Katsuta Y, Ito M, Sasabe H. J Am Chem Soc. 1995;117:2669–2670. [Google Scholar]
- 10.Logunov S L, Song L, El-Sayed M. J Phys Chem. 1996;100:18586–18591. [Google Scholar]
- 11.Hamm P, Zurek M, Röschinger T, Patzelt H, Oesterhelt D, Zinth W. Chem Phys Lett. 1996;263:613–621. [Google Scholar]
- 12.Kandori H, Sasabe H. Chem Phys Lett. 1993;216:126–132. [Google Scholar]
- 13.Gai F, Hasson K C, McDonald J C, Anfinrud P A. Science. 1998;279:1886–1891. doi: 10.1126/science.279.5358.1886. [DOI] [PubMed] [Google Scholar]
- 14.Hasson K C, Gai F, Anfinrud P A. Proc Natl Acad Sci USA. 1996;93:15124–15129. doi: 10.1073/pnas.93.26.15124. [DOI] [PMC free article] [PubMed] [Google Scholar]
- 15.Schulten K, Humphrey W, Lugunov I, Sheves M, Xu D. Isr J Chem. 1995;35:447–464. [Google Scholar]
- 16.Garavelli M, Vreven T, Celani P, Bernardi F, Robb M A, Olivucci M. J Am Chem Soc. 1998;120:1285–1288. [Google Scholar]
- 17.Weiss R M, Warshel A. J Am Chem Soc. 1979;101:6131–6133. [Google Scholar]
- 18.Rosenfeld T, Honig B, Ottolenghi M. Pure Appl Chem. 1977;49:341–351. [Google Scholar]
- 19.Hurley J B, Ebrey T G, Honig B, Ottolenghi M. Nature (London) 1977;270:540–542. doi: 10.1038/270540a0. [DOI] [PubMed] [Google Scholar]
- 20.Garavelli M, Bernardi F, Olivucci M, Vreven T, Klein S, Celani P, Robb M A. Faraday Discuss Chem Soc. 1998;110:51–70. [Google Scholar]
- 21.Hudson B S, Kohler B E. J Chem Phys. 1973;59:4984–5002. [Google Scholar]
- 22.Petek H, Bell A J, Christensen R L, Yoshihara K. J Chem Phys. 1992;96:2412. [Google Scholar]
- 23.Cyr D R, Hayden C C. J Chem Phys. 1996;104:771–774. [Google Scholar]
- 24.Petek H, Bell A J, Christensen R L, Yoshiara K. Proc Intl Soc Opt Eng. 1992;1638:345–356. [Google Scholar]
- 25.Petek H, Bell A J, Choi Y S, Yoshiara K, Tounge B A, Christensen R L. J Chem Phys. 1993;98:3777–3794. [Google Scholar]
- 26.Roos B O. Acc Chem Res. 1999;32:137–144. [Google Scholar]
- 27.Garavelli M, Celani P, Bernardi F, Robb M A, Olivucci M. J Am Chem Soc. 1997;119:6891–6901. [Google Scholar]
- 28.Michl J, Bonacic-Koutecky V. Electronic Aspects of Organic Photochemistry. New York: Wiley; 1990. [Google Scholar]
- 29.Andersson K, Blomberg M R A, Fülscher M P, Karlstöm G, Lundh R, Malmqvist P-A, Neogrády P, Olsen J, Roos B O, Sadlej A J, et al. molcas. Lund, Sweden: University of Lund; 1997. , Version 4. [Google Scholar]
- 30.Pierloot K, Dumez B, Widmark P-O, Roos B. Theor Chim Acta. 1995;90:87–114. [Google Scholar]
- 31.Garavelli M, Negri F, Olivucci M. J Am Chem Soc. 1999;121:1023–1029. [Google Scholar]
- 32.Frisch M J, Trucks G W, Schlegel H B, Gill P M W, Johnson B G, Robb M A, Cheeseman J R, Keith T, Petersson G A, Montgomery J A, et al. gaussian 94. Pittsburgh, PA: Gaussian; 1995. , Revision B.2. [Google Scholar]
- 33.Garavelli M, Celani P, Bernardi F, Robb M A, Olivucci M. J Am Chem Soc. 1997;119:6891–6901. [Google Scholar]
- 34.Reed A E, Curtiss L A, Weinhold F. Chem Rev. 1988;88:899–926. [Google Scholar]
- 35.Freedman K A, Becker R S. J Am Chem Soc. 1986;108:1245–1251. [Google Scholar]
- 36.Bachilo S M, Bondarev S L, Gillbro T. J Photochem Photobiol A. 1996;34:39–46. [Google Scholar]
- 37.Mathies R, Stryer L. Proc Natl Acad Sci USA. 1976;73:2169–2173. doi: 10.1073/pnas.73.7.2169. [DOI] [PMC free article] [PubMed] [Google Scholar]
- 38.Bonačić-Koutecký V, Köhler K, Michl J. Chem Phys Lett. 1984;104:440–443. [Google Scholar]
- 39.Bonačić-Koutecký V, Koutecký J, Michl J. Angew Chem Int Ed Engl. 1987;26:170–189. [Google Scholar]
- 40.Bonačić-Koutecký V, Schöffel K J, Michl J. Theor Chim Acta. 1987;72:459–474. [Google Scholar]
- 41.Vreven T, Bernardi F, Garavelli M, Olivucci M, Robb M A, Schlegel H B. J Am Chem Soc. 1997;119:12687–12688. [Google Scholar]
- 42.Mathies R, Freedman T, Stryer L. J Mol Biol. 1977;109:367–372. doi: 10.1016/s0022-2836(77)80040-5. [DOI] [PubMed] [Google Scholar]
- 43.Kakitani T, Akiyama R, Hatano Y, Iamamoto Y, Schichida Y, Verdegem P, Lugtenburg J. J Phys Chem B. 1998;102:1334–1339. [Google Scholar]
- 44.Loppnow G R, Mathies R A. Biophys J. 1988;54:35–43. doi: 10.1016/S0006-3495(88)82928-X. [DOI] [PMC free article] [PubMed] [Google Scholar]
- 45.Zhong Q, Ruhman S, Ottolenghi M. J Am Chem Soc. 1996;118:12828–12829. [Google Scholar]
- 46.Haran G, Wynne K, Xie A, He Q, Chance M, Hochstrasser R M. Chem Phys Lett. 1996;261:389–395. [Google Scholar]
- 47.Song L, El-Sayed M A. J Am Chem Soc. 1998;120:8889–8890. [Google Scholar]
- 48.Kakitani T, Akiyama R, Hatano Y, Imamoto Y, Shichida Y, Verdegem P, Lugtenburg J. J Phys Chem B. 1998;102:1334–1339. [Google Scholar]
- 49.Haran G, Morlino E A, Matthes J, Callander R H, Hochstrasser R M. J Phys Chem A. 1999;103:2202–2207. [Google Scholar]
- 50.Dobler J, Zinth W, Kaiser K, Oesterhelt D. Chem Phys. 1988;144:215–220. [Google Scholar]
- 51.Shapiro S L, Campillo A J, Lewis A, Perreault G J, Spoonhower J P, Clayton R K, Stoeckenius W. Biophys J. 1978;23:383–393. doi: 10.1016/S0006-3495(78)85457-5. [DOI] [PMC free article] [PubMed] [Google Scholar]
- 52.Logunov S L, Masciangioli T M, Kamalov V F, El-Sayed M A. J Phys Chem. 1998;102:2303–2306. [Google Scholar]
- 53.Kochendoerfer G G, Lin S W, Sakmar T P, Mathies R A. Trends Biochem Sci. 1999;24:300–305. doi: 10.1016/s0968-0004(99)01432-2. [DOI] [PubMed] [Google Scholar]
- 54.Rousso I, Khachatryan E, Gat Y, Brodsky I, Ottolenghi M, Sheves M, Lewis A. Proc Natl Acad Sci USA. 1997;94:7937–7941. doi: 10.1073/pnas.94.15.7937. [DOI] [PMC free article] [PubMed] [Google Scholar]
- 55.Warshel A, Chu Z T, Hwang J-K. Chem Phys. 1991;158:303–314. [Google Scholar]
Associated Data
This section collects any data citations, data availability statements, or supplementary materials included in this article.


