Abstract
A scheme for visualizing and quantifying the complexity of multidimensional energy landscapes and multiple pathways is presented employing principal component-based disconnectivity graphs and the Shannon entropy of relative “sizes” of superbasins. The principal component-based disconnectivity graphs incorporate a metric relationship between the stationary points of the system, which enable us to capture not only the actual assignment of the superbasins but also the size of each superbasin in the multidimensional configuration space. The landscape complexity measure quantifies the degree of topographical complexity of a multidimensional energy landscape and tells us at which energy regime branching of the main path becomes significant, making the system more likely to be kinetically trapped in local minima. The path complexity measure quantifies the difficulty encountered by the system to reach a connected local minimum by the path in question, implying that the more significant the branching points along the path the more difficult it is to end up in the desired local minimum. As an illustrative example, we apply this analysis to two kinds of small model protein systems exhibiting a highly frustrated and an ideal funnel-like energy landscape.
Keywords: information theory, protein landscape, tree graph
To resolve important contemporary issues in the dynamics and thermodynamics of clusters, liquids, glasses, and biomolecules requires a knowledge of the multidimensional free energy surface (FES) or potential energy surface (PES) by which motions of the system and all complexity in the observations are governed. The most powerful tool currently available for visualizing the high-dimensional energy landscape is probably the disconnectivity graph (DG) approach (1), which has now been applied to a wide range of systems (2, 3). The DG as developed originally is constructed from a database of local minima and saddles to which they are connected by steepest-descent paths on the multidimensional PES. The DGs provide a global view of the PES, which retains topological information. The qualitative appearance of the graph can predict qualitative aspects of the kinetics and thermodynamics, such as multiple relaxation time scales and features in the heat capacity for landscapes containing multiple potential energy funnels (4, 5). This approach is, however, limited to relatively rigid systems or to flexible systems with a small number of important degrees of freedom because the number of stationary points grows exponentially with the number of degrees of freedom (6–8). Recently, a new method has been developed to construct the corresponding DG for multidimensional FES, which overcomes this difficulty by using a long equilibrium trajectory (9, 10). It was shown, using the second β-hairpin of protein G, that the projection of multidimensional FES onto only one or two progress variables (which have often been used in the literature) results in relatively smooth surfaces and masks the complexity of the underlying unprojected full dimensional surface (9). However, in the DG representation of the PES or FES, each state (“node”) is located along a one-dimensional unphysical coordinate simply for visual clarity, from which one cannot capture actual alignments and entanglements between each superbasin on the multidimensional configuration space. Moreover, there has been no appropriate measure to quantify how “complex” the underlying energy landscape is and how “complex” the multiple pathways leading to different local minima are, which is relevant to how they compete with each other in the kinetics. Such measures offer new possibilities of telling us how the systems may misfold by being trapped into one of several competing local funnels.
In this article, we present an alternative multidimensional metric DG approach, which incorporates a metric relationship between superbasins. Based on information content of energy landscapes, we also propose a measure to quantify the degree of topographical complexity of a multidimensional energy landscape, which is expected to characterize to what extent systems behave as structure seekers and glass formers, and to quantify the competition of entangled multiple pathways.
To illustrate our approach, we mainly focus on a 3-color, 46-bead model protein (11, 12). This system has been examined in a number of previous studies (5, 12–18). This model (termed the BLN model hereafter) is composed of hydrophobic (B), hydrophilic (L), and neutral (N) beads, and the global potential energy minimum for the sequence, B9N3(LB)4N3B9N3(LB)5L, folds into a β-barrel structure with four strands. The BLN model exhibits a frustrated PES (5, 16) and does not fold efficiently (13–15). Two peaks are seen in the heat capacity, corresponding to collapse from extended to compact states at higher temperature, and to folding into the global potential energy minimum at lower temperature (13, 15). In contrast, in the Gō model, constructed by removing all of the attractive interactions that do not correspond to nonsequential closest contacts in the native state (global minimum), a much sharper single heat capacity peak is observed (5). It was observed in the standard nonmetric DG (16) that the PES for the original BLN potential includes a number of relatively deep potential energy funnels, but for the Gō model the surface has an almost ideal single funnel topography.
A New Metric DG
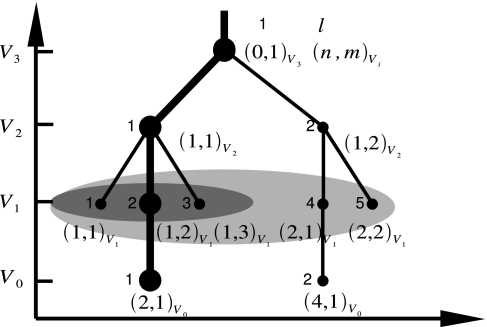
The standard way to display a network of stationary points is by plotting a DG, which is usually constructed as follows (1, 3). For a given discrete series of energies V0 < V1 < V2 < …, with a separation of ΔV, the minima can be classified into disjoint sets, termed “superbasins” (1, 3), whose members are mutually accessible, connected by pathways where the energy never exceeds Vi. For every value of Vi, each superbasin s is represented by a node. Lines are drawn between the “child” nodes at energies Vi and the “parent” nodes at energies Vi+1 if they are the same superbasin or they are superbasins that merge at the higher energy Vi+1. As seen in Fig. 1, each superbasin (s) on this network can be uniquely identified by a connectivity index (n,m)Vi with n the index of the parent node of s at energy Vi+1 and m the index of s over all child nodes of n. n and m range from 0 to the total number of the nodes at energy Vi+1 and from 1 to the number of the child nodes at Vi, respectively (see the legend of Fig. 1). In this article, we have chosen the connectivity index to identify the superbasin because it is suitable for classifying the superbasins along pathways. Our DG implementation is a natural extension of the original DG method: each node is allocated along a physically motivated coordinate for the horizontal axis, which holds as much “distance” information between superbasins (nodes) in the underlying multidimensional configuration space as possible (19). Principal component analysis (20, 21) is used to derive an approximate description of multidimensional landscapes in lower dimensionality. The principal component analysis determines a set of linear, collective coordinates {Qi} that best represents the variance of the distribution of stationary points in multidimensional configuration space. The superbasin or simply node (n,m)Vi is placed on the energy axis at energy Vi and placed on the x axis at the value of the principal coordinate Q1 (having the largest variance), averaged for all of the points within the superbasin that the node represents. For three-dimensional graphs, the average value of the second principal coordinate Q2 (the second largest variance) is used to provide the y axis.
Fig. 1.
Schematic representation of a DG with nodes (n,m)Vi and (l)Vi. The superbasin can be uniquely identified either by (n,m)Vi or (l)Vi, that is, the lth node at a given energy Vi. The root leading to the node (2,1) at V0 (denoted by bold line) is represented by the node sequence in the DG as (0,1)V3 → (1,1)V2 → (1,2)V1 → (2,1)V0. n refers to the “parent” node l at Vi+1 to which the current node at Vi is connected (the value can run from 0 to the total number of nodes at Vi+1; n = 0 denotes a node with no “parent” node, i.e., at Vmax). m refers to the mth “child” node connected to the same parent node n, whose value runs from 1 to the total number of the child nodes, e.g., the node (4,1) at V0 corresponds to the first child node of the fourth parent node [i.e., (4)V1 at V1]. The summation Σ′n′,m′ in Eq. 1 is defined as Σ′n′,m′ = Σn′ = 1(ntot)Vi Σm′ = 1(mn′αtot)Vi, where (ntot)Vi and (mntot)Vi, respectively, corresponds to the total number of parent nodes and that of the child nodes at Vi. The summation Σ″m′ for root α in Eq. 2 is defined by Σm′ = 1(mnαtot)Vi. Σ′n′,m′ at V1 and Σ″m′ for the parent node 1 at V1 are shown by light gray and dark gray regions, respectively.
The thickness of the line drawn between merging or identical superbasins is introduced so as to depend upon the “size” of the superbasin. That is, a thicker line represents a larger superbasin. There may exist many ways to represent the “size” of superbasins. Here we represent the “size” of superbasin (n,m)Vi in terms of the number of stationary points contained within the superbasin.
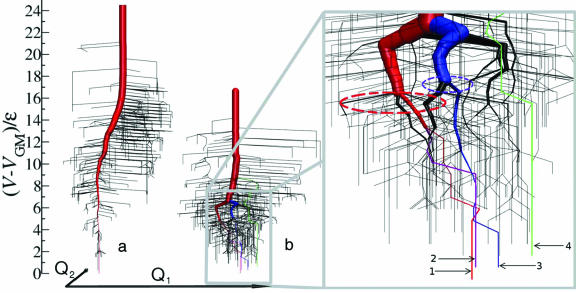
In Fig. 2, three-dimensional metric DGs are presented for the BLN and Gō models. One can, visually, understand that for the BLN model the multiple superbasin nature is manifested in the multiple thick entangled branches but the Gō model exhibits a single thick dominant branch. However, how can one quantify the complexity of such multidimensional landscapes and entangled multiple paths leading to different local minima?
Fig. 2.
New three-dimensional DGs for Go#x0304; (a) and BLN (b) models where the energy bin ΔV is 0.3ε (19). The paths leading to the global minimum (GM) and the second, third, and fourth lowest minima are highlighted in red, purple, blue, and green, respectively. Roots 1, 2, 3, and 4 of the BLN model terminate at minimum conformations at −53.62ε(GM), −53.53ε, −53.44ε, and −53.14ε, respectively. In the (Q1,Q2) plane, the second, third, and fourth most stable minimum conformations are located at distances of 0.29σ, 2.04σ, and 11.99σ from the GM. Here we have used 500 minima and 636 saddles for the BLN model, and 520 minima and 844 saddles for the Gō model (16). The potential energy function is described by V = (Kr/2)Σi(ri − r0i)2 + (Kθ/2)Σi(θi − θ0i)2 + Σi[A(1 + cosΦi) + B(1 + cos3Φi)] + 4εΣi<j−3S1[(σ/Rij)12 − S2(σ/Rij)6], where S1 = S2 = 1 for BB (attractive) interactions, S1 = 2/3 and S2 = −1 for LL and LB (repulsive) interactions, and S1 = 1 and S2 = 0 for all the other pairs involving N, expressing only excluded volume interactions. Kr = 231.2εσ−2 and Kθ = 20ε/rad2, with the equilibrium bond length r0i = σ and the equilibrium bond angle θ0i = 1.8326 rad. For visual clarity, slightly thicker lines were used for roots 1–4 than the thickness evaluated from the size of superbasins.
Landscape and Path Complexity Measures
The formation of a DG provides a network that can be analyzed in terms of the branch points, and the sizes of these branch points, at discrete energy levels. It is possible to define a pathway through a DG as a list of superbasins, starting with a high energy superbasin and moving to a low energy superbasin that may contain either a desired local minimum or the global minimum conformation [e.g., see the pathway (2, 1)V0 in Fig. 1].
The pathway that leads to a low energy (super) basin α will be referred to as root α. Two probability measures are defined associated with each superbasin along root α: the residential probability pr and the branching probability pb of superbasin (n,m)Vi at each energy level Vi. The residential probability is the probability of being located within the superbasin when at a specified energy level. The branching probability is the chance of taking the pathway leading to the specific superbasin when moving from the parent node n at Vi+1 to (several) node(s) at Vi. Thus, the residential and branching probabilities, when plotted as a function of Vi for the superbasins making up root α, indicate the change in size of root α's superbasins in relation to all other superbasins at each energy level Vi, and the probability of moving from Vi+1 to Vi along a chosen root α, respectively. The residential and branching probabilities are defined as
 |
 |
where v[(n,m)Vi] means the “size” of superbasin (n,m)Vi. The Σ′ sums over all superbasins belonging to energy level Vi, but the Σ″ sums only those superbasins at Vi which are connected to each other at the higher Vi+1 (see the detailed explanations in the legend of Fig. 1).
To quantify the topographical complexity of a DG we introduce a measure of “landscape complexity,” CL(Vi), at energy level Vi. The landscape complexity associated with energy level Vi is defined by the Shannon entropy of the relative size of superbasins (i.e., residual probability) at the chosen level,
where Σ′ is defined in Eq. 1. This definition produces a complexity of zero when there is only one unique superbasin and the largest complexity when the size of all superbasins (more than one) are equal at energy Vi. The landscape complexity measure can then be integrated over the energy range of the DG and normalized by this range, to give the overall landscape complexity C̄L,
 |
where Vmax and Vmin are the maximum and minimum energies in a given data set. This measure allows the classification of DG, providing a rigorous measure for the topographical complexity of the energy landscape.
A similar measure is defined for root α, based upon the branching probability of root α giving the “path complexity,” CP,α(Vi), at energy level Vi,
where Σ″ is defined in Eq. 2 and nα is the index of the parent node at a given energy level Vi along the root α. This definition produces a complexity of zero when no branching occurs at energy Vi and the largest complexity when many equally sized branches exist. As for CL(Vi), integration and normalization of CP,α(Vi) gives the overall path complexity C̄P,α, providing a measure with which to compare different roots.
Results and Discussion
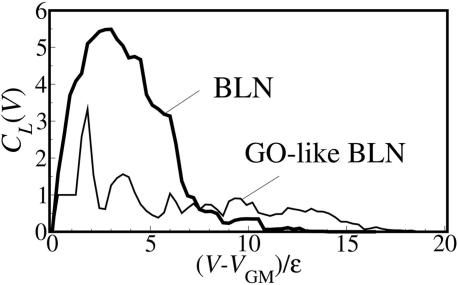
In Fig. 3, the landscape complexity is plotted for the BLN and Gō models as a function of energy relative to the global minimum (GM) energy VGM. For the frustrated BLN model, as the energy decreases from high to low energy regions, a large wide peak starts to appear around 7ε, implying high complexity spanning the energy range from 0 to 7ε that corresponds to the appearance of many thick branches in Fig. 2b. The calculation of the overall landscape complexity for the BLN model gives C̄L = 1.725. In contrast, for the Gō model, the landscape complexity remains small for a wide range of energy except one small sharp peak observed at 1.8ε that corresponds to the separation into 10 separate basins corresponding to the 10 lowest energy structures. For the Gō model, the overall landscape complexity is C̄L = 0.522, a much lower value than for the BLN model, reflecting the less complex nature of the landscape.
Fig. 3.
Landscape complexity as a function of energy above the global minimum energy for BLN and Gō models.
The ratio of folding temperature to glass temperature has been used as a measure to quantify the foldability of proteins (22). Our landscape complexity measures CL(Vi) and C̄L are also expected to quantify what degree the topographical features of underlying energy landscape represent “glass formers” or “structure seekers” for a vast number of systems.
It is known for a 38-atom Lennard–Jones cluster (2) that the global minimum, a face-centered-cubic truncated octahedron, has a narrower funnel on the complicated PES, when compared with the icosahedral second lowest minimum which is separated by a large potential barrier from the global minimum. The global landscape complexity C̄L evaluated as 2.503 indicates a frustrated landscape as for the BLN model protein.
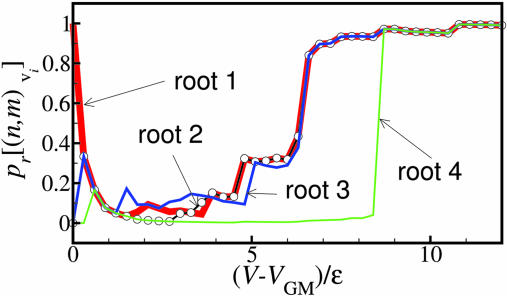
Next, let us look deeper into the question of how one can quantify the competition of a chosen path against the other multiple paths. In Fig. 2b, the frustrated BLN model exhibits many intertwined roots, indicating a PES in which several similar-sized superbasins and similar structures are separated by high energy barriers. As an example, the residential probabilities pr are shown along the roots leading to the 4 lowest energy structures for the BLN model (labeled in Fig. 2b) as a function of energy above the global minimum in Fig. 4. Root i corresponds to the pathway leading to the ith most stable minimum structure on the metric DG. Roots 1–4 for the BLN model all terminate in β-barrel structures which are less than 0.3ε above the GM, but are separated from each other by significant energy barriers. Roots 1–3 have a similar β-barrel core, but root 4 has a significantly different core. One can see that, as energy decreases from a high energy region, the probability of residing in root 4 suddenly drops off at ∼8ε, much earlier than the other roots (up to 8.4ε root 4 shares a common pathway with the other three roots). Root 2 shares a common pathway with root 1 until a much lower energy level (3.6ε). After separation from root 1 at 3.6ε, the residential probabilities of root 2 fall rapidly, with decreasing energy above the GM. Root 2 therefore is only able to act as an energy funnel over a narrow energy range. In contrast to roots 2 and 4, root 3 has a comparable residential probability to root 1. Root 3 shares a common pathway with roots 1 and 2 down to an energy of 6.6ε. This indicates that root 3 offers a very competitive funnel pathway on the energy landscape over an energy range similar to root 1 leading to the global minimum.
Fig. 4.
Residential probabilities pr as a function of energy above the global minimum VGM for the four lowest-energy roots of the BLN model. Roots: bold red line, 1; open-circle black line, 2; solid blue line, 3; and solid green line, 4.
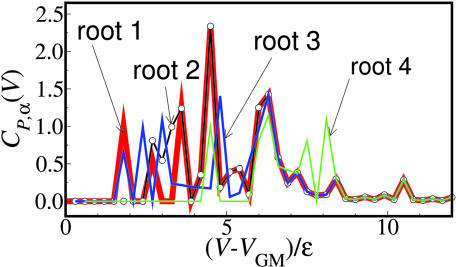
The folding rate of the BLN model starts to deviate from exponential behavior just below the collapse temperature, indicating that the folding process is controlled by multiple escape times from different low-lying energy traps (5, 15). Annealing simulations of the BLN model also shows the difficulty of terminating at the GM (12). In Fig. 5, we show the path complexities CP,α(Vi), along roots 1–4 of the BLN model. All four roots of the BLN model show many spikes over a wide energy range, indicating a large complexity over the whole energy range. There exist many regions of high complexity along the pathway to the global minimum, resulting in non-exponential behavior of the folding kinetics. The chance of finishing an annealing run at the end of root 1 is expected to be very small. On the other hand, as inferred from the ideal funnel landscape of the Gō model, there exist no large complexity regions along the course of folding until very low energy (not shown here).
Fig. 5.
Path complexity as a function of energy above the global minimum GM for the BLN model. Roots: bold red line, 1; open-circle black line, 2; solid blue line, 3; and solid green line, 4.
What can one learn from the residential probability and the path complexity plots along the chosen path and what is the difference between them? The residential probability tells us the possibility of choosing a given pathway at different energies, but the path complexity measure along the given path quantifies the diversity or uncertainty in the information content of the chosen path: Suppose that, from Vi+1 to Vi, a path α splits into the four branches with the same probability, i.e., 1/4, 1/4, 1/4, and 1/4, and the other path β splits into the four branches with different probability, e.g., 1/4, 1/2, 1/6, and 1/12. Although the (residential) probability of choosing the first branch is the same, 1/4 for both paths, the path complexity is 2 for path α but only 1.73 for path β from Vi+1 to Vi. The difference in path complexity arises from the relative size of the multiple competing paths that exist besides the chosen path. The former path with four equally-sized competing branches has the largest diversity of all possible sizes of the four branching paths. The path complexity also takes into account the number of the other branches, with which the path complexity increases monotonically. The path complexity can, thus, be regarded as a natural measure to quantify how a given path branches along the energy axis: the larger the path complexity, the more the branches compete in size and/or the greater the number of branches. For instance, from 3.3ε to 4.6ε, the residential probability for root 1 and the competing root 3 are similar, but the path complexity measures differ significantly from each other for these roots over this energy regime (Fig. 5). The path complexity measures for 3.3–4.6ε indicate that some competing branches exist within root 1 but not within root 3 (root 1 has two large spikes of CP,α at 3.6ε and at 4.5ε, while root 3 has an almost constant CP,α of 0.2).
In the inset of Fig. 2b ellipses indicate the branching regimes which correspond to large spikes in CP,α: 2.34 at 4.5ε for root 1 and 1.41 at 4.8ε for root 3. The spike at 6.3ε for most of the roots also corresponds to the biggest branch of the main root in the inset of Fig. 2b. In terms of the path complexity measure, one can easily quantify where and to what extent meandering paths are branched on the multidimensional energy landscapes. The overall path complexity C̄P reflects how often (on average) the system would experience competing branches for the chosen path per unit energy. The overall path complexity C̄P for roots 1, 2, 3, and 4 of the BLN model is 0.215, 0.234, 0.200 and 0.135, respectively, but for root 1 of the Gō model is 0.185. Roots 1, 2, and 3 of the BLN are more complex than root 4 and the single Gō root. This implies that the former roots have many significant branches along their paths and are less likely to end up in the desired minimum conformation, but the latter, with very fewer branch points on average, are more likely to reach the desired minimum conformation once the system has entered the root (Fig. 2b). For a 38-atom Lennard–Jones cluster (2), roots 1 and 2 leading to the truncated octahedron (global minimum) and icosahedral structure (second lowest minimum) have path complexities C̄P of 0.232 and 0.271, respectively. This implies that, although the path leading to the global minimum has been considered as a narrower funnel on the PES compared with the path leading to the second lowest minimum, the extent of competition among the multiple meandering and branched pathways inside the funnels is likely to be similar between the two routes once the system has decided to follow either of the two.
Conclusions
In this article, we have developed a new metric disconnectivity graph and new measures for quantifying the complexities of underlying energy landscapes and multiple pathways. The three-dimensional visualization of the DGs allows an intuitive understanding of the multidimensional energy landscape while the complexity measures bring a quantification of the complexity and properties of the landscape. As an illustrative example, we have demonstrated the versatility of this approach for the PES of the well studied BLN and Gō model proteins. The ideal funnel-like Gō landscape has lower topographical complexity (C̄L = 0.522) than that of the more frustrated BLN landscape (C̄L = 1.725). The energy dependency of landscape complexity CL can indicate an energy regime where branching and bifurcations of the main root become significant, making the system more likely to be trapped in one of several local minima during the annealing process. The path complexity of roots leading to different local minima indicates the uncertainty in following a pathway to a chosen minimum. The higher the path complexity, the more the system has significant branching points along the path and the lower the probability of ending up at the desired minimum. By investigating the dependency of the landscape and path complexity measures on the choice of energy bin ΔV to build connectivity relationships among superbasins, one can also assess the “ruggedness” of a PES which may be relevant to assess the topographical complexity of the FES as a function of temperature. It would also be interesting to see how the complexity measures can quantify intermediate character between the BLN and Gō models, which was recently observed by visual inspection of the disconnectivity graph of a salt-bridged 46-bead protein (23).
The application of these new measures and metric DGs to a vast number of different systems is crucial for looking into how these new complexity measures relate to the kinetics and dynamics of the systems. Our landscape and path complexity measures are quite general, irrespective of the kinds of energy [i.e., potential or free energy (9, 24)] and model. The landscape complexity is expected to offer a new measure to quantify the foldability of proteins in terms of the topographical complexity associated with the energy landscape as the ratio of folding and glass temperatures, which can classify a vast number of energy landscapes for different systems as “glass formers” or “structure seekers.”
Acknowledgments
We thank Dr. Semen Trygubenko and Dr. David J. Wales (University of Cambridge, Cambridge, U.K.) for providing us with the database of stationary points for the 46 bead model protein. R.L.J. and G.J.R. were supported by the Royal Society (Japan–United Kingdom Joint Project 15208), the Engineering and Physical Sciences Research Council, and the Wellcome Trust. T.K. was supported by the Japan Society for the Promotion of Science, Japan Science and Technology Agency/Core Research for Evolutional Science and Technology, Grant-in-Aid for Research on Priority Areas “Control of Molecules in Intense Laser Fields” and “Systems Genomics,” and 21st Century Center Of Excellence of “Origin and Evolution of Planetary Systems” (Kobe University). Y.M. was supported by Japan Society for the Promotion of Science Research Fellowships for Young Scientists.
Abbreviations
- BLN
hydrophobic, hydrophilic, and neutral
- DG
disconnectivity graph
- FES
free energy surface
- PES
potential energy surface
- GM
global minimum.
Footnotes
The authors declare no conflict of interest.
References
- 1.Becker OM, Karplus M. J Chem Phys. 1997;106:1495–1517. [Google Scholar]
- 2.Wales DJ, Miller MA, Walsh TR. Nature. 1998;394:758–760. [Google Scholar]
- 3.Wales DJ. Energy Landscapes. Cambridge, UK: Cambridge Univ Press; 2003. [Google Scholar]
- 4.Guo Z, Brooks CL., III Biopolymers. 1997;42:745–757. doi: 10.1002/(sici)1097-0282(199712)42:7<745::aid-bip1>3.0.co;2-t. [DOI] [PubMed] [Google Scholar]
- 5.Nymeyer H, Garcia AE, Onuchic JN. Proc Natl Acad Sci USA. 1998;95:5921–5928. doi: 10.1073/pnas.95.11.5921. [DOI] [PMC free article] [PubMed] [Google Scholar]
- 6.Stillinger FH, Weber TA. Science. 1984;225:983–989. doi: 10.1126/science.225.4666.983. [DOI] [PubMed] [Google Scholar]
- 7.Doye JPK, Wales DJ. J Chem Phys. 2002;116:3777–3788. [Google Scholar]
- 8.Wales DJ, Doye JPK. J Chem Phys. 2003;119:12409–12416. [Google Scholar]
- 9.Krivov SV, Karplus M. J Chem Phys. 2002;117:10894–10903. [Google Scholar]
- 10.Krivov SV, Karplus M. Proc Natl Acad Sci USA. 2004;101:14766–14770. doi: 10.1073/pnas.0406234101. [DOI] [PMC free article] [PubMed] [Google Scholar]
- 11.Honeycutt JD, Thirumalai D. Proc Natl Acad Sci USA. 1990;87:3526–3529. doi: 10.1073/pnas.87.9.3526. [DOI] [PMC free article] [PubMed] [Google Scholar]
- 12.Berry RS, Elmaci N, Rose JP, Vekhter B. Proc Natl Acad Sci USA. 1997;94:9520–9524. doi: 10.1073/pnas.94.18.9520. [DOI] [PMC free article] [PubMed] [Google Scholar]
- 13.Guo ZY, Thirumalai D. Biopolymers. 1995;36:83–102. [Google Scholar]
- 14.Guo ZY, Thirumalai D. J Mol Biol. 1996;263:323–343. doi: 10.1006/jmbi.1996.0578. [DOI] [PubMed] [Google Scholar]
- 15.Guo Z, Brooks CL III, Boczko EM. Proc Natl Acad Sci USA. 1997;94:10161–10166. doi: 10.1073/pnas.94.19.10161. [DOI] [PMC free article] [PubMed] [Google Scholar]
- 16.Miller MA, Wales DJ. J Chem Phys. 1999;111:6610–6616. [Google Scholar]
- 17.Shea J-E, Onuchic JN, Brooks CL., III J Chem Phys. 2000;113:7663–7671. [Google Scholar]
- 18.Brown S, Fawzi NJ, Head-Gordon T. Proc Natl Acad Sci USA. 2003;100:10712–10717. doi: 10.1073/pnas.1931882100. [DOI] [PMC free article] [PubMed] [Google Scholar]
- 19.Komatsuzaki T, Hoshino K, Matsunaga Y, Rylance GJ, Johnston RL, Wales DJ. J Chem Phys. 2005;122:084714. doi: 10.1063/1.1854123. [DOI] [PubMed] [Google Scholar]
- 20.Becker OM, MacKerell AD Jr, Roux B, Watanabe M, editors. Computational Biochemistry and Biophysics. New York: Dekker; 2001. [Google Scholar]
- 21.Levy RM, Srinivasan AR, Olson WK, McCammon JA. Biopolymers. 1984;23:1099–1112. doi: 10.1002/bip.360230610. [DOI] [PubMed] [Google Scholar]
- 22.Onuchic JN, Wolynes PG. Curr Opin Struct Biol. 2004;14:70–75. doi: 10.1016/j.sbi.2004.01.009. [DOI] [PubMed] [Google Scholar]
- 23.Wales DJ, Dewsbury PEJ. J Chem Phys. 2004;121:10284. doi: 10.1063/1.1810471. [DOI] [PubMed] [Google Scholar]
- 24.Evans DA, Wales DJ. J Chem Phys. 2003;118:3891–3897. [Google Scholar]


