Abstract
Gene expression of intrinsically fluorescent proteins in biological systems offers new noninvasive windows into cellular function, but optimization of these probes relies on understanding their molecular spectroscopy, dynamics, and structure. Here, the photophysics of red fluorescent protein (dsRed) from discosoma (coral), providing desired longer emission/absorption wavelengths, and an improved yellow fluorescent protein mutant (Citrine) (S65G/V68L/Q69 M/S72A/T203Y) for significant comparison, are characterized by using fluorescence correlation spectroscopy and time-correlated single-photon counting. dsRed fluorescence decays as a single exponential with a 3.65 ± 0.07-ns time constant, indicating a single emitting state/species independent of pH 4.4–9.0, in contrast with Citrine. However, laser excitation drives reversible fluorescence flicker at 103-104 Hz between dark and bright states with a constant partition fraction f1 = 0.42 ± 0.06 and quantum yield of ≈3 × 10⁻³. Unlike Citrine (pKa≈5.7), pH-dependent proton binding is negligible (pH 3.9–11) in dsRed. Time-resolved anisotropy of dsRed reveals rapid depolarization (211 ± 6 ps) plus slow rotational motion (53 ± 8 ns), in contrast with a single rotational time (16 ± 2 ns) for Citrine. The molecular dimensions, calculated from rotational and translational diffusion, indicate that dsRed is hydrodynamically 3.8 ± 0.4 times larger than predicted for a monomer, which suggests an oligomer (possibly a tetramer) configuration even at ≈10−9 M. The fast depolarization is attributed to intraoligomer energy transfer between mobile nonparallel chromophores with the initial anisotropy implying a 24 ± 3° depolarization angle. Large two-photon excitation cross sections (≈100 GM at 990 nm for dsRed and ≈50 GM at 970 nm for Citrine), advantageous for two-photon-fluorescence imaging in cells, are measured.
Red-fluorescent protein (dsRed) from a coral of the discosoma genus (1, 2) provides intrinsic red-shifted absorption and emission that are desirable features in a noninvasive fluorescent label for multiphoton and conventional fluorescence microscopy imaging for biological studies of intracellular activities. Furthermore, dsRed can be used as an acceptor in a fluorescence resonance energy transfer pair with enhanced green fluorescent protein (EGFP) or yellow fluorescent protein (YFP) mutants. Newly designed YFP mutant Citrine (S65G/V68L/Q69 M/S72A/T203Y), one of the longest wavelength mutants of the green fluorescent protein (GFP), is also studied here for comparison. This new protein is identical in sequence to the reported mutant 10C (3) except for replacement of Gln-69 by Met, which confers several useful properties. Compared with other yellow GFP mutants, Citrine is more resistant to acid quenching, less sensitive to chloride, and more easily expressible at 37°C. A complete analysis of the biochemical properties of Citrine, its use as an intracellular probe, and the effects of the Q69 M substitution on several different GFP constructs will be reported in detail elsewhere (G.S.B. & R.Y.T., unpublished work).
Fluorescence correlation spectroscopy (FCS) (4–6) provides an elegant method to probe the diffusion times (τD) of fluorophores in an optically defined excitation volume (beam waist 1/e2≈R) and thus the molecular diffusion coefficient (D) can be calculated by using τD ∝ R2/4D. Furthermore, inter- and intramolecular dynamics that influence the fluorescence characteristics on a time scale faster than τD can be measured (7). Fluorescence flicker of EGFP because of reversible binding of an external proton to the chromophore occurs on a tens-of-microseconds time scale (8), and the rate constants, pKa, enthalpy, and entropy of the reaction were characterized. An additional flicker, with a mean dark fraction ≈13%, slightly sensitive to the illumination intensity, was also observed independent of pH. These findings triggered studies discovering fast intensity- and pH-dependent flicker in T203Y and T203F by using FCS (9). The goal was to separate the two effects (pH and intensity) on the protein fluorescence flicker and to compare with the slow (a few seconds) fluorescence blinking, reported by Dickson et al. (10) on immobilized individual proteins. The on/off switching was attributed to photoconversion among the anionic, intermediate, and neutral states of the chromophore (10).
In this report, we have studied dsRed and Citrine using FCS to measure D, photobleaching quantum yield (Φb), proton-binding kinetics, and light-driven flicker, as the protein undergoes photoconversion between bright and dark states. The excited state dynamics are also studied by using time-correlated single-photon counting (TCSPC) (11). As an adequate representation of our results, the “dark” state, to be called the “neutral” state, is associated with both the externally protonated neutral molecule and the essentially neutral states of the chromophore (i.e., the chromophore plus the surrounding hydrogen-bond network in the protein environment) within the anionic protein. The “bright” state is associated with the unprotonated molecular anion to be called the “anionic” state. Because multiphoton fluorescence microscopy (12) is particularly suited for intracellular studies, the two-photon (2P) excitation cross-section spectra of both dsRed and Citrine are also measured.
Materials and Methods
Citrine was created with the QuickChange Site-Directed Mutagenesis Kit (Stratagene) by using the cDNA coding for the mutant 10C Q69K (13). Both dsRed (CLONTECH) and Citrine DNAs were cloned into the vector pRSETB (Invitrogen). Proteins were produced in JM109 (DE3) Escherichia coli (1), purified by nickel chelate chromatography on NiNTA-agarose, dialyzed against 10 mM Tris⋅HCl, pH 7.5. They were stored at 4°C before dilution into buffers at various pH for spectroscopy. One-photon absorption spectra were measured with a single-beam HP-8451-A Diode Array Spectrometer, whereas the fluorescence spectra were recorded by using a PTI-QM-1 fluorimeter. The experimental setup and data analysis for 2P-excitation cross-section measurements will be described elsewhere (A.A.H., S.T.H. & W.W.W., unpublished work).
For FCS measurements, Ar+-laser lines (488 or 514 nm) were selected by interference filters, reflected by a dichroic mirror, and focused by a 1.15 numerical aperture/40× water immersion objective onto the sample, held in a 200-μl-deep well glass slide. Fluorescence was collected through the same objective, a dichroic mirror, and 525 ± 50 nm (Citrine) or 580 ± 50 nm (dsRed) filters and focused by a 150-mm achromat into an optical fiber (50 μm diameter). The fluorescence signal was detected by a fiber-coupled avalanche photodiode (APD) (SPCM-AQ-141-FC; EG & G, Salem, MA). The APD signal was processed by using a correlator card (ALV5000; ALV Laser, Germany), and correlation curves were fitted by using the following function (9):
 |
1 |
where N denotes the mean number of fluorescent molecules diffusing within the excitation volume. Diffusion kinetics in the Gaussian intensity profile (with axial-to-lateral dimension ratio ω) are characterized by the factors containing diffusion time (τD). The exponential decay terms describe the dynamics of m independent transition pathways between states of different spectroscopic properties, e.g., protonated and deprotonated states (8) or generally photoconversion between any bright and dark states including singlet/triplet (14). The fraction fi of molecules residing in a dark state for τi duration can be determined from the measurements; for diffusion alone, fi = 0.
Time- and polarization-resolved fluorescence measurements were carried out by using a TCSPC setup consisting of IR-femtosecond laser pulses from a mode-locked Ti/Sapphire laser pulse-picked (4 MHz) frequency doubled to generate 490- and 405-nm wavelengths, and then focused into the sample (≈5 μM) in a 3 × 3-mm quartz cell. Dispersed right-angle fluorescence was imaged onto a microchannel plate mounted at the exit slit of a spectrometer and then amplified before single photons were detected during each start/stop cycle (11) by using a PC-controlled single-photon-counting module (SPC-430; Becker & Hickl, Berlin). The instrument response (FWHM≈60 ps) was measured routinely and used for deconvolution in a nonlinear least-squares fitting routine based on Marquardt's algorithm (11). Magic-angle (54.7°) detection was used to eliminate the rotational effects on the measured fluorescence decays. For the time-resolved fluorescence anisotropy (11, 15), parallel (//) and perpendicular (⊥) fluorescence polarization was selected by using a Glan–Thompson prism mounted at the entrance slit of the spectrometer. The G-factor, which accounts for the polarization sensitivity of the spectrometer grating as a function of wavelength, was estimated experimentally (11, 15).
Results And Discussion
Spectroscopy.
One- and two-photon steady-state spectra.
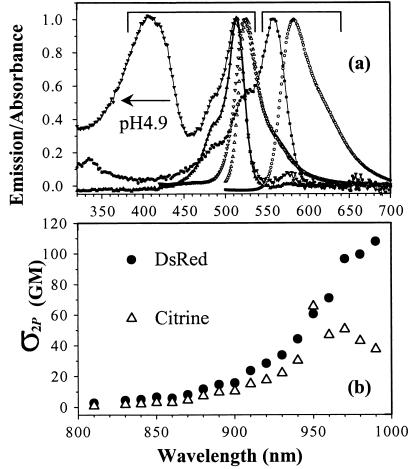
In agreement with Baird et al. (1), dsRed (pH 9.0) shows a strong absorption at 559 nm with two minor shoulders at 526 and 490 nm (Fig. 1). The fluorescence emission peaks around 583 nm and should be useful in cellular studies to enable avoidance of the cellular autofluorescence complications. Mutations of wild-type (wt) GFP aim to enhance and red shift the anionic (deprotonated) state transition (strongly fluorescent) while minimizing the neutral (protonated) state population (weakly fluorescent) (3). Amino acid substitutions Ser-65→Gly (e.g., Citrine, T203Y, T203F) and Ser-65→Thr (e.g., EGFP, S65T) destabilizes the neutral state of the chromophore by reducing solvation of the anionic form of the Glu-222 side chain (16). However, the neutral (S0N) ground state population of the essentially neutral chromophore can be enhanced by the environmental pH through proton exchange with the buffer to form an overall neutral molecular system as shown in EGFP (8), T203Y, and T203F (9). Comparative FCS studies (8) on EGFP and Y66W confirmed that the hydroxyl group in Y66 is the site for the external proton localization. Substitution of Thr-203 amino acid in YFPs (e.g., T203Y, T203F, Citrine) is responsible for the bathochromic shift of the anionic state transition by π-electron stacking (3) with the Y66 moiety. The neutral state absorption (≈412 nm) in Citrine is enhanced at low pH, whereas the main absorption band at 514 nm is reduced by a factor of ≈3.7 (Fig. 1a). This red shift (≈17 nm) of the neutral absorption, compared with ≈395-nm absorption in other GFP mutants (3), suggests a small modification of the immediate surroundings of the neutral chromophore. The blue wing of the main emission band (524 nm) is also affected at low pH, possibly because of the neutral excited S1N-state emission. Comparison with the analogous mutant, T203Y (S65G/S72A/T203Y) (9, 10), suggests that Q69 M might play an important role in altering the spectroscopy and pKa (see below) in neutral Citrine, based on the decreased polarity of Met compared with Gln.
Figure 1.
Absorption and emission spectra of dsRed and Citrine. (a) Normalized one-photon absorption (solid line and points) and emission (open points) spectra of dsRed (●○) and Citrine (▴▾▵▿), at pH 9. A new absorption band (▾) of Citrine appears (412 nm) in pH 4.9 buffer whereas its emission (▿) reveals a broader blue wing of the 524-nm band. The nonnormalized 514-nm absorption band of Citrine in pH 9 is ≈3.7 times weaker in pH 4.9 before normalization. (b) The 2P-excitation cross section of dsRed (●) and Citrine (○) over the 730–990 nm, where GM = 10−50 cm4⋅s/photon. Note that σ2P of dsRed continues to rise at 990 nm.
2P-excitation cross-section (σ2P) spectra of dsRed and Citrine (Fig. 1b) were measured at pH 9.0 over the range 730–990 nm by using fluorescein and rhodamine B (17) as references. Extinction coefficients ɛ≈75,000 (dsRed) and 80,000 (Citrine) cm−1⋅M−1 plus fluorescence quantum yield Qf≈0.75 were used. The σ2P-value (≈100 GM at 990 nm) for dsRed is comparable with EGFP (≈113 GM in pH 11; unpublished work) and may have even higher σ2P as the excitation wavelength (λex) approaches twice the one-photon-absorption peak of 558 nm. At 970 nm, σ2P≈50 GM was observed for Citrine. A large σ2P is desirable for cellular imaging by using multiphoton fluorescence microscopy (12), and the maxima are located well above 800 nm, which minimizes photodamage in biological preparations and maximizes penetration depth for deep-tissue imaging.
Dynamics: Fluorescence Flicker.
Light-driven flicker.
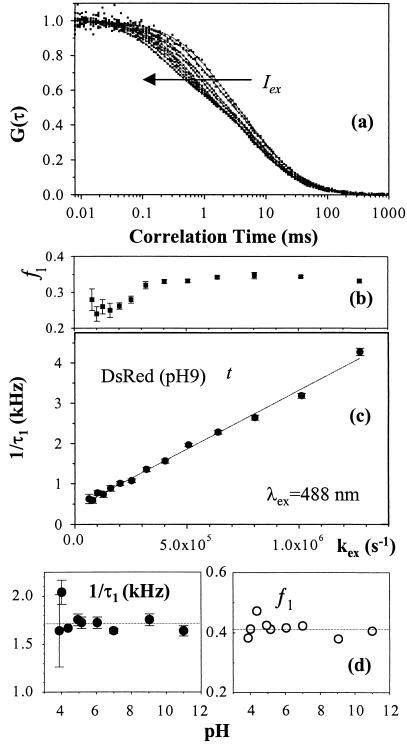
In addition to diffusion, the FCS correlation curves of dsRed (pH 9, Fig. 2a) vary with illumination intensity at 488 nm, indicating the presence of intramolecular photoconversion dynamics on ≈0.04 − 1-ms time scale in addition to diffusion. At low intensity, the measured correlation curves are best described by one exponential term with time constant τ1 and fraction f1 in addition to diffusion (Eq. 1). The flicker rate (τ1−1) increases linearly with the excitation rate (kex) at a photoconversion quantum yield Φ1 = Δτ1−1/Δkex = 2.9 ± 0.2 × 10⁻³ (Fig. 2c). The fraction f1 = 0.30 ± 0.06 seems to be nearly independent of intensity, implying that photoconversion occurs in both directions (dark ⇔ bright). However, f1 appears to decrease at very low intensity, indicating spontaneous transitions from the dark to the anionic ground state at ≈400 ± 30 Hz as suggested by the extrapolation of τ1−1 as kex→0. At kex = 514 nm, f1 = 0.42 ± 0.06 and Φ1 = 1.3 ± 0.3 × 10⁻³, suggesting that the quantum yield for the reverse photoconversion is kex dependent. Above the apparent saturation (ISat≈17 kWcm−2), the flicker rates become nonlinear in the excitation rate without reaching a limiting value, and an additional exponential term is required as expected for singlet–triplet intersystem crossing. Similarly, Citrine (pH 9) also flickers by photoconversion generating a dark fraction (0.37 ± 0.02) with Φ1 = 3.5 ± 0.6 × 10⁻³ under 488-nm illumination. Both the flicker fraction and quantum yield agree with FCS studies on T203Y (9). The flicker fraction and rates of dsRed are independent of pH (Fig. 2d).
Figure 2.
Fluorescence correlation spectra of dsRed. (a) Excitation intensity dependence of photoconversion kinetics of dsRed (pH 9.0) FCS correlation curves as a function of kex at 488 nm (≈0.4–7.3 kW/cm2). (b) Light-driven fluorescence flicker fraction and (c) rates of dsRed. The dark fraction (f1 = 0.30 ± 0.04) appears constant below saturation (with a minor decline at low kex and the rate depends linearly on intensity with a slope of (2.9 ± 0.2) × 10−3 and an intercept of 400 ± 30 Hz as kex→0. Autocorrelation spectra of dsRed (a) at low kex show lack of pH dependence in the pH range 3.9 to 11. (d) The fluorescence flicker rate (1.7 ± 0.1 × 10³ s−1) and dark fraction (0.41 ± 0.03) are clearly independent of pH.
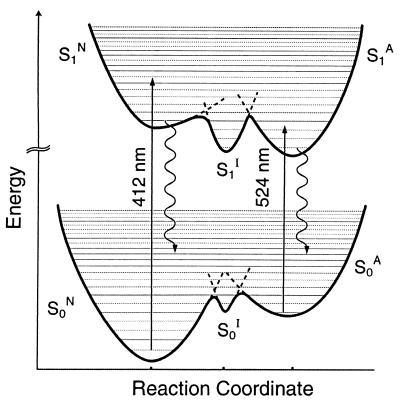
Fluorescence blinking of immobilized individual T203Y and T203F mutants with a time scale of a few seconds has been observed by using wide-field microscopy, with on/off switching attributed to a slow photoconversion between the anionic, intermediate, and neutral states of the chromophore (10). The fluorescence recovery is thought to occur via an internal proton transfer on the excited-state potential energy surface (PES) (3, 18–20) after 405-nm irradiation. Fast flicker of these mutants was later discovered and studied by using FCS (9). In dsRed and Citrine, similar excitation-driven fluorescence flicker observed in this report by using FCS can also be attributed to a reversible internal proton transfer reaction between the anionic S0A and intermediate S0I (and possibly the neutral S0N) ground states, on the basis of the energetics of the transitions. The observed increase of the photoconversion rate with excitation rate kex shows that the excited-state PES serves as the gateway for the reported flicker process. After the anionic state S0A→S1A transition, the excited state relaxes radiatively (i.e., large Qf), and different vibrational levels on the S0A-state PES will be populated. However, there is a small probability (Φ1≈10−3) that the chromophore photoconverts to virtually dark S0I and S0N states according to our excited-state dynamics (see TCSPC results below). The dark-to-bright state photoconversion transition appears to follow the reverse route, because ƒ1 remains fairly kex independent.
pH-dependent flicker.
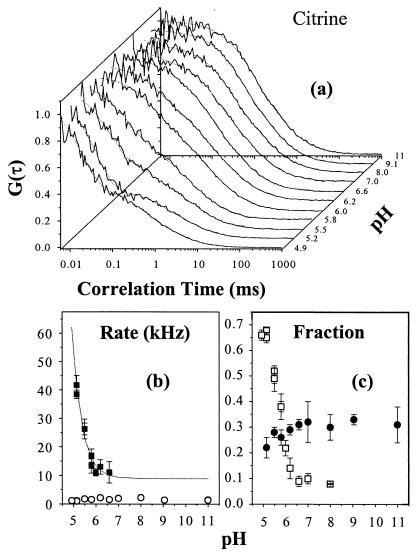
The fluorescence autocorrelation of dsRed, excited at 488 nm, is insensitive to the environmental pH over the range 3.9–11 (Fig. 2d). Thus, the correlation functions at 3.9 ≤ pH ≤ 11 are identical to the right-hand curve in Fig. 2a. These results indicate the absence of external proton binding kinetics in dsRed in contrast with EGFP (8), T203Y (9), and Citrine (Fig. 3). The fluorescence autocorrelation of Citrine at low pH requires two exponential terms in addition to diffusion, implying the existence of two routes for the bright-to-dark state flicker: pH-dependent proton binding and excitation-driven photoconversion transitions. For a reversible proton-binding reaction, the flicker rate τ2−1≈k+[H+] + k_ and fraction f2 = Ke[H+](1 + Ke[H+])−1 with equilibrium constant Ke = k+/k_, where k+ is the protonation and k_ is the deprotonation rate constant (7, 10). The estimated rates are k+ = 4.5 ± 0.4 × 10⁹ M−1⋅s−1 and k_ = 9 ± 1 × 10³⋅s−1 with pKa = log(k+/k_) = 5.7 ± 0.1 for Citrine with an estimated standard free energy ΔrG0 = 32.7 ± 0.5 kJ/mol at room temperature. These parameters differ slightly from T203Y (9), where k+≈1.4 × 10⁹ M−1⋅s−1, k_≈7 × 10³⋅s−1, pKa≈5.3, and ΔrG0≈30.4 kJ/mol. The concentration of halide or nitrate ions are known to affect pKa of YFPs that contain Thr-203→Tyr; for example, the pKa of T203Y ranges from 5.2 to 7.0 over a chloride concentration range of 0–400 mM (21). Therefore, changes in chloride ion concentration may complicate the use of YFPs as pH indicators in living cells. Citrine represents an alternative pH indicator, which is insensitive to the chloride concentration and exhibits desirable spectroscopic features with long absorption/emission wavelength. The pH-independent flicker rate τ 1−1 = 1.6 ± 0.4 × 10³⋅s−1 and the dark fraction f1 = 0.30 ± 0.06 (Fig. 3) represent the light-driven photoconversion process in Citrine. These photoconversion processes do require intensity control in the applications of these fluorescent proteins as pH indicators.
Figure 3.
FCS measurements of Citrine, as a function of pH, reveal an external protonation process. (a) The correlation functions, (b) rate constants (■) with the best fit (dotted line; see text), and (c) fractions (□) for proton binding. (b) The pH-independent photoconversion rate τ1−1 =1.6 ± 0.4 × 10³⋅s−1 (○) and (c) dark fraction (●) f1 = 0.30 ± 0.06 are superimposed.
First Excited Electronic-State Dynamics.
The first excited electronic S1-state fluorescence relaxation in most fluorophores takes place on fast time scales (10−11 − 10−8 s), compared with the diffusion and flicker dynamics (10−6 to 10−1 s) observed with FCS, and provides a sensitive probe of the molecular environment. The excitation-energy dependence of these dynamics provides insights into the molecular states that underlie the fluorescence emission in complex systems such as dsRed and Citrine. Here we present the fluorescence dynamics of the anionic (low-energy)- and neutral (high-energy)-state transitions of the chromophores by using TCSPC.
Low-Energy Transition.
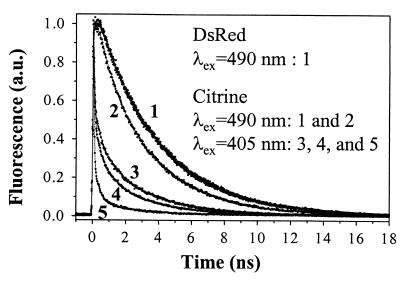
The S1-state fluorescence decays of 490-nm-excited dsRed with a single exponential fit with 3.65 ± 0.08-ns time constant, independent of pH (4.4–9.0), indicating the existence of only one fluorescent excited state (Fig. 4). Electronic states in the low-energy transition of wt GFP (3, 19, 20) and several of its mutants including EGFP (unpublished work) have an anionic character (3) with S1A lifetime of ≈2.9–3.7 ns. Theoretical studies and mass spectroscopy of dsRed (1, 2) predict the main features of the embodied chromophore in GFP are preserved in dsRed, as suggested by sequence comparison between dsRed and wt GFP (22). Therefore, it is most likely that the electronic transition in dsRed, with maximum absorption at 553 nm, is anionic (S0A→S1A; Fig. 5), analogous to most GFP mutants.
Figure 4.
First excited electronic-state fluorescence decays of dsRed and Citrine by using TCSPC. First excited anionic (S1A, λex = 490 nm), and neutral (S1N, λex = 405 nm) state dynamics of dsRed and Citrine. After 490-nm excitation of dsRed (pH 9), the fluorescence decays as a single exponential with τf = 3.67 ns and χ2 = 1.08 (curve 1), whereas τf = 3.61 ns and χ2 = 1.06 (curve 1) for Citrine. Unlike dsRed, Citrine fluorescence exhibits a biexponential decay (curve 2: τf1 = 3.31 ns, τf2 = 880 ps, amplitude ratio a2/a1≈0.26, and χ2 = 1.06) at pH 4.9. The fluorescence decays (curves 3–5), following the S0N→S1N transition in Citrine (pH 4.9) by using 405 nm, are also shown as function of detection wavelength: λf = 460 nm (curve 5: τf1 = 24 ps, τf2 = 268 ps, τf3 = 2.11 ns, amplitude ratios a2/a1≈0.11, a3/a1≈0.04, and χ2 = 1.06); λf = 500 nm (curve 4: τf1 = 51 ps, τf2 = 452 ps, τf3 = 2.63 ns, a2/a1≈0.16, a3/a1≈0.06, and χ2 = 1.21); and λf = 520 nm (curve 3: λf1 = 54 ps, λf2 = 712 ps, λf3 = 3.12 ns, a2/a1≈0.19, a3/a1≈0.16, and χ2 = 1.28).
Figure 5.
Schematic PES of the anionic (S0A→S1A) and neutral (S0N→S1N) and intermediate (S0I→S1I) state transitions in Citrine. The reaction coordinate is presumably internal proton transfer between the chromophore, particularly Y66, and the immediate hydrogen bond network (3). The crossing point between PESs along the reaction coordinate forms a barrier whose height and width depend on pH and mutation type/site. The anionic S1A state of Citrine decays via fluorescence at a rate τf−1 and, consequently, a range of vibrational levels on the S0A-PES will be populated followed by a probability for nonradiative vibrational relaxation to the bottom of the S0A, S0I, and S0N PESs depending on the barriers. Fluorescence decays of the neutral S1N state of Citrine chromophore suggest an efficient nonradiative channel (e.g., intramolecular excited-state proton transfer) that competes with fluorescence. It is most likely that the S1 state in dsRed has anionic character analogous to most GFP mutants (1, 2), and the neutral state S0N→S1N transition probability is negligible.
In Citrine and other YFPs (3), the phenolate anion is stacked with a π-electron system causing a red shift of the anionic S0A→S1A transition (Fig. 5). Consequently, the anionic excited state in Citrine is stabilized according to the energetics and the S1A lifetime (τf = 3.61 ± 0.03 ns at pH 9, Fig. 4) relative to wt GFP with τf≈3.3 ns. However, an additional τf2≈880-ps decay component was observed at pH 4.9 with amplitude ratio a2/a1≈0.26. Because the red tail of protonated neutral state absorption (Fig. 1a) at 490 nm is much less than 0.2, we believe that the 880-ps decay component can be attributed to the intermediate excited S1I state of Citrine. Furthermore, the slow component (τ1≈3.3 ns), Fig. 4, slightly shorter than the S1A-state lifetime, may indicate that the barrier height between the S1A and the S1I state is reduced in low pH environment and facilitating barrier crossing as a nonradiative pathway. In other words, the anionic, intermediate, and neutral states of Citrine can be excited with relative populations that depend on pH and excitation wavelength (see below).
High-Energy Transition.
Ser-65→Gly in Citrine suppresses the neutral state absorption as in T203Y and T203F. However, the neutral state absorption of Citrine at 412 nm is enhanced (Fig. 1a), compared with the 395 nm in T203Y and wt GFP, on external protonation by the low-pH buffer according to our FCS results. The neutral state transition in other GFP mutants (e.g., T203Y) can be probed via the blue (≈460 nm) emission tail of the main band (524 nm) and reveals a more complex relaxation pathway as multiexponential fluorescence decays (16, 20). After 405-nm excitation of Citrine (pH 4.9), the emission spectrum (Fig. 1a) exhibits a broadening of the blue wing of the 524-nm band, and in the time domain, this fluorescence decays as a multiexponential where the fitting parameters depend on the detection wavelength (λf) (Fig. 4). The ultrafast time constant (≈40 ps) is attributed to the neutral state S1N→S0N transition with an efficient nonradiative pathway because of the excited-state proton transfer (≈10–150 ps) observed in 405-nm excited GFP mutants (18–20), or possibly photoisomerization (9). The second component (400–800 ps), with an amplitude ratio that increases with λf (460–560 nm), is likely to represent the relatively nonradiative intermediate state S1I→S0I relaxation. In Citrine at low pH, the third decay component (τf3≈3.3 ns) is slightly faster than the S1A-state lifetime (3.61 ns), indicating that the barrier height between the S1A and S1I state is reduced in low pH environment, facilitating barrier crossing. These comparative excited-state dynamics as a function of the excitation energy suggest that the fluorescence quantum yield depends on λex.
Over the pH range 4.9–9.0, dsRed does not absorb significantly around 395 nm, but the residual absorption around that wavelength is slightly above the baseline (Fig. 1). The fluorescence detected at λf ≥ 583 nm builds up for a few picoseconds (34 ± 10 ps), when dsRed is excited at 405 nm, before decaying at a rate (3.68 ns)−1 similar to the anionic state fluorescence. Furthermore, the fluorescence detected at 560-nm decays as a biexponential with a fast (412 ± 49 ps) component of small amplitude ratio (≈0.13). These features can be attributed to a minor neutral state transition in the dsRed chromophore followed by excited-state proton transfer to the anionic state before fluorescing. The light-driven flicker observed by FCS in dsRed supports this argument. It is also possible that a small residue of immature green species (1) acts as a donor in fluorescence resonance energy transfer pair with mature dsRed.
Molecular Hydrodynamics and Protein Configurations.
The fluorescence intensity of weakly illuminated fluorophore increases linearly with laser intensity with a constant molecular diffusion time (τD) in these FCS studies. The three-dimensional-lateral diffusion coefficient (D) of dsRed (2.6 ± 0.2 × 10⁻¹¹ m2⋅s−1) is slow compared with (4.0 ± 0.2) × 10−11 m2⋅s−1 for Citrine (pH 9.0), as measured relative to rhodamine green [D≈2.8 × 10⁻¹⁰ m2⋅s−1 (23)]. The Stokes–Einstein equation, D = KBT/6πaη, relates D and the effective hydrodynamic radius (a), where KB, T, and η are the Boltzmann constant, temperature (300 K), and viscosity (η≈1 × 10⁻³⋅kgm−1⋅s−1), respectively. The hydrodynamic radius of dsRed (8.1 ± 0.3 nm) is ≈1.5 times larger than that of Citrine (3.9 ± 0.2 nm). For a spherical shape, this implies an effective volume 3.6 ± 0.2 times larger.
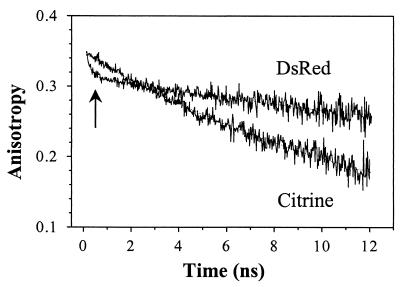
For further comparison, the rotational correlation time (φ) of the excited-state dipole moments in dsRed and Citrine were measured by using time-resolved fluorescence anisotropy. The anisotropy of Citrine decays as a single exponential with a rotational correlation time φC = 16 ± 2 ns (Fig. 6), which is independent of λex and pH within the experimental uncertainty. These results agree with the rotational correlation time (≈16 ns) of wt GFP and S65T (24). The fluorescence anisotropy of dsRed reveals a quite different behavior through a biexponential decay including a fast (φF = 211 ± 6 ps) and a slow (φS= 53 ± 8 ns) rotational time, that is ≈3.3 ± 0.6 times slower than Citrine, implying a larger effective hydrodynamics volume for dsRed. The slower rotational time in dsRed increased with buffer viscosity (by adding glycerol) whereas the faster rotational time was not affected. Although rotational times that are significantly longer than the excited-state fluorescence lifetimes are difficult to measure accurately (11, 15), these results were reproducible with the stated precision. The effective volume (V) of a molecule can be determined from the rotational diffusion time, V = KBTφ/η, assuming a spherical shape. For dsRed, the volume V = 220 ± 30 nm3 compared with 66 ± 8 nm3 for Citrine implies an effective volume for dsRed that is 3.4 ± 0.6 times larger than Citrine.
Figure 6.
Time-resolved fluorescence anisotropy of dsRed and Citrine (pH 9.0) by using TCSPC. The anisotropy of 490-nm excited Citrine decays as a single exponential with rotational time φ = 16 ± 2 ns. To the contrary, dsRed anisotropy decays as a biexponential under the same experimental conditions, with a fast φf = 211 ps (indicated by ↑) and a slow φS = 53 ± 8 ns rotational time with fast-to-slow amplitude ratio of ≈0.13.
Both translational and rotational diffusion experiments suggest that dsRed exists in an oligomer configuration even at ≈10−9 and 10−6 M used in the FCS and TCSPC experiments, respectively. On the basis of FCS results at ≈1 nM, an upper bound for the dissociation constant is ≤10−9 M. Baird et al. postulate that dsRed is an oligomer (tetramer) in its most stable configuration (1). Within experimental uncertainty, our estimated rotational time (i.e., protein volume) agrees with the tetramer hypothesis of dsRed configuration.
The single-exponential decay of the Citrine anisotropy, at a rate consistent with expected hydrodynamic volume, and a steady-state initial anisotropy (r0 = 0.39 ± 0.01), suggests immobility of the chromophore inside its β barrel. However, the dsRed chromophore seems to undergo internal depolarization on a ≈211-ps time scale, whereas the overall rotational motion of the protein occurs with a ≈53-ns period. The steady-state anisotropy (r0 = 0.30 ± 0.02) and internal depolarization of dsRed are consistent with an energy transfer between nonparallel transition dipoles of neighboring chromophores forming individual oligomers. Rocking of a less constricted chromophore undergoing internal rotation within its polypeptide shell and/or relative to adjacent units of the oligomer are also possibilities. Both are consistent with the absence of viscosity effects on the depolarization rate. The steady-state anisotropy of dsRed and Citrine in pH 9 are within the uncertainty range of time-resolved initial anisotropy. The depolarization angle between the absorbing and emitting dipole moment in dsRed is 24 ± 3° compared with 5 ± 5° in Citrine as estimated from the steady-state anisotropy (11, 15).
Photobleaching and Denaturation Recovery.
In molecular studies by using FCS in solution, as the illumination intensity approaches the saturation threshold, the apparent diffusion time starts decreasing because of photobleaching, and the triplet state population builds up sufficiently to be recognized. The intensity-dependent measurements allow us to characterize the photobleaching quantum yield (Φb) by monitoring the variation of the apparent diffusion time with excitation rate (A.A.H. and W.W.W., unpublished work). The slope of the apparent diffusion rate constant (1/τD) vs. excitation rate (kex) gives directly the Φb values. Because of the triplet state population, flicker dynamics and possibly photobleaching, the apparent saturation threshold in dsRed (ISat≈30 kWcm−2 ≡ 7.8 × 10²² photon⋅cm−2⋅s−1, or kex≈1 × 10⁷⋅s−1) is more than an order of magnitude lower than predicted from the fluorescence decay time [ISat = (στf)−1≈2.2 × 1024 photon⋅cm−2⋅s−1] of a two-level system with excitation cross section σ at 514 nm. The estimated Φb of dsRed is ≈9.5 × 10⁻⁶ in pH 9.0 for 514-nm excitation compared with ≈2.6 × 10⁻⁵ for Citrine under 488-nm illumination, which suggests that the fluorophore can emit ≈105 photons before photobleaching. These values are in agreement with the estimated Φb for EGFP in a gel at pH 8 by Moerner and coworkers (25) by using wide-field microscopy. Baird et al. (1) reported a smaller photobleaching yield that might be caused by the different illumination wavelength and intensity. The fluorescence signal of dsRed at pH 3.5 was indistinguishable from the background signal of pure buffer. However, 30% of the dsRed fluorescence was recovered by raising the pH to 6.6 after 5 min.
Summary
The molecular dynamics of a red fluorescent protein (dsRed) from coral and a newly designed YFP mutant (Citrine) have been investigated (on 10−6⋅10−11-s time scale) by using FCS and TCSPC. Citrine exhibits external proton binding (pKa≈5.7) kinetics on the tens-of-microseconds time scale. In dsRed, proton-binding kinetics are insignificant over the pH range 3.9–9.0, so its fluorescence yield is pH insensitive, unique among bright GFPs. Light-driven photoconversions occur on a 600 ± 400-μs time scale with a quantum yield of ≈10−3 at high pH and are conspicuous in FCS measurements on dsRed, Citrine, and other GFPs.
The most stable configuration of dsRed as expressed in E. coli is probably a tetramer, in the concentration range ≈10−9 to 10−6 M, which implies an oligomer dissociation constant ≤10−9 M. The biexponential anisotropy decay reveals a fast (≈211-ps) depolarization of dsRed fluorescence, which is attributed to energy transfer among nonparallel chromophores forming the oligomer and possibly involving internal motion of the chromophore. However, expression of a dsRed construct with amyloid precursor protein in mammalian neurons yields monomers that provide convenient fluorescence resonance energy transfer with a GFP, suggesting that the tetramerization need not be a problem in cellular applications (B. T. Hyman, personal communication).
The bright first-excited anionic state of dsRed has a long lifetime of 3.65 ns, independent of pH, and Citrine has a lifetime of 3.61 ns. Citrine, however, also shows an additional short (880-ps) fluorescence decay component (≈26%) at low pH because of the intermediate state. As in most GFP mutants, the virtually dark neutral excited state of Citrine at low pH exhibits a complex fluorescence relaxation with efficient nonradiative pathways, as revealed by multiexponential fluorescence decays on the picosecond-to-nanosecond time scales.
DsRed and Citrine both possess a large two-photon excitation cross section and, therefore, are excellent fluorescent markers for biological research by using multiphoton fluorescence microscopy.
Acknowledgments
The research at Cornell was carried out in the Developmental Resource for Biophysical Imaging Opto-electronics with funding provided by the National Institutes of Health (NIH) (P412 RR04224) and the National Science Foundation (NSF) (BIR 8800278). S.T.H. benefited from a NSF Graduate Research Fellowship and a NIH Molecular Biophysics Training Grant (5 T32 GM08267). The Howard Hughes Medical Institute and NIH (NS27177) provided support for G.S.B. and R.Y.T. at La Jolla.
Abbreviations
- GFP
green fluorescent protein
- EGFP
enhanced GFP
- YFP
yellow fluorescent protein
- FCS
fluorescence correlation spectroscopy
- TCSPC
time-correlated single-photon counting
- 2P
two-photon
- wt
wild type
- PES
potential energy surface
References
- 1.Baird G S, Zacharias D A, Gross L A, Hoffman R C, Baldridge K K, Tsien R Y. Proc Natl Acad Sci USA. 2000;97:11984–11989. doi: 10.1073/pnas.97.22.11984. [DOI] [PMC free article] [PubMed] [Google Scholar]
- 2.Gross L A, Baird G S, Hoffman R C, Baldridge K K, Tsien R Y. Proc Natl Acad Sci USA. 2000;97:11990–11995. doi: 10.1073/pnas.97.22.11990. [DOI] [PMC free article] [PubMed] [Google Scholar]
- 3.Tsien R Y. Annu Rev Biochem. 1998;67:509–544. doi: 10.1146/annurev.biochem.67.1.509. [DOI] [PubMed] [Google Scholar]
- 4.Magde D, Elson E, Webb W W. Phys Rev Lett. 1972;29:705–708. [Google Scholar]
- 5.Maiti S, Haupts U, Webb W W. Proc Natl Acad Sci USA. 1997;94:11753–11757. doi: 10.1073/pnas.94.22.11753. [DOI] [PMC free article] [PubMed] [Google Scholar]
- 6.Eigen M, Rigler R. Proc Natl Acad Sci USA. 1994;91:5470–5757. doi: 10.1073/pnas.91.13.5740. [DOI] [PMC free article] [PubMed] [Google Scholar]
- 7.Elson E L, Magde D. Biopolymers. 1974;13:1–27. doi: 10.1002/bip.1974.360130103. [DOI] [PubMed] [Google Scholar]
- 8.Haupts U, Maiti S, Schwille P, Webb W W. Proc Natl Acad Sci USA. 1998;95:13573–13578. doi: 10.1073/pnas.95.23.13573. [DOI] [PMC free article] [PubMed] [Google Scholar]
- 9.Schwille P, Kummer S, Heikal A A, Moerner W E, Webb W W. Proc Natl Acad Sci USA. 2000;97:151–156. doi: 10.1073/pnas.97.1.151. [DOI] [PMC free article] [PubMed] [Google Scholar]
- 10.Dickson R M, Cubitt A B, Tsien R Y, Moerner W E. Nature (London) 1997;388:355–358. doi: 10.1038/41048. [DOI] [PubMed] [Google Scholar]
- 11.O'Connor D V, Phillips D. Time-Correlated Single Photon Counting. London: Academic; 1984. [Google Scholar]
- 12.Denk W, Piston D W, Webb W W. In: Handbook of Biological Confocal Microscopy. Pawley J B, editor. New York: Plenum; 1995. pp. 445–458. [Google Scholar]
- 13.Miyawaki A, Griesbeck O, Heim R, Tsien R Y. Proc Natl Acad Sci USA. 1999;96:2135–2140. doi: 10.1073/pnas.96.5.2135. [DOI] [PMC free article] [PubMed] [Google Scholar]
- 14.Widengren J, Mets Ü, Rigler R. J Phys Chem. 1995;99:13368–13379. [Google Scholar]
- 15.Lakowicz J R. Principles of Fluorescence Spectroscopy. New York: Kluwer; 1999. [Google Scholar]
- 16.Brejc K, Sixma T K, Kitts P A, Kain S R, Tsien R Y, Ormö M, Remington S J. Proc Natl Acad Sci USA. 1977;94:2306–2311. doi: 10.1073/pnas.94.6.2306. [DOI] [PMC free article] [PubMed] [Google Scholar]
- 17.Xu C, Williams R M, Zipfel W, Webb W W. Bioimaging. 1996;4:198–207. [Google Scholar]
- 18.Chattoraj M, King B A, Bublitz G U, Boxer S G. Proc Natl Acad Sci USA. 1996;93:8362–8367. doi: 10.1073/pnas.93.16.8362. [DOI] [PMC free article] [PubMed] [Google Scholar]
- 19.Lossau H, Kummer A, Heinecke R, Pöllinger-Dammer F, Kompa C, Bieser G, Jonsson T, Silva C M, Yang M M, Youvan D C, Michel-Beyerle M E. Chem Phys. 1996;213:1–16. [Google Scholar]
- 20.Kummer A D, Kompa C, Lossau H, Pöllinger-Dammer F, Michel-Beyerle M E, Silva C M, Bylina E J, Coleman W J, Yang M M, Youvan D C. Chem Phys. 1998;237:183–193. [Google Scholar]
- 21.Wachter R M, Remington S J. Curr Biol. 1999;9:R628–R629. doi: 10.1016/s0960-9822(99)80408-4. [DOI] [PubMed] [Google Scholar]
- 22.Matz M V, Fradkov A F, Labas Y A, Savitsky A P, Zaraisky A G, Markelov M L, Lukyanov S A. Nat Biotechnol. 1999;17:969–973. doi: 10.1038/13657. [DOI] [PubMed] [Google Scholar]
- 23.Meseth U, Wohland T, Rigler R, Vogel H. Biophys J. 1999;76:1619–1631. doi: 10.1016/S0006-3495(99)77321-2. [DOI] [PMC free article] [PubMed] [Google Scholar]
- 24.Volkmer A, Subramaniam V, Birch D J S, Jovin T M. Biophys J. 2000;78:1589–1598. doi: 10.1016/S0006-3495(00)76711-7. [DOI] [PMC free article] [PubMed] [Google Scholar]
- 25.Peterman E J G, Brasselet S, Moerner W E. J Phys Chem A. 1999;103:10553–10560. [Google Scholar]


