Abstract
We study the thermodynamic behavior of a model protein with 54 amino acids that forms a three-helix bundle in its native state. The model contains three types of amino acids and five to six atoms per amino acid and has the Ramachandran torsional angles φi, ψi as its degrees of freedom. The force field is based on hydrogen bonds and effective hydrophobicity forces. For a suitable choice of the relative strength of these interactions, we find that the three-helix-bundle protein undergoes an abrupt folding transition from an expanded state to the native state. Also shown is that the corresponding one- and two-helix segments are less stable than the three-helix sequence.
It is not yet possible to simulate the formation of proteins' native structures on the computer in a controlled way. This goal has been achieved in the context of simple lattice and off-lattice models, where typically each amino acid is represented by a single interaction site corresponding to the Cα atom, and such studies have provided valuable insights into the physical principles of protein folding (1–5) and the statistical properties of functional protein sequences (6, 7). However, these models have their obvious limitations. Therefore, the search for computationally feasible models with a more realistic chain geometry remains a highly relevant task.
In this paper, we discuss a model based on the well-known fact that the main degrees of freedom of the protein backbone are the Ramachandran torsional angles φi, ψi (8). Each amino acid is represented by five or six atoms, which makes this model computationally slightly more demanding than Cα models. On the other hand, it also makes interactions such as hydrogen bonds easier to define. The formation of native structure is, in this model, driven by hydrogen-bond formation and effective hydrophobicity forces; hydrophobicity is widely held as the most important stability factor in proteins (9, 10), and hydrogen bonds are essential to properly model the formation of secondary structure.
In this model, we study in particular a three-helix-bundle protein with 54 amino acids, which represents a truncated and simplified version of the four-helix-bundle protein de novo designed by Regan and DeGrado (11). This example was chosen partly because there have been earlier studies of similar-sized helical proteins using models at comparable levels of resolution (12–18). The behavior of small fast-folding proteins is a current topic in both theoretical and experimental research, and a three-helix-bundle protein that has been extensively studied both experimentally (19, 20) and theoretically (14, 17, 21, 22) is fragment B of staphylococcal protein A.
In addition to the three-helix protein, to study size dependence, we also look at the behavior of the corresponding one- and two-helix segments. By using the method of simulated tempering (23–25), a careful study of the thermodynamic properties of these different chains is performed.
Not unexpectedly, it turns out that the behavior of the model strongly depends on the relative strength of the hydrogen-bond and hydrophobicity terms. In fact, the situation is somewhat reminiscent of what has been found for homopolymers with stiffness (26–29), with hydrogen bonds playing the role of the stiffness term. Throughout this paper, we focus on one specific empirical choice of these parameters.
For this choice of parameters, we find that the three-helix-bundle protein has the following three properties. First, it does form a stable three-helix bundle (except for a 2-fold topological degeneracy). Second, its folding transition is abrupt, from an expanded state to the native three-helix-bundle state. Third, compared to the one- and two-helix segments, it forms a more stable secondary structure. It should be stressed that these properties are found without resorting to the popular Gō approximation (30), in which interactions that do not favor the desired structure are ignored.
The Model
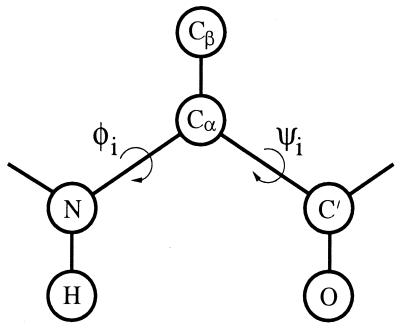
The model we study is a reduced off-lattice model. The chain representation is illustrated in Fig. 1. As mentioned in the introduction, each amino acid is represented by five or six atoms. The three backbone atoms N, Cα, and C′ are all included. Also included are the H and O atoms shown in Fig. 1, which we use to define hydrogen bonds. Finally, the side chain is represented by a single atom, Cβ, which can be hydrophobic, polar, or absent. This gives us the following three types of amino acids: A with hydrophobic Cβ, B with polar Cβ, and G (glycine) without Cβ.
Figure 1.
Schematic figure showing the representation of one amino acid.
The H, O, and Cβ atoms are all attached to the backbone in a rigid way. Furthermore, in the backbone, all bond lengths, bond angles, and peptide torsional angles (180°) are held fixed. This leaves us with two degrees of freedom per amino acid, the Ramachandran torsional angles φi and ψi (see Fig. 1). The parameters held fixed can be found in Table 1.
Table 1.
Geometry parameters
| Bond lengths, Å | Bond angles, ° | ||
|---|---|---|---|
| NCα | 1.46 | C′NCα | 121.7 |
| CαC′ | 1.52 | NCαC′ | 111.0 |
| C′N | 1.33 | CαC′N | 116.6 |
| NH | 1.03 | NCαCβ | 110.0 |
| CαCβ | 1.53 | C′CαCβ | 110.0 |
| C′O | 1.23 | ||
Our energy function
 |
1 |
is composed of four terms. The local potential Eloc has a standard form with 3-fold symmetry,
 |
2 |
The self-avoidance term Esa is given by a hard-sphere potential of the form
 |
3 |
where the sum runs over all possible atom pairs except those consisting of two hydrophobic Cβ. The hydrogen-bond term Ehb is given by
 |
4 |
where
 |
5 |
 |
6 |
In Eq. 4, i and j represent H and O atoms, respectively, and rij denotes the HO distance, αij the NHO angle, and βij the HOC′ angle. Any HO pair can form a hydrogen bond. The last term in Eq. 1, the hydrophobicity term EAA, has the form
 |
7 |
where both i and j represent hydrophobic Cβ. To speed up the simulations, a cutoff radius rc is used,† which is 4.5 Å for Esa and Ehb and 8 Å for EAA.
In this energy function, roughly speaking, the first two terms, Eloc and Esa, enforce steric constraints, whereas the last two terms, Ehb and EAA, are the ones responsible for stability. Force fields similar in spirit, emphasizing hydrogen bonding and hydrophobicity, have been used with some success to predict structures of peptides (31) and small helical proteins (15).
The parameters of our energy function were determined largely by trial and error. The final parameters are listed in Table 2. The parameters σij of Eq. 3 are given by
 |
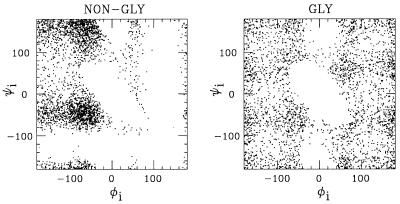
where σi, σj can be found in Table 2, and Δσij is zero except for CβC′, CβN, and CβO pairs that are connected by three covalent bonds. In these three cases, we put Δσij = 0.625 Å. This could equivalently be described as a change of the local φi and ψi potentials. In Fig. 2, we show φi, ψi scatter plots for nonglycine (A and B) and glycine for our final parameters, which are in good qualitative agreement with the φi, ψi distributions of real proteins (8, 32).
Table 2.
Parameters of the energy function
| ɛφ | ɛψ | ɛsa | ɛhb | ɛAA | σi,
Å
|
σhb, Å | σAA, Å | |||||
|---|---|---|---|---|---|---|---|---|---|---|---|---|
| N | Cα | C′ | H | Cβ | O | |||||||
| 1 | 1 | 0.0034 | 2.8 | 2.2 | 1.65 | 1.85 | 1.85 | 1.0 | 2.5 | 1.65 | 2.0 | 5.0 |
Energies are in dimensionless units, in which the folding transition occurs at kT ≈ 0.65 for the three-helix-bundle protein (see below).
Figure 2.
φi, ψi scatter plots for nonglycine and glycine, as obtained by simulations of the chains GXG for X = A/B and X = G, respectively, at kT = 0.625 (shown is φi, ψi for X).
Finally, we determined the strengths of the hydrogen-bond and hydrophobicity terms on the basis of the resulting overall thermodynamic behavior of the three-helix sequence. For this purpose, we performed a set of trial runs for fixed values of the other parameters. An alternative would have been to use the method of Shea et al. (33). The result of our empirical determination of ɛhb and ɛAA does not seem unreasonable; at the folding temperature of the three-helix sequence (see below), we get ɛhb/kT ≈ 4.3 and ɛAA/kT ≈ 3.4.
In this model, we study the three sequences shown in Table 3, which contain 16, 35, and 54 amino acids, respectively. Following the strategy of Regan and DeGrado (11), the A and B amino acids are distributed along the sequence 1H in such a way that this segment can form a helix with all hydrophobic amino acids on the same side. The sequence 3H, consisting of three such stretches of As and Bs plus two GGG segments, is meant to form a three-helix bundle. This particular sequence was recently studied by Takada et al. (18), who used a more elaborate model with nonadditive forces.
Table 3.
The sequences studied
| 1H: | BBABBAABBABBAABB |
| 2H: | 1H-GGG-1H |
| 3H: | 1H-GGG-1H-GGG-1H |
Results
To study the thermodynamic behavior of the chains described in the previous section, we use the method of simulated tempering. This means that we first select a set of allowed temperatures and then perform simulations in which the temperature is a dynamical variable. This is done to speed up low-temperature simulations. In addition, it provides a convenient method for calculating free energies.
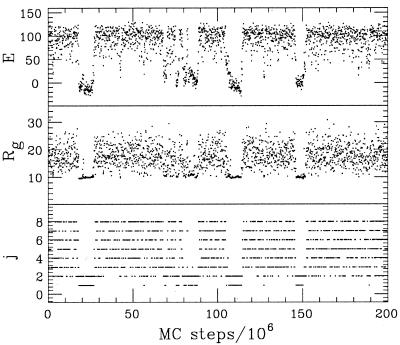
An example of a simulated-tempering run is given in Fig. 3, which shows the Monte Carlo evolution of the energy E and radius of gyration Rg (calculated over all backbone atoms) in a simulation of the three-helix sequence. Also shown (Fig. 3 Bottom) is how the system jumps between the different temperatures. Two distinct types of behavior can be seen. In one case, E is high, fluctuations in size are large, and the temperatures visited are high. In the other case, E is low, the size is small and almost frozen, and the temperatures visited are low. Interesting to note is that there is one temperature, the next-lowest one, which is visited in both cases. Apparently, both types of behavior are possible at this temperature.
Figure 3.
Monte Carlo evolution of the energy and radius of gyration in a typical simulation of the three-helix sequence. Bottom shows how the system jumps between the allowed temperatures Tj, which are given by Tj = Tmin (Tmax/Tmin)(j−1)/(J−1) (34) with kTmin = 0.625, kTmax = 0.9, and J = 8. The temperature Tmin is chosen to lie just below the collapse transition, whereas Tmax is well into the coil phase (see Fig. 4).
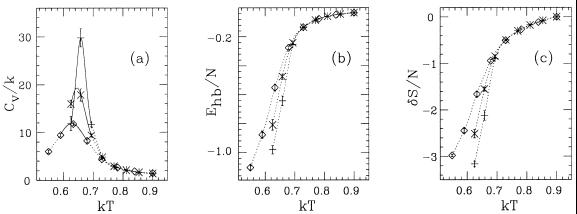
In Fig. 4a, we show the specific heat as a function of temperature for the one-, two-, and three-helix sequences. A pronounced peak can be seen that gets stronger with increasing chain length. In fact, the increase in height is not inconsistent with a linear dependence on chain length, which is what one would have expected if it had been a conventional first-order phase transition with a latent heat.
Figure 4.
Thermodynamic functions against temperature for the sequences 1H (◊), 2H (×), and 3H (+) in Table 3. (a) Specific heat Cv = (〈E2〉 − 〈E〉2)/NkT2, N being the number of amino acids. (b) Hydrogen-bond energy per amino acid, Ehb/N. (c) Chain entropy per amino acid, δS/N = [S − S(kT = 0.9)]/N. The full lines in a represent single-histogram extrapolations (35). Dotted lines are drawn to guide the eye.
Our results for the radius of gyration (not displayed) show that the specific heat maximum can be viewed as the collapse temperature. The specific heat maximum is also where hydrogen-bond formation occurs, as can be seen from Fig. 4b. Important to note in this figure is that the decrease in hydrogen-bond energy per amino acid with decreasing temperature is most rapid for the three-helix sequence, which implies that, compared to the shorter ones, this sequence forms more stable secondary structure. The results for the chain entropy shown in Fig. 4c provide further support for this; the entropy loss per amino acid with decreasing temperature is largest for the three-helix sequence.
It should be stressed that the character of the collapse transition depends strongly on the relative strength of the hydrogen-bond and hydrophobicity terms. Fig. 4 shows that the transition is very abrupt or “first-order-like” for our choice (ɛhb, ɛAA) = (2.8, 2.2). A fairly small decrease of ɛhb/ɛAA is sufficient to get a very different behavior with, for example, a much weaker peak in the specific heat. In this case, the chain collapses to a molten globule without specific structure rather than to a three-helix bundle. A substantially weakened transition was observed for ɛhb = ɛAA = 2.5. If, on the other hand, ɛhb/ɛAA is too large, then it is evident that the chain will form one long helix instead of a helical bundle.
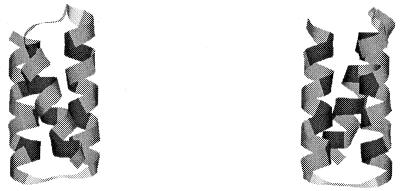
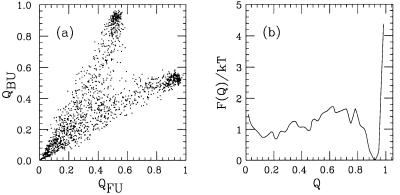
We now turn to the three-dimensional structure of the three-helix sequence in the collapsed phase. It turns out that it does form a three-helix bundle. This bundle can have two distinct topologies: if we let the first two helices form a U, then the third helix can be either in front of or behind that U. The model is, not unexpectedly, unable to discriminate between these two possibilities. To characterize low-temperature conformations, we therefore determined two representative structures, one for each topology, which, following ref. 18, are referred to as FU and BU, respectively. These structures are shown in Fig. 5. They were generated by quenching a large number of low-T structures to zero temperature, and we feel convinced that they provide good approximations of the energy minima for the respective topologies. Given an arbitrary conformation, we then measure the root-mean-square distances δi (i = FU, BU) to these two structures (calculated over all backbone atoms). These distances are converted into similarity parameters Qi by using
 |
8 |
At temperatures above the specific heat maximum, both Qi tend to be small. At temperatures below this point, the system is found to spend most of its time close to one or the other of the representative structures; either QFU or QBU is close to 1. Finally, at the peak, all three of these regions in the QFU, QBU plane are populated, as can be seen from Fig. 6a. In particular, this implies that the folding transition coincides with the specific heat maximum.
Figure 5.
Representative low-temperature structures, FU and BU, respectively. Drawn with rasmol (36).
Figure 6.
(a) QFU, QBU (see Eq. 8) scatter plot at the specific heat maximum (kT = 0.658). (b) Free energy F(Q) as a function of Q = max(QFU, QBU) at the same temperature.
The folding transition can be described in terms of a single “order parameter” by taking Q = max(QFU, QBU) as a measure of nativeness. Correspondingly, we put δ = min(δFU, δBU). In Fig. 6b, we show the free-energy profile F(Q) at the folding temperature. The free energy has a relatively sharp minimum at Q ≈ 0.9, corresponding to δ ≈ 3 Å. This is followed by a weak barrier around Q = 0.7, corresponding to δ ≈ 6 Å. Finally, there is a broad minimum at small Q, where Q = 0.2 corresponds to δ ≈ 13 Å.
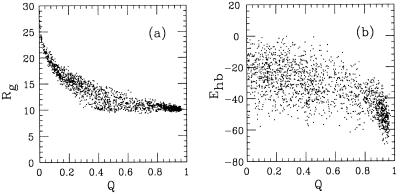
What does the nonnative population at the folding temperature correspond to in terms of Rg and Ehb? This can be seen from the Q, Rg, and Q, Ehb scatter plots in Fig. 7. These plots show that the low-Q minimum of F(Q) corresponds to expanded structures with a varying but not high secondary-structure content. Although a detailed kinetic study is beyond the scope of this paper, we furthermore note that the free-energy surfaces corresponding to the distributions in Fig. 7 are relatively smooth. Consistent with that, we found that standard fixed-temperature Monte Carlo simulations were able to reach the native state, starting from random coils.
Figure 7.
(a) Q, Rg, and (b) Q, Ehb scatter plots at the folding temperature (kT = 0.658).
Let us finally mention that we also performed simulations of some random sequences with the same length and composition as the three-helix sequence. The random sequences did not form stable structures and collapsed more slowly with decreasing temperature than the designed three-helix sequence.
Summary and Outlook
We have studied a reduced protein model where the formation of native structure is driven by a competition between hydrogen bonds and effective hydrophobicity forces. Using this force field, we find that the three-helix-bundle protein studied has the following properties:
It does form a stable three-helix-bundle state, except for a 2-fold topological degeneracy.
It undergoes an abrupt folding transition from an expanded state to the native state.
It forms more stable secondary structure than the corresponding one- and two-helix segments.
An obvious question that remains to be addressed is what is needed to lift the topological degeneracy. Not obvious, however, is whether this question should be addressed at the present level of modeling, before including full side chains.
A first-order-like folding transition that takes the system directly from the unfolded state to the native one is what one expects for small fast-folding proteins. For the model to show this behavior, careful tuning of the relative strength of the hydrogen-bond and hydrophobicity terms, ɛhb/ɛAA, is required. This ɛhb/ɛAA dependence may at first glance seem unwanted but is not physically unreasonable; ɛhb can be thought of partly as a stiffness parameter, and chain stiffness has important implications for the phase structure, as shown by recent work on homopolymers (26–29). Note also that incorporation of full side chains makes the chains intrinsically stiffer, which might lead to a weaker ɛhb/ɛAA dependence.
Our three-helix sequence has been studied previously by Takada et al. (18), who used a more elaborate force field. It was suggested that it is essential to use context-dependent hydrogen bonds for the three-helix-bundle protein to make more stable secondary structure than its one-helix fragments. Our model shows this behavior, although its hydrogen bonds are context-independent.
Let us finally stress that we find a first-order-like folding transition without using the Gō approximation. Evidence for first-order-like folding transitions has been found for proteins with similar lengths in some Cα models (5, 14, 17, 33), but these studies use this approximation.
Acknowledgments
This work was in part supported by the Swedish Foundation for Strategic Research.
Footnotes
This paper was submitted directly (Track II) to the PNAS office.
Article published online before print: Proc. Natl. Acad. Sci. USA, 10.1073/pnas.240245297.
Article and publication date are at www.pnas.org/cgi/doi/10.1073/pnas.240245297
The cutoff procedure is f(r) ↦ f̃(r), where f̃(r) = f(r) − f(rc) − (r − rc)f′(rc), if r < rc and f̃(r) = 0 otherwise.
References
- 1.Săli A, Shakhnovich E, Karplus M. J Mol Biol. 1994;235:1614–1636. doi: 10.1006/jmbi.1994.1110. [DOI] [PubMed] [Google Scholar]
- 2.Bryngelson J D, Onuchic J N, Socci N D, Wolynes P G. Proteins Struct Funct Genet. 1995;21:167–195. doi: 10.1002/prot.340210302. [DOI] [PubMed] [Google Scholar]
- 3.Dill K A, Chan H S. Nat Struct Biol. 1997;4:10–19. doi: 10.1038/nsb0197-10. [DOI] [PubMed] [Google Scholar]
- 4.Klimov D K, Thirumalai D. J Chem Phys. 1998;109:4119–4125. [Google Scholar]
- 5.Nymeyer H, García A E, Onuchic J N. Proc Natl Acad Sci USA. 1998;95:5921–5928. doi: 10.1073/pnas.95.11.5921. [DOI] [PMC free article] [PubMed] [Google Scholar]
- 6.Pande V S, Grosberg A Y, Tanaka T. Proc Natl Acad Sci USA. 1994;91:12976–12979. doi: 10.1073/pnas.91.26.12976. [DOI] [PMC free article] [PubMed] [Google Scholar]
- 7.Irbäck A, Peterson C, Potthast F. Proc Natl Acad Sci USA. 1996;93:9533–9538. doi: 10.1073/pnas.93.18.9533. [DOI] [PMC free article] [PubMed] [Google Scholar]
- 8.Ramachandran G N, Sasisekharan V. Adv Protein Chem. 1968;23:283–437. doi: 10.1016/s0065-3233(08)60402-7. [DOI] [PubMed] [Google Scholar]
- 9.Dill K A. Biochemistry. 1990;29:7133–7155. doi: 10.1021/bi00483a001. [DOI] [PubMed] [Google Scholar]
- 10.Privalov P L. In: Protein Folding. Creighton T E, editor. New York: Freeman; 1992. pp. 83–126. [Google Scholar]
- 11.Regan L, DeGrado W F. Science. 1988;241:976–978. doi: 10.1126/science.3043666. [DOI] [PubMed] [Google Scholar]
- 12.Rey A, Skolnick J. Proteins Struct Funct Genet. 1993;16:8–28. doi: 10.1002/prot.340160103. [DOI] [PubMed] [Google Scholar]
- 13.Guo Z, Thirumalai D. J Mol Biol. 1996;263:323–343. doi: 10.1006/jmbi.1996.0578. [DOI] [PubMed] [Google Scholar]
- 14.Zhou Z, Karplus M. Proc Natl Acad Sci USA. 1997;94:14429–14432. doi: 10.1073/pnas.94.26.14429. [DOI] [PMC free article] [PubMed] [Google Scholar]
- 15.Koretke K K, Luthey-Schulten Z, Wolynes P G. Proc Natl Acad Sci USA. 1998;95:2932–2937. doi: 10.1073/pnas.95.6.2932. [DOI] [PMC free article] [PubMed] [Google Scholar]
- 16.Hardin C, Luthey-Schulten Z, Wolynes P G. Proteins Struct Funct Genet. 1999;34:281–294. [PubMed] [Google Scholar]
- 17.Shea J-E, Onuchic J N, Brooks C L., III Proc Natl Acad Sci USA. 1999;96:12512–12517. doi: 10.1073/pnas.96.22.12512. [DOI] [PMC free article] [PubMed] [Google Scholar]
- 18.Takada S, Luthey-Schulten Z, Wolynes P G. J Chem Phys. 1999;110:11616–11629. [Google Scholar]
- 19.Bottomley S P, Popplewell A G, Scawen M, Wan T, Sutton B J, Gore M G. Protein Eng. 1994;7:1463–1470. doi: 10.1093/protein/7.12.1463. [DOI] [PubMed] [Google Scholar]
- 20.Bai Y, Karimi A, Dyson H J, Wright P E. Protein Sci. 1997;6:1449–1457. doi: 10.1002/pro.5560060709. [DOI] [PMC free article] [PubMed] [Google Scholar]
- 21.Guo Z, Brooks C L, III, Boczko E M. Proc Natl Acad Sci USA. 1997;94:10161–10166. doi: 10.1073/pnas.94.19.10161. [DOI] [PMC free article] [PubMed] [Google Scholar]
- 22.Kolinski A, Galazka W, Skolnick J. J Chem Phys. 1998;108:2608–2617. [Google Scholar]
- 23.Lyubartsev A P, Martsinovski A A, Shevkunov S V, Vorontsov-Velyaminov P V. J Chem Phys. 1992;96:1776–1783. [Google Scholar]
- 24.Marinari E, Parisi G. Europhys Lett. 1992;19:451–458. [Google Scholar]
- 25.Irbäck A, Potthast F. J Chem Phys. 1995;103:10298–10305. [Google Scholar]
- 26.Kolinski A, Skolnick J, Yaris R. Proc Natl Acad Sci USA. 1986;83:7267–7271. doi: 10.1073/pnas.83.19.7267. [DOI] [PMC free article] [PubMed] [Google Scholar]
- 27.Doniach S, Garel T, Orland H. J Chem Phys. 1996;105:1601–1608. [Google Scholar]
- 28.Bastolla U, Grassberger P. J Stat Phys. 1997;89:1061–1078. [Google Scholar]
- 29.Doye J P K, Sear R P, Frenkel D. J Chem Phys. 1998;108:2134–2142. [Google Scholar]
- 30.Gō N, Taketomi H. Proc Natl Acad Sci USA. 1978;75:559–563. doi: 10.1073/pnas.75.2.559. [DOI] [PMC free article] [PubMed] [Google Scholar]
- 31.Ishikawa K, Yue K, Dill K A. Protein Sci. 1999;8:716–721. doi: 10.1110/ps.8.4.716. [DOI] [PMC free article] [PubMed] [Google Scholar]
- 32.Zimmerman S S, Pottle M S, Némethy G, Scheraga H A. Macromolecules. 1977;10:1–9. doi: 10.1021/ma60055a001. [DOI] [PubMed] [Google Scholar]
- 33.Shea J-E, Nochomovitz Y D, Guo Z, Brooks C L., III J Chem Phys. 1998;109:2895–2903. [Google Scholar]
- 34.Hansmann U H E, Okamoto Y. J Comput Chem. 1997;18:920–933. [Google Scholar]
- 35.Ferrenberg A M, Swendsen R H. Phys Rev Lett. 1988;61:2635–2638. doi: 10.1103/PhysRevLett.61.2635. , and erratum (1989) 63, 1658, and references given in the erratum. [DOI] [PubMed] [Google Scholar]
- 36.Sayle R, Milner-White E J. Trends Biochem Sci. 1995;20:374–376. doi: 10.1016/s0968-0004(00)89080-5. [DOI] [PubMed] [Google Scholar]


