

Abstract
Regulated gene expression is critical for the proper timing of cell cycle transitions. Here we report that human LIN-9 has an important function in transcriptional regulation of G2/M genes. Depletion of LIN-9 by RNAi in human fibroblasts strongly impairs proliferation and delays progression from G2 to M. We identify a cluster of G2/M genes as direct targets of LIN-9. Activation of these genes is linked to an association between LIN-9 and B-MYB. Chromatin immunoprecipitation assays revealed binding of both LIN-9 and B-MYB to the promoters of G2/M regulated genes. Depletion of B-MYB recapitulated the biological outcome of LIN-9 knockdown, including impaired proliferation and reduced expression of G2/M genes. These data suggest a critical role for human LIN-9, together with B-MYB, in the activation of genes that are essential for progression into mitosis.
Keywords: B-MYB; E2F; G2/M; LIN-9; mitosis
Introduction
Periodic, regulated gene expression is essential for orderly progression through the cell cycle. Many studies have shown that E2F transcription factors are critical regulators of the G1/S transition. Their activity is tightly controlled by binding to the retinoblastoma protein (pRB) and two related ‘pocket proteins' p107 and p130. Complexes of pocket proteins and E2F are active transcriptional repressors. Mitogenic signaling activates G1-specific cyclin-dependent kinases (CDKs) to phosphorylate pocket proteins and to release active E2F that subsequently triggers entry into S phase by activating genes that have key functions in S-phase such as synthesis of nucleotides and DNA-replication (Trimarchi and Lees, 2002). E2F has also been implicated in the regulation of genes that are active at G2/M (Stevaux and Dyson, 2002). In a recent study, a dual role for E2F in the regulation of G2-specific cdc2 and cyclin B1 was described. It was shown that inhibitory E2Fs mediate repression of these genes in quiescent cells while positive acting E2Fs, together with B-MYB, are required for activation in G2 (Zhu et al, 2004). Because B-MYB is itself an E2F target gene that is expressed at G1/S and is not fully active until phosphorylated by cyclinA-cdk2 in S-phase, this provides a possible explanation for delayed transcriptional activation of cdc2 and cyclin B1 in G2 compared to the typical E2F targets that are activated in G1/S (Zhu et al, 2004).
The link between E2F and B-MYB in transcriptional regulation is also supported by the recent purification of native pRB complexes from Drosophila embryo extracts. These complexes alternatively called dREAM or Myb-MuvB contain one of the two Drosophila pRB proteins (RBF1 or RBF2), the repressor E2F (dE2F2), p55CAF1, dMYB, which is related to B-MYB and three Myb-interacting proteins—namely Mip40, Mip120 and Mip130 (Korenjak et al, 2004; Lewis et al, 2004, reviewed in Lipsick, 2004; Korenjak and Brehm, 2005). RNAi-mediated depletion of several subunits demonstrated a role of the complex in the stable repression of developmental genes. How the pRB–dE2F complex exactly represses transcription, however is unknown.
Remarkably, the function of the pRB/E2F complex appears to be highly conserved in evolution. Most subunits of the dREAM/Myb-MuvB complex are related to the Caenorhabditis elegans synMuv class B genes that control vulva differentiation (Korenjak and Brehm, 2005). Mammalian homologs of all subunits of the dREAM/Myb-MuvB complex can also be identified. We have previously shown that LIN-9, the human homolog of the Drosophila dMYB interacting Mip130 protein and the C. elegans LIN-9 synMuv protein, binds to and cooperates with pRB during ‘flat cell' formation in Saos-2 cells (Gagrica et al, 2004). Unlike Drosophila Mip130, which functions in repression of developmental genes, human LIN-9 activates differentiation genes together with pRB (Gagrica et al, 2004). Significantly, a role for LIN-9 in tumorigenesis is suggested by the observation that LIN-9 can function as a tumor suppressor in the pRB pathway (Gagrica et al, 2004).
In this study we have now focused on the role of human LIN-9 in the cell cycle. We found that human LIN-9 has an important, previously unrecognized function in transcriptional regulation of G2/M genes that is linked to an association of LIN-9 with B-MYB. Depletion of either LIN-9 or B-MYB inhibits proliferation and delays entry into mitosis. Our data suggest a critical role for LIN-9, together with B-MYB, in the transcriptional regulation of genes that are essential for progression into mitosis.
Results
LIN-9 is required for progression through G2
LIN-9 was depeleted in hTERT immortalized human BJ fibroblasts (BJ-ET) by infection with a retroviral vector encoding an shRNA directed against human LIN-9. Immunoblot analysis demonstrated that endogenous LIN-9 protein expression was efficiently suppressed by this approach. LIN-9 was also effectively depleted by RNAi in SHEP neuroblastoma cells and in a number of other human cell lines including HeLa cells and 293 cells (Figure 1A and data not shown). To investigate the role of LIN-9 in proliferation, equal numbers of control cells and LIN-9 depleted BJ-ET cells were plated and their growth was followed over several days in culture. Depletion of LIN-9 significantly inhibited proliferation of BJ-ET cells (Figure 1B). FACS analysis demonstrated a decreased proportion of LIN-9 depleted cells in G1 and accumulation of cells in G2/M 5 days after infection (Figure 1C). Reduced proliferation and increase in G2/M was also observed with a second LIN-9 specific shRNA (Supplementary Figure S1). We concluded that G2/M accumulation is specific for the suppression of LIN-9. FACS analysis of BrdU-labeled cells showed a reduction in the fraction of cells in S-phase of LIN-9 depleted cells and confirmed accumulation of these cells in G2/M (Figure 1D). To test whether LIN-9 depleted cells accumulate in G2 or in mitosis we used immunofluorescence microscopy with an antibody to histone H3 phosphorylated on serine 10. Histone H3 is phosphorylated on serine 10 in late G2 and M phase before it is dephosphorylated in anaphase (Hendzel et al, 1997). If cells are delayed or arrested at mitosis, an increase in phospho-histone H3 positive cells should be observed. Instead, we found that the depletion of LIN-9 in BJ cells resulted in a reduction of phospho-histone H3 positive cells compared to control cells (Figure 1E), suggesting that depletion of LIN-9 delays G2. To better assess the role of LIN-9 in cell cycle progression, BJ-ET cells were pulse-labeled in S-phase with BrdU for 1 h. After the pulse, BrdU was washed away and the progression of BrdU-positive cells through the cell cycle was monitored by flow cytometry. Within 9 h, about 31% of the BrdU-positive cells had progressed from S into the next G1 phase in control-infected cells (Figure 1F). In contrast, in LIN-9 depleted cells, only about 12% of the BrdU-positive cells had progressed to the next G1 phase within this period. These data indicate that depletion of LIN-9 delays the progression from S through G2/M and into the next G1 phase. We next determined the length of S-phase by analyzing the movement of BrdU positive cells relative to cells in G1 and G2 (Begg et al, 1985). We found that the DNA-synthesis time of LIN-9 depleted cells was not significantly different from that of control infected cells (Figure 1G). To confirm these findings in a different system, we synchronized SHEP neuroblastoma cells in S-phase and performed BrdU pulse labeling. BrdU-positive cells were followed through the cell cycle as described above. As shown in Figure 1H, control cells and LIN-9 depleted cells entered G2/M with similar kinetics, suggesting that S-phase is not significantly prolonged in LIN-9 depleted SHEP cells. However, exit of LIN-9 depleted cells from G2/M was significantly delayed compared to control cells. After 9 h, 55% of the BrdU-positive cells were still in G2/M. Consequently, the appearance of BrdU-positive cells in the next G1 phase was delayed in LIN-9 depleted cells (Figure 1H). Taken together these data show that suppression of LIN-9 delays but does not block G2/M progression. To test whether suppression of LIN-9 results in a prolonged G2 phase or in delayed progression through mitosis, we measured the mitotic index following exposure to the microtubuli inhibitor nocodazole. Accumulation of mitotic cells in the presence of nocodazole was reduced in LIN-9 depleted cells, suggesting that suppression of LIN-9 delayed progression from G2 into M (Figure 1I). Overall these results demonstrate that depletion of LIN-9 induces a G2 delay. We concluded that LIN-9 is required for the normal progression from G2 into mitosis.
Figure 1.

LIN-9 is required for entry into mitosis. (A) LIN-9 protein in hTERT immortalized primary BJ fibroblasts (BJ-ET) and in SHEP cells infected with the indicated retroviral shRNA vectors was analyzed by immunoprecipitation followed by immunoblotting. β-Tubulin was detected by immunoblotting. (B) Control and LIN-9 depleted BJ-ET cells were passaged according to a 3T3-like protocol. At every passage, the increase in cell number was determined and the cumulative growth was calculated. (C) FACS analysis of control and LIN-9 depleted BJ-ET cells. A representative experiment is shown. (D) Control cells and LIN-9 depleted cells were labeled with BrdU and analyzed by FACS to determine the fraction of cells in each phase of the cell cycle. Data are from three independent experiments. (E) Phospho-histone H3 positive cells (control infected BJ cells and LIN-9 depleted BJ cells) were identified by immunostaining. Data are from three independent experiments. (F) Control infected cells or LIN-9 depleted BJ-ET cells were pulsed for 1 h with BrdU and analyzed by FACS immediately or 9 h later. The fraction of BrdU-positive cells that progressed to the next G1 phase within the 9 h pulse was determined. Data are from three independent experiments. (G) S-phase length was determined by BrdU-pulse chase labeling as described by Begg et al (1985). Data are from five independent experiments. (H) SHEP cells were grown to confluence to induce cell cycle arrest in G1 and then released into the cell cycle by replating. At 18 h later (at which time most of the cells were in S-phase), they were pulsed with BrdU. At the start of the experiment, 66.25% (control cells) and 70.28% (LIN-9 depleted cells) were BrdU positive. BrdU was washed away and movement of BrdU positive cells into G2/M (left panel) or into the G1 phase of the next cell cycle (right panel) was followed by FACS. A representative experiment is shown. (I) Mitotic index of LIN-9 depleted SHEP cells and control infected SHEP cells following exposure to nocodazole. A representative experiment is shown.
LIN-9 is required for the expression of a cluster of G2/M genes
We next sought to address how depletion of LIN-9 results in G2 accumulation. Because LIN-9 is a chromatin-associated protein that cooperates with pRB to activate genes (Gagrica et al, 2004), we reasoned that the cell cycle defects of LIN-9 depleted cells are due to abnormal gene expression. To systematically identify LIN-9 regulated genes, we used cDNA microarrays. Total RNA was isolated from LIN-9 depleted BJ-ET cells and control infected cells. Cy3 and Cy5 labeled cDNA probes were prepared and hybridized to a human cDNA microarray. Of the 11 500 cDNAs on the array, 103 genes showed consistent expression changes of at least 1.41-fold in three independent experiments. Of these, 36 genes were down- and 67 genes were upregulated in LIN-9 depleted cells (Supplementary Table 1). We noted that more than 30% of the genes that were downregulated in LIN-9 depleted cells are normally highly expressed in G2/M and/or are believed to have important functions in mitosis (Figure 2A and B). The products of these genes are required for entry into mitosis (CDC2, cyclin B1 and cyclin A2), mitotic spindle checkpoint (BUB1, CENP-E, BIRC5), spindle assembly (Aurora-A, Plk1), cytokinesis (Cep55), exit from mitosis (Ubch10) and nuclear reassembly after mitosis (LAP2). The remaining 24 downregulated genes encode for proteins with diverse functions (Supplementary Table 1A). Many of the genes that were upregulated in LIN-9 depleted cells have roles in differentiation and development. However, it is not possible to identify a distinct cluster with a common function within the upregulated genes (Supplementary Table 1B). It is notable, however, that expression of the cdk-inhibitor p21 is increased in LIN-9 depleted cells. It is possible that p21 contributes to accumulation of LIN-9 depleted cells in G2/M.
Figure 2.

LIN-9 is required for transcription of a cluster of G2/M specific genes. Percentage (A) and list (B) of downregulated G2/M genes in LIN-9 depleted BJ-ET cells as determined by cDNA microarrays. (C) Quantitative RT–PCRs of LIN-9 target genes in LIN-9 depleted cells relative to control infected BJ-ET cells. Expression was normalized to S14. (D) Western blot analysis of G2/M (cyclin A, cyclin B, cdc2, BIRC5), G1 (cyclin E, cyclin D1) and noncycling control proteins (CDK2 and β-tubulin) in control cells and LIN-9 depleted BJ-ET cells. (E) Cyclin B1-dependent kinase activity towards histone H1 in lysates of control and LIN-9 depleted BJ-ET cells. Immunoblotting of the same lysates with an anti-β-tubulin antibody served as a control. (F) Inhibition of G2/M transcription following suppression of LIN-9 is independent on p53. BJ-ET cells were first infected with a p53-specific retroviral shRNA vector or with a control vector. After selection, cells were transfected with control oligonucleotides or LIN-9 specific RNAi oligonucleotides. After 72 h, gene expression was determined by quantitative RT–PCR.
Quantitative real-time RT–PCR independently confirmed downregulation of G2/M genes in LIN-9 depleted cells (Figure 2C). Furthermore, cyclin B1, cyclin A2 and Birc5 were also downregulated on protein level while only a small decrease in CDC2 protein levels was observed. Importantly, the levels of G1-specific CDK2, cyclin E and cyclin D2 and of β-tubulin were all unchanged in LIN-9 depleted cells (Figure 2D). Depletion of LIN-9 not only resulted in decreased cyclin B1 mRNA and protein levels, but cyclin B associated kinase activity was also strongly reduced in LIN-9 depleted cells compared to control infected cells (Figure 2E). Taken together, our results indicate that LIN-9 is required for expression of a cluster of G2/M specific genes. Our finding of reduced cyclin B1 kinase activity, together with the known requirement for cyclin B1 for entry into mitosis, suggests that the inhibition of cyclin B1 contributes to delayed G2 to M progression of LIN-9 depleted cells.
Depletion of LIN-9 does not activate DNA-damage pathways
DNA-damage can result in G2 arrest and in transcriptional inhibition of G2/M genes (e.g. Badie et al, 2000; Crawford and Piwnica-Worms, 2001; Jackson et al, 2005). Using a marker for the DNA-damage response, phosphorylated histone H2AX (γ-H2AX), the same low background staining was observed in LIN-9 depleted cells and in control cells, suggesting that DNA-damage pathways are not constitutively activated when LIN-9 is suppressed (Supplementary Figure S2). Because p53 has been implicated in repression of G2/M genes (St Clair et al, 2004; Imbriano et al, 2005 and references therein), we also tested whether p53 is required for inhibition of G2/M genes following suppression of LIN-9. However, shRNA mediated depletion of p53 did not overcome the inhibition of cyclin A2 and cyclin B1 expression by LIN-9 RNAi (Figure 2F). That the suppression of p53 was functional is suggested by low levels of p21 mRNA in p53-depleted cells (Figure 2F). Inhibition of G2/M genes following suppression of LIN-9 was also observed in the p53-negative T98G cell line (Figure 5). Taken together we conclude that inhibition of G2/M genes in LIN-9 depleted cells is not due to constitutive activation of DNA-damage response pathways and is independent on p53. These data also indicate that downregulation of G2/M genes does not require high levels of p21.
Figure 5.
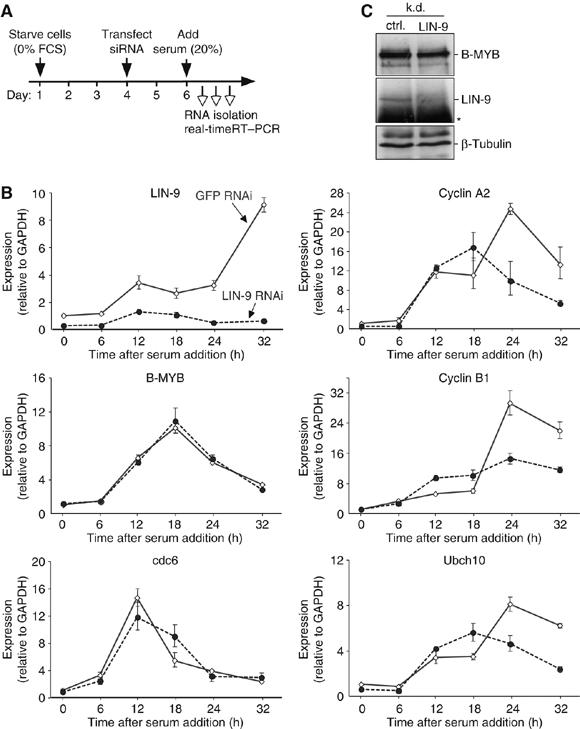
LIN-9 is required for activation of G2/M genes but not for their repression in quiescent cells. (A) Experimental design and time frame. (B) Gene expression during the cell cycle in control depleted cells and LIN-9 depleted T98G cells was analyzed by real-time RT–PCR and normalized to GAPDH. (C) Protein levels of B-MYB and LIN-9 in LIN-9 depleted and control-depleted, S-phase synchronized T98G cells. β-Tubulin served as a control. The asterisk denotes the heavy chain.
LIN-9 binds to the promoters of G2/M genes
We next wondered whether LIN-9 plays a direct role in regulation of G2/M genes. To test this possibility we used chromatin immunoprecipitation (ChIP) assays to analyze binding of LIN-9 to the promoters of G2/M genes. Because suppression of LIN-9 results in downregulation of genes expressed during S/G2/M, chromatin was isolated from S/G2/M enriched BJ-ET fibroblasts and immunoprecipitated with a polyclonal LIN-9 antiserum. As a negative control for nonspecific binding, normal IgG was used. Immunoprecipitated DNA was analyzed by quantitative real-time PCR (a scheme of the promoters is provided in Supplementary Figure S3). LIN-9 bound to the promoters of several LIN-9 regulated G2/M genes, including cyclin B1, cyclin A2, cdc2 and Plk1, but not to a region about 6 kb downstream of the cdc2 promoter or at the GAPDH2 promoter (Figure 3A). These data suggest that LIN-9 directly regulates the expression of G2/M genes.
Figure 3.
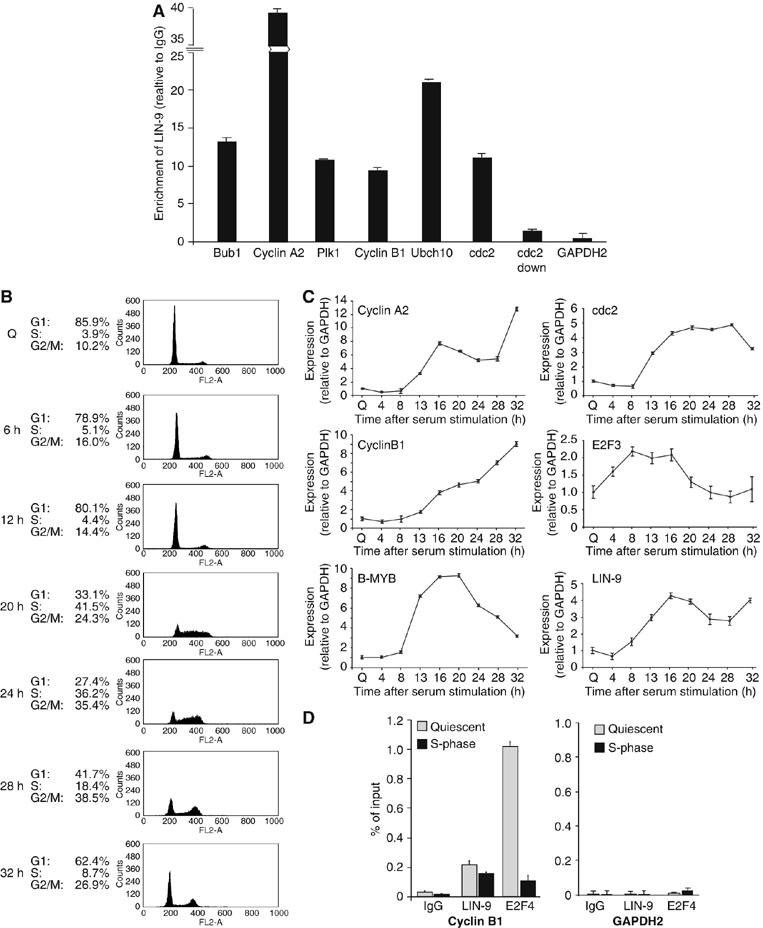
LIN-9 binds to promoters of G2/M genes. (A) Binding of LIN-9 to the indicated promoters was analyzed by ChIP with chromatin isolated from BJ-ET cells enriched in S/G2/M. As a control, chromatin was immunoprecipitated with nonspecific IgG. Bound DNA was analyzed by quantitative real-time PCR. Enrichment compared with Input DNA was calculated. As controls, the GAPDH2 promoter and a region 6 kb downstream of the cdc2 promoter were analyzed. The promoters and the location of PCR amplicons are schematically shown in Supplementary Figure S3. (B) FACS analysis of T98G cells synchronized in G0 by serum starvation and released into the cell cycle by the addition of serum. (C) Gene expression in synchronized T98G cells was determined by real-time RT–PCR. Expression levels were normalized to GAPDH. (D) Binding of E2F4 and LIN-9 to the cyclin B1 and GAPDH2 promoter in G0 and S phase. Chromatin was isolated from serum starved T98G cells and at 20 h after addition of serum. Chromatin was immunoprecipitated with antisera specific for LIN-9 or E2F4. Nonspecific IgG served as control.
To analyze whether LIN-9 specifically binds to G2/M promoters when they are active, we carried out ChIP experiments with chromatin isolated from synchronized cells. We used the human T98G glioblastoma cell line, which can be made quiescent by serum starvation, and, after serum re-stimulation progresses synchronously through G1 and S (Figure 3B). Cell cycle re-entry of T98G cells is accompanied by activation of E2F3, B-MYB, cyclin A2, cyclin B1 and cdc2 expression (Figure 3C). LIN-9 mRNA levels also increase during cell cycle re-entry. Peak LIN-9 mRNA levels were detected at around 16–20 h after serum addition when the cells have entered S-phase. ChIP assays with chromatin isolated from quiescent and S-phase cells showed that E2F4 associates with the cyclin B1 promoter in quiescent cells when the promoter is repressed and is lost in S-phase when the promoter is activated, consistent with previous studies (Figure 3D) (Takahashi et al, 2000; Zhu et al, 2004). LIN-9, in contrast, was bound to the cyclin B1 promoter in quiescent and in S-phase cells (Figure 3D). In conclusion, although our experiments shown in Figure 2 suggest a role for LIN-9 in activation of G2/M genes, LIN-9 already associates with the repressed cyclin B1 promoter in quiescent cells.
LIN-9 associates with E2F4/p130 in quiescent cells and with B-MYB in S-phase
Because LIN-9 does not contain any recognizable DNA-binding domain, we reasoned that LIN-9 is indirectly recruited to G2/M promoters through transcription factors that regulate these promoters. Of the 12 LIN-9 regulated G2/M genes, at least nine have been described as E2F targets (Supplementary Table 1A). Where analyzed E2F has a dual role in the regulation of these genes with E2F4 acting as a repressor in quiescence and E2F1-3 as activators in S/G2/M. Three of the LIN-9 -dependent G2/M genes (cyclin A2, cyclin B1 and cdc2) have also been shown to depend on B-MYB for activation in G2 (Zhu et al, 2004). Because the Drosophila homolog of LIN-9 (Mip130) is part of a multisubunit complex that contains E2F and B-MYB transcription factors (see Introduction), we next explored the possibility that LIN-9 associates with E2F or B-MYB. To address this, we performed co-immunoprecipitation experiments. Lysates from quiescent T98G cells and from S/G2-phase cells were co-immunoprecipitated with polyclonal antibodies to E2F3, E2F4, B-MYB and LIN-9. Associated proteins were detected by immunoblotting. As expected, E2F4–p130 complexes were readily detected in quiescent cells (Figure 4A). The interaction between E2F4 and p130 was disrupted in S-phase as described previously (Mayol et al, 1996; Moberg et al, 1996). By performing immunoprecipitations with LIN-9 antiserum, no association between LIN-9 and the activating E2F3 protein could be detected. In contrast, LIN-9 co-immunoprecipitated with E2F4 and p130 in quiescent cells. Interestingly, in S-phase the association between LIN-9 and E2F4/p130 was disrupted, and at that time an association between LIN-9 and B-MYB could be detected. Thus, during cell cycle entry, LIN-9 switches from the repressive p130/E2F4 complex to the activating B-MYB. These data are consistent with the ChIP assays and suggest that LIN-9 is recruited to the cyclin B1 promoter in quiescent cells by E2F4/p130 complexes and in S-phase by a B-MYB complex.
Figure 4.
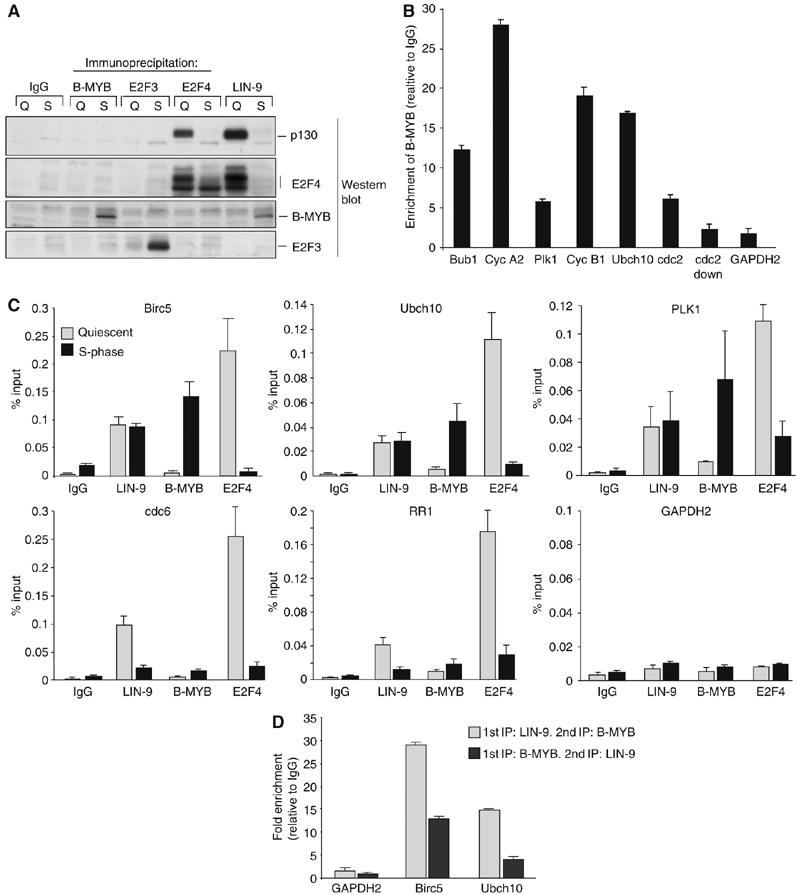
LIN-9 switches during cell cycle re-entry from E2F4/p130 to B-MYB. (A) Lysates from quiescent and S-phase T98G cells were immunoprecipitated with nonspecific IgG (control) or with E2F3, E2F4, B-MYB or LIN-9-specific antisera. Immunoprecipitations were immunoblotted for p130, E2F3, E2F4 and B-MYB. (B) Binding of B-MYB to promoters of G2/M genes was analyzed by ChIP with chromatin isolated from BJ-ET cells synchronized in S/G2/M. For details see legend of Figure 3A. (C) Binding of LIN-9, B-MYB and E2F4 to the promoters of E2F-regulated G2/M genes (Ubch10, Birc5, Plk1), G1/S genes (cdc6, RR1) or to the GAPDH2 promoter (control) in G0 and S phase was analyzed by ChIP. Chromatin was isolated from serum starved T98G cells (quiescent) and at 20 h after addition of serum (S-phase). Chromatin was immunoprecipitated with antisera specific for LIN-9 or E2F4 and B-MYB. Nonspecific IgG served as control. (D) Re-ChIP experiments with chromatin from T98G cells. S-phase chromatin was immunoprecipitated with IgG or B-MYB or LIN-9 antibodies followed by elution with DTT and reprecipitation (Re-ChIP) with reciprocal antibodies. Data are normalized to 1% input and are expressed relative to IgG (fold enrichment).
One prediction of such a model is that B-MYB and LIN-9 associate with an overlapping set of promoters. B-MYB has already been shown to associate with the cyclin A2, cyclin B1 and cdc2 promoters (Zhu et al, 2004). However, it is not known whether B-MYB binds to a larger set of G2/M promoters. ChIP assays with chromatin isolated from BJ fibroblasts indeed demonstrated binding of B-MYB to the promoters of LIN-9 regulated genes, consistent with a model in which LIN-9 and B-MYB together regulate G2/M expression (Figure 4B). To further address this possibility we performed ChIP assays with promoters of E2F-regulated G1/S genes (cdc6 and RR1) and G2/M genes (Ubch10, Birc5, Plk1). E2F4 associated with these promoters specifically in quiescent cells (Figure 4C). LIN-9 bound to G2/M promoters in quiescent cells and in S-phase cells, consistent with the data in Figure 3D. Interestingly, LIN-9 was also detected at G1/S promoters in quiescent cells. However, in sharp contrast to G2/M promoters, LIN-9 dissociated from these promoters in S-phase. As expected, B-MYB did not bind to G1/S promoters at either time point but was recruited to G2/M promoters in S-phase. Thus, in S-phase, binding of LIN-9 to G2/M promoters coincides with the binding of B-MYB. To directly examine whether LIN-9 and B-MYB co-exist in a common complex on G2/M promoters, we performed ChIP-Re-ChIP experiments with chromatin isolated from S-phase cells (Figure 4D). When LIN-9 or B-MYB primary immunoprecipitations were eluted and immunoprecipitated with reciprocal antibodies, binding to the Ubch10 and Birc5 promoters but not to the GAPDH2 promoter was detected, suggesting that LIN-9 and B-MYB collocate on G2/M promoters. These findings are consistent with the results in Figure 4A that demonstrate association between LIN-9 and B-MYB and suggest a model in which LIN-9 is recruited to G2/M promoters in S-phase by B-MYB.
Role of LIN-9 in activation of G2/M genes
Our cDNA microarray data suggest a role for LIN-9 in activation of G2/M genes in asynchronously growing cells. However, because LIN-9 associates with quiescent and active G2/M promoters, we cannot exclude a role for LIN-9 in repression of these genes during quiescence. To address this possibility, LIN-9 was depleted in serum-starved T98G cells by RNAi (Figure 5A). Cell cycle re-entry was induced by serum addition and samples were taken at the indicated times to analyze gene expression by real-time RT–PCR. Gene expression was normalized to GAPDH. LIN-9 expression was efficiently downregulated by the RNAi approach (Figure 5B). In quiescent cells, repression of cyclin B1, cyclin A2 and ubch10 was not affected by depletion of LIN-9, suggesting that repression of these genes in G0 does not require LIN-9. During cell cycle re-entry, expression of G2/M genes increased in control cells. Up to 18 h following addition of serum, a comparable increase was observed in LIN-9 depleted cells. However, peak expression levels of cyclin B1, cyclin A2 and ubch10 in S and G2 were significant reduced in LIN-9 depleted cells. Depletion of LIN-9 had no influence on the expression of cdc6, an E2F-regulated gene that is activated in G1/S. Importantly, the requirement for LIN-9 in activation of G2/M genes is not an indirect effect of reduced B-MYB expression because depletion of LIN-9 did not significantly alter B-MYB mRNA or protein levels (Figure 5B and C, see also Figure 6B). In conclusion, although LIN-9 associates with repressed and active G2/M promoters, LIN-9 is only required for their activation during S and G2.
Figure 6.

LIN-9 interacts with the C-terminus of B-MYB. (A) Lysates of HeLa cells were immunoprecipitated and immunoblotted with the indicated antisera (Pre=preimmunserum). (B) Association between LIN-9 and B-MYB in control transfected cells and in LIN-9 depleted HeLa cells. (C) Lysates of HeLa cells expressing HA-LIN-9 and flag-B-MYB mutants (see D) were immunoprecipitated with flag-antiserum and immunoblotted with an anti-HA-antibody. Ten percent of total lysate was immunoblotted (Input). HDAC2 was used as positive control because B-MYB has been shown to interact with N-CoR and SMRT corepressor that associate with HDACs (Masselink et al, 2001; Li and McDonnell, 2002) (D) Scheme of B-MYB mutants (adopted from Johnson et al, 2002) and summary of binding data. Asterisks indicate the location of the mutated sites in 15mut.
LIN-9 associates with the C-terminus of B-MYB
Because our expression studies suggested a role for LIN-9 together with B-MYB in gene activation, we further focused on the interaction between LIN-9 and B-MYB. To independently confirm the association of LIN-9 with B-MYB, we performed co-immunoprecipitation assays from human HeLa cell extracts. As shown in Figure 6A, endogenous B-MYB co-precipitated with a LIN-9 specific antiserum and vice versa. Furthermore, when LIN-9 was depleted by RNAi in HeLa cells, a comparable reduction in LIN-9-bound B-MYB and total LIN-9 was observed, strongly suggesting that the association between LIN-9 and B-MYB is specific (Figure 6B).
Next, we characterized the binding site for LIN-9 in B-MYB with a set of B-MYB deletion mutants that have previously been characterized (Figure 6D; Johnson et al, 2002). Flag-tagged versions of the various B-MYB constructs were co-expressed together with HA-LIN-9 in HeLa cells and the interaction between LIN-9 and B-MYB was examined by co-immunoprecipitations (Figure 6C). Association of flag-tagged B-MYB and HA-tagged LIN-9 was readily detected (Figure 6C, lane 4). It is evident that the N-terminus of B-MYB is not required for the interaction with LIN-9 (Figure 6C, lane 5). In contrast, partial deletion of the C-terminus of B-MYB reduced binding to LIN-9 (lane 7) and a larger deletion abolished LIN-9 binding (lane 11). A conserved region within the C-terminus of B-MYB was not necessary for binding to LIN-9 (lane 8). We conclude that LIN-9 associates with the regulatory C-terminus of B-MYB that plays a positive role in transcriptional activation by B-MYB. Because transactivation by B-MYB is regulated by phosphorylation by cyclin A/cdk2, we also investigated the possibility that association with LIN-9 is dependent on B-MYB phosphorylation. To do so, we used a phosphorylation site mutant of B-MYB (15mut) that has been described before (Johnson et al, 2002). Since LIN-9 associated with 15mut (lane 9) and because the interaction between wt B-MYB and LIN-9 was also not perturbed by a dominant-negative CDK2 (data not shown), this suggests that binding of LIN-9 to B-MYB is independent of cyclin A/cdk2 mediated phosphorylation.
B-MYB is required for entry into mitosis
Our above-noted data indicate that LIN-9 and B-MYB are together involved in activation of G2/M genes. One prediction from these results is that the phenotypes of B-MYB and LIN-9 depleted cells are comparable. To test this possibility, we designed a retroviral shRNA vector directed against B-MYB. Immunoblot and RT–PCR analysis demonstrated efficient downregulation of B-MYB in HeLa and BJ-ET cells by this shRNA (Figure 7A and F). We found that B-MYB knockdown cells, similar to LIN-9 depleted cells, grow significantly slower than control cells and that they accumulate in G2/M (Figure 7B and C). Phospho-histone H3 positive cells are reduced in B-MYB depleted cells compared to control cells, suggesting that B-MYB depleted cells do not arrest in mitosis (Figure 7D). Furthermore, reduced accumulation of mitotic cells following exposure to nocodazole was observed in B-MYB-depleted cells (Figure 7E). The length of S-phase in B-MYB depleted cells as determined by FACS analysis of BrdU-pulse labeled cells was 11.6±0.6 h (n=3), comparable to the S-phase length of control cells (see Figure 1G). Together these data demonstrate that depletion of B-MYB delays the G2 to M transition. Importantly, depletion of B-MYB in BJ-ET fibroblasts resulted in downregulation of LIN-9 dependent G2/M genes as shown by real-time RT–PCR (Figure 7F), consistent with binding of B-MYB to the promoters of G2/M genes (see Figure 4B). To test whether LIN-9 always regulates transcription together with B-MYB, we analyzed the expression of Cct4, Dpyd and flotillin. These genes were downregulated in LIN-9 depleted cells but have no known function in G2/M (Supplementary Table 1B). We found that the expression of these genes was not significantly changed in B-MYB depleted cells (Supplementary Figure S4). p21 and Adfp were upregulated in LIN-9-depleted cells, but not in B-MYB-depleted cells (Supplementary Table 1A; Supplementary Figure S4). Thus, G2/M genes, but not the other genes, are regulated together by B-MYB and LIN-9. It remains to be shown whether any of these genes are direct targets of LIN-9.
Figure 7.

B-MYB is required for the expression of G2/M genes and for the transition through G2/M. (A) Immunoblot of B-MYB and β-tubulin using extracts from HeLa cells transfected with control or the B-MYB shRNA plasmid. (B) Growth of B-MYB depleted BJ-ET cells was analyzed as described in Figure 1B. (C) BrdU-FACS analysis of BJ-ET cells infected with the indicated shRNA viruses or with a control virus. The absolute change in G1, S and G2/M cells compared to control infected cells is shown. Data are from three different experiments. Error bars represent standard deviation. (D) Mitotic cells were identified in control infected BJ-ET cells and B-MYB depleted BJ-ET cells by immunostaining using a phospho-histone H3 antibody. Data are from three independent experiments. Error bars represent standard deviation (E) Mitotic index of B-MYB depleted SHEP cells and control infected SHEP cells following exposure to nocodazole. (F) Real-time RT–PCR analysis of the indicated genes in B-MYB depleted and control infected BJ-ET cells. Expression was normalized to S14. (G). B-MYB and/or LIN-9 were depleted in starved T98G cells by RNAi as described in Figure 5. Gene expression following re-addition of serum was analyzed by real-time RT–PCR. Expression levels were normalized to GAPDH. (H) Model for the role of LIN-9 and B-MYB in the regulation of transcription at G2/M.
To determine whether LIN-9 and B-MYB cooperate in activation of G2/M genes during the cell cycle, B-MYB was either depleted alone or together with LIN-9 in serum-starved T98G cells by RNAi as described in Figure 5. During cell cycle re-entry, expression levels of cyclin B1 and cyclin A2 were reduced in B-MYB depleted cells, consistent with recent reports that B-MYB is required for activation of these genes (Figure 7G) (Zhu et al, 2004). Unlike LIN-9, however, which was only required for peak activation in S and G2, B-MYB was also required for the initial activation of these genes during earlier phases of cell cycle re-entry. Co-depletion of LIN-9 and B-MYB resulted in a further reduction in cyclin A2 and cyclin B1 expression. Consequently, activation of these genes was almost completely diminished. In conclusion, B-MYB and LIN-9 regulate an overlapping set of G2/M genes and they both have very similar biological roles in the G2/M transition.
Discussion
In this study we document that LIN-9, together with B-MYB, regulates a cluster of G2/M genes. Although we have previously shown that LIN-9 binds to pRB (Gagrica et al, 2004), binding of LIN-9 to B-MYB (this study) appears to be independent of pocket proteins because size exclusion chromatography indicated that B-MYB/LIN-9 complexes are larger than pRB or p107 and p130 containing complexes (data not shown). Binding of LIN-9 to B-MYB is consistent with recent results from Drosophila, which indicate that dMYB forms a tight complex with four proteins including Mip130, the evolutionary homolog of LIN-9 (Beall et al, 2002).
Suppression of either LIN-9 or B-MYB by RNAi is associated with a number of phenotypes including reduced proliferation, accumulation of cells in G2 and delayed entry into mitosis consistent with the reduced expression of G2/M genes in LIN-9 and B-MYB depleted cells. That transcription of G2/M genes was reduced but not abolished in B-MYB or LIN-9 depleted cells might be explained by the incomplete suppression of these proteins by the RNAi approach. This notion is also supported by the observation that co-depletion of LIN-9 and B-MYB further reduces G2/M transcription. However, it is likely that other transcription factors, such as NF-Y and FoxM1 which regulate an overlapping set of genes compared to LIN-9 and B-MYB, contribute to expression of G2/M genes in LIN-9 and B-MYB depleted cells (Fung and Poon, 2005; Laoukili et al, 2005).
Our observation that B-MYB directly regulates several mitotic genes is consistent with studies in several different organisms where B-MYB is required for the expression of cyclin B (Okada et al, 2002; Zhu et al, 2004; Shepard et al, 2005). Inactivation of MYB in Drosophila and zebrafish results in mitotic arrest as evidenced by increased phospho-H3 staining (Fung et al, 2002; Okada et al, 2002). A mitotic arrest was also observed in B-MYB depleted human HEL cells (Garcia and Frampton, 2006). In contrast to these findings, in our system, depletion of B-MYB caused a slowdown of G2 accompanied by a reduction in phospho-histone H3 staining. Thus, whether inactivation of B-MYB arrests cells in G2 or in M phase may be cell-type dependent.
In addition to its role in mitosis, Drosophila dMYB is also required for normal S-phase progression (Fitzpatrick et al, 2002; Manak et al, 2002). A similar role in S-phase has been described for B-MYB during differentiation of human megakaryocytes (Garcia and Frampton, 2006). It is possible that stalled DNA replication and activation of DNA-damage response pathways contributes to the mitotic arrest following B-MYB inactivation. In our experimental system of LIN-9 and B-MYB depleted cells, however, we did not observe a significant S-phase delay. Furthermore, depletion of LIN-9 does not increase γ-H2AX staining, one hallmark of the DNA-damage response, and it did not increase cdc2 tyrosine 15 phosphorylation (data not shown), indicating that DNA-damage response pathways are not activated in LIN-9 depleted cells. Further evidence against an indirect stress response is provided by the observation that RNAi mediated depletion of p53 did not overcome downregulation of G2/M genes following depletion of LIN-9.
Our observation that LIN-9 and B-MYB bind to the promoters of G2/M genes suggests that these proteins directly regulate the expression of these genes, raising important questions about the underlying mechanisms. Unlike B-MYB, LIN-9 is already associated with repressed promoters in quiescent cells, and our data suggest that this interaction is mediated through repressive E2F4/p130 complexes. During cell cycle re-entry, E2F4 dissociates from G2/M promoters while LIN-9 is retained. Thus, on these promoters LIN-9 switches from a repressive E2F4/p130 complex to the activating B-MYB (Figure 7H). Although further biochemical studies will be necessary to identify the exact composition of human synMuv-like complexes, data to be presented elsewhere indicate that additional human homologs of other synMuv proteins also switch from E2F4 in quiescent cells to B-MYB in S-phase (Fabienne Schmit and Stefan Gaubatz, unpublished observation). It is possible that LIN-9 is involved in the recruitment of co-activators to B-MYB. In this regard, B-MYB has been shown to interact with a number of positive acting co-factors such as p300 (Sala, 2005). An alternative model is that B-MYB and LIN-9 are required to inactivate the repressive p130/E2F4 complex on G2/M promoters. In this model, in the absence of LIN-9, the repressor cannot be inactivated and target gene expression is reduced.
A role for Drosophila dMYB in switching repressive dREAM/Myb-MuvB complexes from transcriptional repression to activation has recently been proposed (Beall et al, 2004; Lewis et al, 2004). Despite these similarities there are also important differences to the function of the Drosophila complex. First, Drosophila LIN-9/Mip130 is required for gene repression. In contrast, human LIN-9, at least for the genes analyzed, is a passive component of the repressing complex. It is possible that in the mammalian system E2F4-regulated genes are repressed by multiple redundant mechanisms. Inactivation of one component may not be sufficient to relieve repression. Secondly, mammalian B-MYB expression is cell cycle dependent and thus is not part of the repressive E2F4/p130 complex in quiescent cells. Third, in Drosophila the absence of LIN-9/Mip130 causes a destabilization of the dMyb protein (Beall et al, 2004). No such effect was seen in human cells. Finally, inactivation of Drosophila LIN-9/Mip130 suppresses the lethality of dMyb mutant flies (Beall et al, 2004). In our study, LIN-9 and B-MYB cooperate in the activation of a cluster of G2/M genes (Figure 7G). Thus, the loss of LIN-9 appears not to suppress the phenotype of B-MYB depletion.
Given that LIN-9 is required for proliferation and activation of genes at G2/M, it is surprising that LIN-9 can also function as tumor suppressor in the pRB pathway (Gagrica et al, 2004). The important role of LIN-9 in proliferation suggests that misexpression of LIN-9 could even play a positive role in tumorigenesis. Thus, it is tempting to speculate that LIN-9 is a member of the growing list of proteins that can alternatively function as oncogenes or tumor suppressors depending on the cellular context (Rowland and Peeper, 2006). There is circumstantial evidence for a dual role of LIN-9 in tumorigenesis. First, in support of a tumor-promoting function, 40–50% of tumors of the ovary and uterus show an upregulation in LIN-9 expression compared to matched normal tissues (Supplementary Figure S5). In contrast, 80% of thyroid tumors show a significant decrease in LIN-9 expression, suggesting that it may function as tumor suppressor in this context. In these tumors, additional mutations might overcome the requirement for LIN-9 in proliferation. There are indications that B-MYB can also have both tumor-promoting and tumor-suppressing activities. For example, it has been observed that B-MYB expression is associated with a poor prognosis in neuroblastoma (Sala, 2005). On the other hand, B-MYB has been shown to function as a haploinsuffcient tumor suppressor in zebrafish (Shepard et al, 2005). In the same body of work, re-analysis of cDNA microarray data from human tumors revealed that low levels of B-MYB might contribute to tumorigenesis in the context of wild-type p53. Although how decreased expression of B-MYB promotes cancer is unclear, it has been suggested that the underlying cause is a misregulation of mitosis that results in genomic instability (Shepard et al, 2005). In this regard, it is interesting to note that we found B-MYB and LIN-9 not only to be required for the expression of genes that promote entry into mitosis, but also for components of the mitotic spindle checkpoint. A malfunctioning mitotic checkpoint can result in abnormal segregation of chromosomes and aneuploidy and may contribute to tumor formation (Weaver and Cleveland, 2005). Mitotic checkpoint defects have been described following the RNAi mediated inactivation of BIRC5, BUB1 and CENP-E (Carvalho et al, 2003; Weaver et al, 2003; Yang et al, 2004; Meraldi and Sorger, 2005), all of which were identified as genes regulated by LIN-9 and B-MYB in this study. We repeatedly observed a small (<two-fold) increase in >4n cells in LIN-9 and B-MYB depleted BJ-ET fibroblasts (data not shown). Whether this effect contributes to tumor formation in vivo remains to be investigated. Clearly, additional work is necessary to clarify the roles of LIN-9 and B-MYB in tumorigenesis.
Materials and methods
Cell lines, retroviral infections (shRNA) and growth curves
hTERT immortalized BJ fibroblasts expressing the ecotrophic retroviral receptor (BJ-ET) were described before (Voorhoeve and Agami, 2003). BJ-ET, HeLa, T98G cells and Phoenix cells were cultivated in DMEM with 10% FCS. SHEP-E cells stably expressing the ecotrophic receptor were cultivated in RPMI with 10% FCS supplemented with 100 μg/ml hygromycin B. Retroviral infections with shRNA viruses were performed as described (Gagrica et al, 2004). Infected cells were selected for 4 days with 5–10 μg/ml Blasticidin. For growth curves 1 × 10⁵ BJ-ET cells were seeded in triplicates in six-well dishes and passaged according to a 3T3-like protocol. Every third day, cells were trypsinized, counted and seeded again at a concentration of 1 × 10⁵ per well of a six-well dish. The cumulative increase in cell number was calculated.
Immunostaining and mitotic index
Cells were plated onto coverslips in 30 mm cell culture dishes and fixed in 3% paraformaldehyde and 2% sucrose in PBS for 10 min at room temperature. Where indicated, cells were incubated with 200 ng/ml of nocodazole before fixation. Cells were permeabilized with 0.2% Triton X-100 in PBS for 5 min and incubated with primary antibody at room temperature for 1 h. The following primary antibodies were used: anti-phospho-H3 and anti-gamma H2AX (both from Upstate). Secondary antibody conjugated to rhodamine was used in a dilution of 1:200 (Jackson Immunoresearch). Nuclei were counterstained with 1 μg/ml of Hoechst 33258 (Sigma) in PBS. At least 500 nuclei were counted.
Transfection, immunoblotting and immunoprecipitation
HeLa cells were transfected with 10 μg expression plasmids as indicated using standard procedures. Transfected and untransfected HeLa cells were lysed in TNN (50 mM Tris pH 7.4, 150 mM NaCl, 0.5% NP-40, protease inhibitors (Sigma), 1 mM DTT). Nuclear extracts were prepared from serum-starved T98G cells and from cells re-stimulated for 20 h as described previously (Lindeman et al, 1997). Proteins were separated by SDS gel electrophoresis and transferred to Immobilon-P (Millipore). For immunoprecipitations, lysates were immunoprecipitated with the indicated antisera over night at 4°C. Immunoprecipitates were collected on Protein A Sepharose and washed five times in TNN. Proteins were detected by immunoblotting.
BrdU pulse labeling and flow cytometry
Cells were fixed at different time points in 80% ethanol at −20°C. DNA was denatured with 2 M HCl, 0.5% Triton X-100 for 30 min at RT followed by neutralization with 0.1 M sodium borate. 1 × 10⁶ cells were incubated in PBS, 0.5% Tween-20, 1% BSA with 20 μl FITC-labeled α-BrdU antibody (Beckton Dickinson) for 30 min at RT. Afterwards cells were washed one time with PBS, 0.5% Tween-20, 1% BSA. DNA was stained with 69 μM propidium iodide in 38 mM sodium citrate and 100 μg/ml RNase A for 30 min at 37°C. Samples were analyzed in a Becton Dickinson FACS Calibur. Average data and standard deviation were calculated from at least three BrdU-labeling experiments. S-phase length was determined by BrdU-pulse labeling as described by Begg et al (1985).
cDNA microarrays
Total RNA was purified with RNeasy spin columns (Qiagen). Cy3 and Cy5 labeled cDNA probes were generated in a two-step procedure using the CyScribe Post-Labelling Kit (Amersham Biosciences). The first step involves the incorporation of amino allyl-dUTP during cDNA synthesis by CyScript-RT. In the second step, the amino allyl-modified cDNA was chemically labeled with CyDye NHS-esters. The coupling reactions of amino allyl-modified cDNA were performed separately with Cy3 and Cy5. Cy3- and Cy5-labeled probes were purified with Qiagen spin colums, combined and hybridized to a cDNA microarray for 16 h at 55°C and washed at a stringency of 0.1 × SSC/0.1% SDS and 0.1 × SSC. The microarray contains 11.551 DNA spots from the human cDNA library ‘Human Sequence-Verified cDNA UniGene Gene Sets gf200, gf201u and gf202' (Invitrogen). cDNA microarrays were analyzed using Scan Array Express and Software from Perkin Elmer. Each experiment was performed as a flip color and a sandwich hybridization using two arrays. The microarray experiment was repeated a total of three times with independent RNA samples. For each spot, median signal and background intensities for both channels were obtained. To account for spot differences, the background-corrected ratio of the two channels were calculated and log2 transformed. To balance the fluorescence intensities for the two dyes, as well as to allow for comparison of expression levels across experiments, the raw data were standardized. We used the printtip-lowess normalization to correct for inherent bias on each chip (Yang et al, 2001) Expression data and gene annotations were stored in Array Express (http://www.ebi.ac.uk/arrayexpress/) (accession number E-MEXP-752), which complies with MIAME (minimal information about a microarray experiment) guidelines. The R environment (http://www.r-project.org/) was used for gene filtering and normalization of the data. The SAM (Significance analysis of microarrays) statistics was used to select for differentially expressed genes (Tusher et al, 2001). We used the Microsoft Excel Add-In for SAM, which we obtained from http://www-stat.stanford.edu/~tibs/SAM (version 1.23). Parameters were set as follows to analyze the one-class data set: 1000 permutations, k-nearest neighbor imputer with 10 neighbors and 30 212 908 as seed for random number generator. A median FDR of 0.05 was taken as cutoff for the selection of differentially expressed genes.
Plasmids and antibodies
Plasmids and antibodies are listed in Supplementary Data.
Oligonucleotide mediated RNA interference
RNAi oligonucleotides (Dharmacon) targeting LIN-9 (nucleotides 902-924, BC045625) and/or or B-MYB (nucleotides 1012-1030, BC053555) were transfected using oligofectamine (Invitrogen). As a control non-targeting siRNA1 was used (Dharmacon).
RT–PCR
RNA was isolated with RNeasy spin columns according to the manufacturers instructions (Qiagen). RNA (2.5 μg) was reverse transcribed with 200 U M-MLV-RT (Invitrogen). cDNA was amplified by real-time PCR and detected with SYBR green using the ABI Prism 7700 or the Mx3000 (Stratagene) detection system. Primer sequences are available upon request. Expression differences were calculated as following: fold induction/repression=2−ΔΔCt (ΔΔCt=ΔCt sample−ΔCt reference with ΔCt=Ctgene−Ctreference). Experiments were repeated at least three times and PCR reactions were always performed in triplicates. The standard deviation of ΔΔCt values was calculated according to  where s1 and s2 are the standard deviation of the gene and control gene (GAPDH) values. The range given for the gene relative to the control sample is determined by calculating the expression=2−ΔΔCt+s and=2−ΔΔCt−s, where s is the standard deviation of the ΔΔCt value.
Chromatin immunoprecipitation
ChIP was essentially performed as described previously (Wells et al, 2000). Briefly, crosslinked chromatin was sonicated to an average length of 500–1000 nucleotides and immunoprecipitated with 4 μg of the following antibodies: LIN-9 (Gagrica et al, 2004), B-MYB (2 μg each of sc-724 and sc-13028), p130 (sc-317), E2F4 (sc-1082) (Santa Cruz). As a control, chromatin was immunoprecipitated with normal IgG (Sigma). Five to ten percent of the precipitated DNA was amplified by real-time PCR. In parallel, input chromatin was analyzed. Enrichment on a given promoter relative to input chromatin was calculated according to: % of input=2ΔCt (with ΔCt=CtInput(1%) −CtImmunoprecipitation). As controls, a region 6 kb downstream of the cdc2 promoter and the promoter of the GAPDH2 gene were used. Primer sequences are available upon request. In Re-ChIP experiments, chromatin was eluted after the first immunoprecipitation in 100 μl 10 mM DTT for 30 min at 37°C. Eluted chromatin was diluted 1:20 in Re-ChIP buffer (20 mM Tris (pH 8.1), 1% Triton X-100, 2 mM EDTA, 150 mM NaCl, protease inhibitors) and subjected to the second immunoprecipitation.
Supplementary Material
Supplementary Materials and Methods
Supplementary Figure S1
Supplementary Figure S2
Supplementary Figure S3
Supplementary Figure S4
Supplementary Figure S5
Supplementary Table 1A
Supplementary Table 1B
Acknowledgments
We thank Drs Alexander Brehm, Martin Eilers (Marburg) and Ulrike Ziebold (Berlin) for discussions, Dr Michael Krause for help with the microarray experiments, Dr Robert Lewis (Nebraska) for B-MYB constructs, Drs Reuven Agami and Ingrid Kolfschoten (Netherlands) for BJ-ET cells and plasmids and Dr Bernd Berwanger (Marburg) for SHEP-E cells. This work was supported by grants from the VolkswagenStiftung and the DFG (Transregio 17) to SG.
References
- Badie C, Itzhaki JE, Sullivan MJ, Carpenter AJ, Porter AC (2000) Repression of CDK1 and other genes with CDE and CHR promoter elements during DNA damage-induced G(2)/M arrest in human cells. Mol Cell Biol 20: 2358–2366 [DOI] [PMC free article] [PubMed] [Google Scholar]
- Beall EL, Bell M, Georlette D, Botchan MR (2004) Dm-myb mutant lethality in Drosophila is dependent upon mip130: positive and negative regulation of DNA replication. Genes Dev 18: 1667–1680 [DOI] [PMC free article] [PubMed] [Google Scholar]
- Beall EL, Manak JR, Zhou S, Bell M, Lipsick JS, Botchan MR (2002) Role for a Drosophila Myb-containing protein complex in site-specific DNA replication. Nature 420: 833–837 [DOI] [PubMed] [Google Scholar]
- Begg AC, McNally NJ, Shrieve DC, Karcher H (1985) A method to measure the duration of DNA synthesis and the potential doubling time from a single sample. Cytometry 6: 620–626 [DOI] [PubMed] [Google Scholar]
- Carvalho A, Carmena M, Sambade C, Earnshaw WC, Wheatley SP (2003) Survivin is required for stable checkpoint activation in taxol-treated HeLa cells. J Cell Sci 116: 2987–2998 [DOI] [PubMed] [Google Scholar]
- Crawford DF, Piwnica-Worms H (2001) The G(2) DNA damage checkpoint delays expression of genes encoding mitotic regulators. J Biol Chem 276: 37166–37177 [DOI] [PubMed] [Google Scholar]
- Fitzpatrick CA, Sharkov NV, Ramsay G, Katzen AL (2002) Drosophila myb exerts opposing effects on S phase, promoting proliferation and suppressing endoreduplication. Development 129: 4497–4507 [DOI] [PubMed] [Google Scholar]
- Fung TK, Poon RY (2005) A roller coaster ride with the mitotic cyclins. Semin Cell Dev Biol 16: 335–342 [DOI] [PubMed] [Google Scholar]
- Fung SM, Ramsay G, Katzen AL (2002) Mutations in Drosophila myb lead to centrosome amplification and genomic instability. Development 129: 347–359 [DOI] [PubMed] [Google Scholar]
- Gagrica S, Hauser S, Kolfschoten I, Osterloh L, Agami R, Gaubatz S (2004) Inhibition of oncogenic transformation by mammalian Lin-9, a pRB-associated protein. EMBO J 23: 4627–4638 [DOI] [PMC free article] [PubMed] [Google Scholar]
- Garcia P, Frampton J (2006) The transcription factor B-Myb is essential for S-phase progression and genomic stability in diploid and polyploid megakaryocytes. J Cell Sci 119: 1483–1493 [DOI] [PubMed] [Google Scholar]
- Hendzel MJ, Wei Y, Mancini MA, Van Hooser A, Ranalli T, Brinkley BR, Bazett-Jones DP, Allis CD (1997) Mitosis-specific phosphorylation of histone H3 initiates primarily within pericentromeric heterochromatin during G2 and spreads in an ordered fashion coincident with mitotic chromosome condensation. Chromosoma 106: 348–360 [DOI] [PubMed] [Google Scholar]
- Imbriano C, Gurtner A, Cocchiarella F, Di Agostino S, Basile V, Gostissa M, Dobbelstein M, Del Sal G, Piaggio G, Mantovani R (2005) Direct p53 transcriptional repression: in vivo analysis of CCAAT-containing G2/M promoters. Mol Cell Biol 25: 3737–3751 [DOI] [PMC free article] [PubMed] [Google Scholar]
- Jackson MW, Agarwal MK, Yang J, Bruss P, Uchiumi T, Agarwal ML, Stark GR, Taylor WR (2005) p130/p107/p105Rb-dependent transcriptional repression during DNA-damage-induced cell-cycle exit at G2. J Cell Sci 118: 1821–1832 [DOI] [PubMed] [Google Scholar]
- Johnson LR, Johnson TK, Desler M, Luster TA, Nowling T, Lewis RE, Rizzino A (2002) Effects of B-Myb on gene transcription: phosphorylation-dependent activity and acetylation by p300. J Biol Chem 277: 4088–4097 [DOI] [PubMed] [Google Scholar]
- Korenjak M, Brehm A (2005) E2F-Rb complexes regulating transcription of genes important for differentiation and development. Curr Opin Genet Dev 15: 520–527 [DOI] [PubMed] [Google Scholar]
- Korenjak M, Taylor-Harding B, Binne UK, Satterlee JS, Stevaux O, Aasland R, White-Cooper H, Dyson N, Brehm A (2004) Native E2F/RBF complexes contain Myb-interacting proteins and repress transcription of developmentally controlled E2F target genes. Cell 119: 181–193 [DOI] [PubMed] [Google Scholar]
- Laoukili J, Kooistra MR, Bras A, Kauw J, Kerkhoven RM, Morrison A, Clevers H, Medema RH (2005) FoxM1 is required for execution of the mitotic programme and chromosome stability. Nat Cell Biol 7: 126–136 [DOI] [PubMed] [Google Scholar]
- Lewis PW, Beall EL, Fleischer TC, Georlette D, Link AJ, Botchan MR (2004) Identification of a Drosophila Myb-E2F2/RBF transcriptional repressor complex. Genes Dev 18: 2929–2940 [DOI] [PMC free article] [PubMed] [Google Scholar]
- Li X, McDonnell DP (2002) The transcription factor B-Myb is maintained in an inhibited state in target cells through its interaction with the nuclear corepressors N-CoR and SMRT. Mol Cell Biol 22: 3663–3673 [DOI] [PMC free article] [PubMed] [Google Scholar]
- Lindeman GJ, Gaubatz S, Livingston DM, Ginsberg D (1997) The subcellular localization of E2F-4 is cell-cycle dependent. Proc Natl Acad Sci USA 94: 5095–5100 [DOI] [PMC free article] [PubMed] [Google Scholar]
- Lipsick JS (2004) synMuv verite—Myb comes into focus. Genes Dev 18: 2837–2844 [DOI] [PubMed] [Google Scholar]
- Manak JR, Mitiku N, Lipsick JS (2002) Mutation of the Drosophila homologue of the Myb protooncogene causes genomic instability. Proc Natl Acad Sci USA 99: 7438–7443 [DOI] [PMC free article] [PubMed] [Google Scholar]
- Masselink H, Vastenhouw N, Bernards R (2001) B-myb rescues ras-induced premature senescence, which requires its transactivation domain. Cancer Lett 171: 87–101 [DOI] [PubMed] [Google Scholar]
- Mayol X, Garriga J, Grana X (1996) G1 cyclin/CDK-independent phosphorylation and accumulation of p130 during the transition from G1 to G0 lead to its association with E2F-4. Oncogene 13: 237–246 [PubMed] [Google Scholar]
- Meraldi P, Sorger PK (2005) A dual role for Bub1 in the spindle checkpoint and chromosome congression. EMBO J 24: 1621–1633 [DOI] [PMC free article] [PubMed] [Google Scholar]
- Moberg K, Starz MA, Lees JA (1996) E2F-4 switches from p130 to p107 and pRB in response to cell cycle reentry. Mol Cell Biol 16: 1436–1449 [DOI] [PMC free article] [PubMed] [Google Scholar]
- Okada M, Akimaru H, Hou DX, Takahashi T, Ishii S (2002) Myb controls G(2)/M progression by inducing cyclin B expression in the Drosophila eye imaginal disc. EMBO J 21: 675–684 [DOI] [PMC free article] [PubMed] [Google Scholar]
- Rowland BD, Peeper DS (2006) KLF4, p21 and context-dependent opposing forces in cancer. Nat Rev Cancer 6: 11–23 [DOI] [PubMed] [Google Scholar]
- Sala A (2005) B-MYB, a transcription factor implicated in regulating cell cycle, apoptosis and cancer. Eur J Cancer 41: 2479–2484 [DOI] [PubMed] [Google Scholar]
- Shepard JL, Amatruda JF, Stern HM, Subramanian A, Finkelstein D, Ziai J, Finley KR, Pfaff KL, Hersey C, Zhou Y, Barut B, Freedman M, Lee C, Spitsbergen J, Neuberg D, Weber G, Golub TR, Glickman JN, Kutok JL, Aster JC, Zon LI (2005) A zebrafish bmyb mutation causes genome instability and increased cancer susceptibility. Proc Natl Acad Sci USA 102: 13194–13199 [DOI] [PMC free article] [PubMed] [Google Scholar]
- St Clair S, Giono L, Varmeh-Ziaie S, Resnick-Silverman L, Liu WJ, Padi A, Dastidar J, DaCosta A, Mattia M, Manfredi JJ (2004) DNA damage-induced downregulation of Cdc25C is mediated by p53 via two independent mechanisms: one involves direct binding to the cdc25C promoter. Mol Cell 16: 725–736 [DOI] [PubMed] [Google Scholar]
- Stevaux O, Dyson NJ (2002) A revised picture of the E2F transcriptional network and RB function. Curr Opin Cell Biol 14: 684–691 [DOI] [PubMed] [Google Scholar]
- Takahashi Y, Rayman JB, Dynlacht BD (2000) Analysis of promoter binding by the E2F and pRB families in vivo: distinct E2F proteins mediate activation and repression. Genes Dev 14: 804–816 [PMC free article] [PubMed] [Google Scholar]
- Trimarchi JM, Lees JA (2002) Sibling rivalry in the E2F family. Nat Rev Mol Cell Biol 3: 11–20 [DOI] [PubMed] [Google Scholar]
- Tusher VG, Tibshirani R, Chu G (2001) Significance analysis of microarrays applied to the ionizing radiation response. Proc Natl Acad Sci USA 98: 5116–5121 [DOI] [PMC free article] [PubMed] [Google Scholar]
- Voorhoeve PM, Agami R (2003) The tumor-suppressive functions of the human INK4A locus. Cancer Cell 4: 311–319 [DOI] [PubMed] [Google Scholar]
- Weaver BA, Bonday ZQ, Putkey FR, Kops GJ, Silk AD, Cleveland DW (2003) Centromere-associated protein-E is essential for the mammalian mitotic checkpoint to prevent aneuploidy due to single chromosome loss. J Cell Biol 162: 551–563 [DOI] [PMC free article] [PubMed] [Google Scholar]
- Weaver BA, Cleveland DW (2005) Decoding the links between mitosis, cancer, and chemotherapy: the mitotic checkpoint, adaptation, and cell death. Cancer Cell 8: 7–12 [DOI] [PubMed] [Google Scholar]
- Wells J, Boyd KE, Fry CJ, Bartley SM, Farnham PJ (2000) Target gene specificity of E2F and pocket protein family members in living cells. Mol Cell Biol 20: 5797–5807 [DOI] [PMC free article] [PubMed] [Google Scholar]
- Yang D, Welm A, Bishop JM (2004) Cell division and cell survival in the absence of survivin. Proc Natl Acad Sci USA 101: 15100–15105 [DOI] [PMC free article] [PubMed] [Google Scholar]
- Yang YH, Dudoit S, Luu P, Speed TP (2001) Normalization for cDNA microarray data. In Microarrays: Optical Technologies and Informatics, ML Bittner, Y Chen, AN Dorsel, ER Dougherty (eds.), Proceedings of SPIE, Vol. 4266, pp 141–152. San Jose, CA: SPIE [Google Scholar]
- Zhu W, Giangrande PH, Nevins JR (2004) E2Fs link the control of G1/S and G2/M transcription. EMBO J 23: 4615–4626 [DOI] [PMC free article] [PubMed] [Google Scholar]
Associated Data
This section collects any data citations, data availability statements, or supplementary materials included in this article.
Supplementary Materials
Supplementary Materials and Methods
Supplementary Figure S1
Supplementary Figure S2
Supplementary Figure S3
Supplementary Figure S4
Supplementary Figure S5
Supplementary Table 1A
Supplementary Table 1B