Abstract
An electric field is focused on one cell in single-cell electroporation. This enables selective electroporation treatment of the targeted cell without affecting its neighbors. While factors that lead to membrane permeation are the same as in bulk electroporation, quantitative description of the single-cell experiments is more complicated. This is due to the fact that the potential distribution cannot be solved analytically. We present single-cell electroporation with an electrolyte-filled capillary modeled with a finite element method. Potential is calculated in the capillary, the solution surrounding the cell, and the cell. The model enables calculation of the transmembrane potential and the fraction of the cell membrane that is above the critical electroporation potential. Electroporation at several cell-to-tip distances of human lung carcinoma cells (A549) stained with ThioGlo-1 demonstrated membrane permeation at distances shorter than ∼7.0 μm. This agrees well with the model's prediction that a critical transmembrane potential of 250 mV is achieved when the capillary is ∼6.5 μm or closer to the cell. Simulations predict that at short cell-to-tip distances, the transmembrane potential increases significantly while the total area of the cell above the critical potential increases only moderately.
INTRODUCTION
Bulk electroporation is a developed field, and reviews (1–5) of its uses and future perspectives appear regularly. Numerous articles have presented models to calculate the degree of pore formation in a cell exposed to a uniform electric field. The proposed models can be simple, based on, e.g., Schwan's equation (6) or a modified version of it (7,8), or more complex and computationally demanding (9,10). While there are certainly more opportunities for detailed understanding of cell membranes interacting with strong external electric fields, it is fair to say that for most practical purposes bulk electroporation can be understood with present knowledge, although questions remain at a mechanistic level.
Pore formation in the cell membrane occurs when the transmembrane potential (TMP) is larger than some critical value TMPc. Without an external electric field, the resting membrane potential TMPr is smaller than TMPc and varies by cell type. Some calculations suggest (11–14) that the resting potential causes asymmetric cell electroporation. The analytical solution for TMP of a spherical cell in a uniform electric field is given in Eq. 1 (8),
 |
(1) |
where fs is a function that describes geometrical and electrical properties, R is the radius of a cell, E is the external electric field, and θ is the polar angle measured from the center of the cell with respect to the direction of the field. The exponential term can be ignored if the pulse length is longer than a few microseconds because the TMP induction time constant, τ, is typically <1 μs. The most often used value of fs is 3/2 corresponding to a completely insulating membrane (14). Analytical solutions can also be found for spheroidal cells (14), and for situations when the membrane conductance is not uniform across the cell (15).
Single-cell electroporation presents the capability to stimulate an individual cell or a small group of cells while neighboring cells remain unaffected. Electroporation of a single cell with a locally applied electric field should not be confused with bulk electroporation of cells cultured on substrates and looked at individually (16–18). In the latter case, the electric field is uniform or near uniform enabling the use of the analytical solutions described above. In the single-cell experiment, localized high electric fields are created by placing microelectrodes (19,20) or electrolyte-filled capillaries (21–23) (EFC) in the close vicinity of a cell. Chip-based approaches have also been realized (24–30). For most of these configurations, the electric field is not uniform around the cell, and therefore analytical solutions for calculation of TMP for single-cell electroporation are generally not possible or are too complex (14). An analytical solution of the electric field distribution at the tip of an electrolyte-filled capillary exists based on approximating the tip as an electrode with uniform current density (22). However, at best it is suitable to illustrate field inhomogeneity. Numerical calculations have been used for bulk electroporation (17,31) as well as for potential distribution in tissue (32–34). An immediate advantage of such a numerical method is its suitability for experimental (nonidealized) geometries. Several authors have presented numerical calculations for on-chip electroporation of single cells. These calculations are limited to field strength estimations (27–29) or are for illustrative purposes (35). A detailed numerical study of the field between a cell and the pore in which it sits in a microdevice shows the importance of temperature and membrane tension on the nonelectroporation field around the cell (36).
Olofsson et al. (37) performed simulations and experiments for capillaries that had inner diameters and outer diameters much greater than the cell size (e.g., mm dimensions). When positioned above cultured, adherent cells, these capillaries produce inhomogeneous electric fields that decrease from the center to the outer edge of the capillary. The experimentally observed electroporation patterns mimicked simulated electric field strength patterns.
Understanding single-cell electroporation requires a way to quantitate the degree of cell electroporation in the inhomogeneous electric fields created by small capillaries near but not in contact with single, adherent cells. In this article, we present for the first time a numerical calculation method for determining the TMP for electroporation in highly inhomogeneous electric fields that are used in single-cell electroporation of adherent cells.
MATERIALS AND METHODS
Human lung cancer cells (A549 cell line) were cultured in-house as described elsewhere (38). For experiments, cells were plated on cell culture dishes (MatTek, Ashland, MA) where they were allowed to grow 1–2 days. Before the electroporation, cells were stained with the membrane-permeable, thiol-reactive dye ThioGlo-1 (Covalent Associates, Woburn, MA). The reaction products of this dye with intracellular thiols are green-fluorescent, cell-membrane-impermeant species. After staining, cells were covered with ∼2.5 mm of cell-bathing buffer and the dish was installed on the stage of an inverted microscope (Olympus IX 71, Center Valley, PA).
Approximately 40-cm-long 100 μm ID fused silica capillaries (Polymicro Technology, Phoenix, AZ) were prepared for laser puller by burning a 2-cm center section of the protective coating in the center of the capillary and then filling it with deionized water. Capillaries were pulled with a P-2000 laser puller (Sutter Instruments, Novato, CA). The program (heat 260; filament 0; velocity 30; delay 128; pull 0) was adjusted to yield a short pulled tip length, a small opening diameter, and a consistent shape. The capillaries were cut after pulling to 15-cm total length. These capillaries were filled with a buffered, conductive, cell-bathing solution and with the aid of a micromanipulator positioned at the desired distance from a cell. Capillaries were positioned at an ∼45° angle with respect to the dish normal a few micrometers above the surface. The distant end of the capillary was placed in a vial filled with the cell-bathing buffer. The height of the vial was adjusted to avoid siphoning of the solution. A platinum electrode connected to the electroporator (ECM 830, BTX Instruments, San Diego, CA) was placed in this vial and the electrical circuit was completed with a platinum ground electrode placed in the cell dish.
Imaging of cell electroporation was performed with an ORCA-285 digital camera (Hamamatsu, Bridgewater, NJ) at binning setting of 4. A filter cube with filters for excitation at 378 nm and emission at 480 nm was used (Omega, Brattleboro, VT). Images were collected at a frequency of 1 frame/s. An electric pulse (100 ms; 500 V) was applied 25 s after the start of the acquisition. No corrections for bleaching or background were performed. Cell fluorescence was analyzed in software (Simple PCI, Compix, Sewickley, PA) by selecting the cell area as an object of fluorescence intensity higher than a certain threshold intensity. An average intensity in this area was then measured as function of time. A cell-tip distance was calculated from a measured distance between cell edge closest to the tip and a projection of the tip in the horizontal plane. The tip was always raised slightly above the dish surface. For more details on the implementation of the experiments, please refer to our related article (38).
A commercial finite element method (FEM) program Comsol 3.2a (Comsol, Burlington, MA) was used to perform calculations. For the simulation geometries, the equation  is solved with appropriate boundary conditions; here V is potential and σ is conductivity. We assumed steady-state conditions for all studied systems. In single-cell electroporation simulations, we used a realistic model of the capillary tip shape. Measuring ID and OD of the capillary tip at many distances from the tip opening, smoothing these data and then entering them in the geometry-building step of the simulation accomplished this. In total, 120 points describe the tip shape.
RESULTS AND DISCUSSION
FEM validity tests
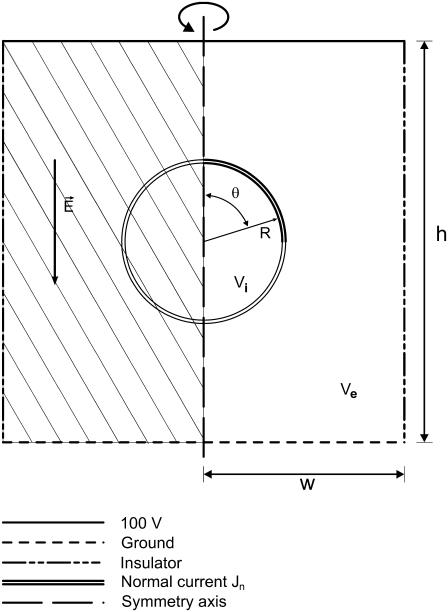
To test the soundness of our model we chose the analytical solution given by Kinosita et al. (15) for bulk electroporation and implemented it in MathCad 2001 (MathSoft, Cambridge, MA). The Comsol simulation geometry used to calculate FEM data is shown in Fig. 1. Bulk electroporation is simulated by placing a spherical cell in a uniform electric field. Such a geometry has an axial symmetry: the axis goes through the center of the cell perpendicular to the electrode surfaces. We used these symmetry properties of the system to reduce calculations from three-dimensional space to two-dimensional axial symmetry coordinates. Thus, the problem reduces to a circle (cell) placed in a square with the boundary conditions for the two opposing horizontal sides set to 100 V and ground (0 V), respectively, and the vertical sides are insulating (normal current density Jn = 0). Because of large scale differences between the cell diameter (several μm) and membrane thickness (7 nm), it is impractical to simulate the membrane itself. Its influence is therefore modeled by a discontinuous boundary between the intracellular region and the extracellular region. In practice, the inside of the cell and its surrounding medium are modeled independently. For the intracellular domain, we used  and for the solution domain we used
  . Subscripts i and e communicate that variables belong to the intracellular and the extracellular calculation domain, respectively. The cell membrane is the border between these two regions. A boundary condition is that the current density flowing across the boundary must be proportional to the potential difference across the boundary as shown in Eqs. 2 and 3:
 |
(2) |
 |
(3) |
FIGURE 1.
Model of a cell in a uniform electric field. The model was mirrored through a symmetry axis for visualization (the mirrored portion is filled with a stripe pattern). The cell and the simulation region are not drawn to scale. Solutions for the potential inside (Vi) and outside (Ve) the cell determined using the Laplace equation subject to conditions on the boundaries listed above. The transmembrane potential difference, TMP, is the difference between Vi and Ve at the boundary.
Here, σm and δ are the membrane's conductivity and thickness, respectively; superscript m denotes that potentials belong to the boundary (membrane); and Jn are current densities for the cell domain (ie) and solution domain (ei). TMP is calculated as the potential difference along the membrane:
 |
(4) |
In analytical calculations, Kinosita sets up a dimensionless membrane conductance as
 |
(5) |
We used this expression to relate the membrane's conductance in the analytical calculations to its conductivity in the FEM model. Parameter definitions and values used in the simulation are summarized in Table 1. In the simulation, the walls were sufficiently far away from the cell that their position did not affect the calculation.
TABLE 1.
Model parameters for simulation of a single-cell in a uniform electric field
| Parameter | Designation | Value | Unit | |
|---|---|---|---|---|
| Cell membrane* | σm | g0/1000 | S/m | |
| Conductance | Cytoplasm | σi | 1 | S/m |
| Call bathing solution | σe | 1 | S/m | |
| Cell radius | R | 10 | μm | |
| Membrane thickness | δ | 10 | nm | |
| Applied potential | Va | 100 | V | |
| Simulation region width | w | 0.5 | mm | |
| Simulation region height | h | 1 | mm | |
Conductivity calculated from g0 values used in the comparison to analytical solution.
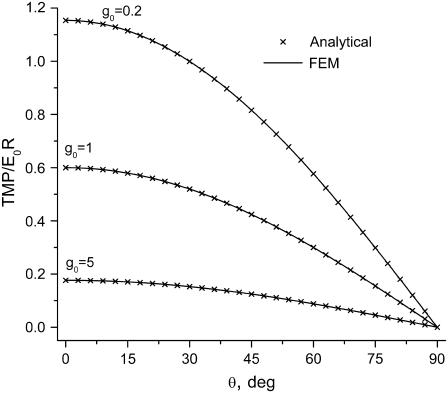
A comparison of normalized TMP values as a function of polar angle for bulk electroporation conditions at three g0 values is presented in Fig. 2. The TMP values calculated analytically and numerically are essentially identical. Using our simulation tool, we were also able to reproduce results published by Miklavcic et al. (31) for σm = f(θ). We conclude from these comparisons that our FEM models are set up correctly and the right boundary conditions have been chosen. While the simulation geometry for a single cell will be different, the boundary conditions verified here will be the same.
FIGURE 2.
Normalized TMP versus polar angle for a spherical cell in a uniform electric field at three values of membrane conductance, g0. (Solid line) Finite element numerical solution, points (X) analytical solution according to Hibino et al. (15). Conductance values equal g0/1000 (S/m) for the 10-nm thick membrane.
Single-cell electroporation calculations
Simulation geometry for single-cell electroporation
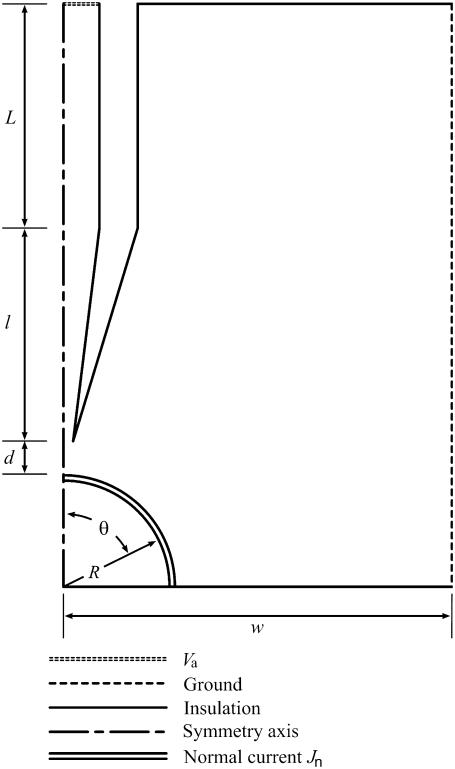
Let us first examine the experimental setup for single-cell electroporation with an EFC. Fig. 3 illustrates relative positions of the electroporated cell, the capillary, and the ground electrode. The opening of the capillary near the cell will be called the tip opening; the pulled portion of the capillary, where its diameter decreases, the tip; and the portion of the cell closest to the tip opening, the pole. The capillary is simulated perpendicular to the dish surface (Fig. 4). The side wall of the simulation region is grounded. If the cell is placed in the center of the simulation region, this simplified geometry has a symmetry axis that goes through the center of the capillary and the cell and thus enables calculations to be reduced to the axial-symmetry geometry shown in Fig. 4. While the capillary-cell geometry undoubtedly influences the outcome, there is likely to be only a small effect from this in comparison to the effect of other uncertainties such as cell size, membrane thickness, and critical transmembrane potential.
FIGURE 3.
Schematic representation of single-cell electroporation geometry. The pulled end of the capillary is close to the targeted cell and is positioned at ∼45° with respect to the dish normal. The full capillary is much longer than shown. Its distal end is placed in a vial of buffer where an electrode that delivers electrical pulse is found. The capillary is filled with the same conducting buffer (not illustrated) that surrounds the cell. The electrical circuit is completed with a ground electrode placed far away from the targeted cell.
FIGURE 4.
Guide to the single-cell electroporation modeling geometry. Boundary conditions, defined by line styles, are described in the figure. The capillary is positioned perpendicular to the dish surface and is centered above the cell. Rotational symmetry is used to simplify the simulation. The actual shape of the capillary tip is shown in Fig. 5. In simulations, the actual shape, not the idealized form shown in the figure, is used. Components are not drawn to scale.
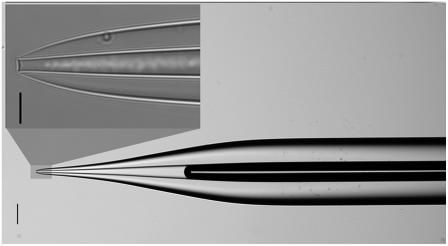
The pulled portion of the capillary is very small compared to its full length (see Fig. 5). In our experiments, the full capillary length, Ltot, is 15 cm. The length of the modeled section of the unpulled capillary (inside diameter after pulling equal to the inside diameter before pulling) is L (0.5 mm) and the pulled (inside diameter after pulling less than inside diameter before pulling) tip ℓ (2.0 mm). The full length of the unpulled section of the capillary is Lup (14.8 cm). Only 0.5 mm of the unpulled capillary was included in the simulation. Thus, L + ℓ = 2.5 mm, which is approximately the thickness of the solution covering the cells. Therefore, the experimental and simulated heights of the cell bathing solution are approximately equal.
FIGURE 5.
Optical microscope images of a typical pulled capillary tip. 100 μm (wide view) and 10 μm (zoomed region) scale bars are included.
An adherent, hemispherical cell (R = 10 μm) was positioned directly below the tip opening at a distance d. From confocal fluorescence measurements (39), we know that the cell shape is close to hemispherical and therefore this shape was chosen in simulations. This simulated cell size is close to observed experimental values and also agrees with many theoretical electroporation studies in the literature (8,40). Conductivities of all simulation domains were chosen based on published data (41). All boundary conditions are displayed in Fig. 4 and other model parameters are summarized in Table 2.
TABLE 2.
Model parameters for simulation of single-cell electroporation
| Parameter | Designation | Value | Unit |
|---|---|---|---|
| Conductance | |||
| Cell membrane | σm | 5.3 × 10⁻⁶ | S/m |
| Cytoplasm | σi | 0.13 | S/m |
| Cell bathing solution | σe | 0.6 | S/m |
| Other parameters | |||
| Cell radius | R | 10 | μm |
| Membrane thickness | Δ | 7 | nm |
| Applied potential (model) | Va | 94.07 | V |
| Applied potential (extrapolated) | Vtot | 500 | V |
| Critical transmembrane potential | TMPc | 0.25 | V |
Calculations of potential drop in the capillary
In Fig. 6, we present a calculation of the potential along the center of the capillary resulting from applying 500 V (Vtot) at the distal end of the 15 cm capillary. The cell was omitted from this calculation and the capillary was placed 20 μm away from the cell dish surface. Va is the voltage in the capillary lumen a distance L + l from the tip. This corresponds to the “top” of the simulation region shown in Fig. 4. Setting the following boundary condition (Eq. 6) in Comsol avoids the unnecessary calculation of the linear potential drop in the unpulled section of the capillary:
 |
(6) |
FIGURE 6.
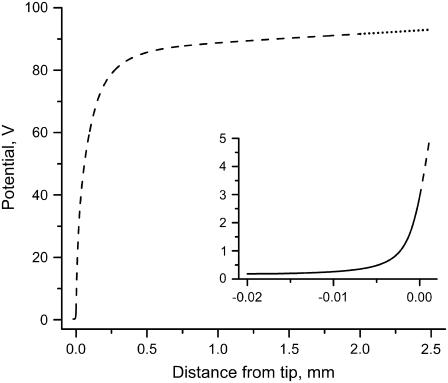
Potential in the center of the capillary versus distance from the tip opening: unpulled portion of the simulated capillary (dotted line), the pulled tip region (dashed line), and the outside of the capillary (solid line). Va is the value of the potential at a distance of 2.5 mm.
Here,  is the electric field normal to the boundary where Va exists, Vtot is the voltage applied experimentally across Ltot, and the lengths were defined above. For accurate calculations, “weak boundary condition” in the model needs to be enabled. In the general case, the value of Va can change as conditions in the calculation change. In our particular case, however, because the resistance in the solution outside the capillary is so small in comparison to the total resistance, the value of Va is insensitive to the tip-cell distance (smallest value checked is 0.25 μm) and insensitive to the presence of the cell.
Three regions in the potential-distance curve (Fig. 6) can be distinguished. A linear potential change with distance (dotted line) is observed in the unpulled portion of the capillary. The linear region gradually transitions into an increasingly steeper potential gradient region as the curve approaches the tip opening (dashed line). The potential change with distance outside the capillary (solid line, inset of Fig. 6) is still very large in the immediate vicinity of the capillary tip but becomes very small just a few tip ID distances away. For our experimental configuration, the potential is only a few volts at the capillary tip opening. Merely 10 μm away from the tip opening, the potential is to just a few hundred millivolts and the potential gradient is so small at this point that it is unlikely to cause electroporation of a cell. Electroporation with an EFC can achieve very high spatial resolution because the electric field changes dramatically just one tip distance away from the tip opening (22).
From Fig. 5 it is apparent that the capillary ID is much smaller in the tip than the original unpulled ID. Electrical conductivity is proportional to the cross-sectional area of the lumen and therefore a large potential drop is expected here even though the total length of the tip is small. This is well illustrated in Fig. 6: for a 15-cm-long capillary, ∼20% of the total potential drop occurs in the 0.2 cm capillary tip. The total resistance strongly depends on capillary length. Fifteen centimeters is an adequate length for relatively easy manipulation and positioning of the ground electrode vial to avoid siphoning while being sufficiently short to attain the critical electric field necessary for electroporation at Vtot = 500 V, the maximum potential obtainable with our instrument when using long pulse times. The potential decay characteristics for these particular experimental conditions are listed in Table 3 and can be used to find other suitable Ltot/Vtot combinations for similarly pulled 100-μm ID capillaries. For electrolyte solutions, the potential distribution in the capillary is independent of the solution's conductivity—a σe increase would only cause the current flowing through the capillary to increase. While the conductivity of electrolyte solutions increases with temperature, the calculations assume that Joule heating is negligible.
TABLE 3.
Various values characterizing potential drop in the capillary
| Parameter | Designation | Value | Unit |
|---|---|---|---|
| Total applied potential | Vtot | 500 | V |
| Simulated applied potential | Va | 94.07 | V |
| Field in capillary (unpulled part) | b | 27.52 | V/cm |
| Total capillary length | Ltot | 15.0 | cm |
| Length of unpulled capillary | Lup | 14.8 | cm |
| Length of simulated unpulled capillary | L | 0.05 | cm |
| Length of pulled tip | l | 0.2 | cm |
Cell electroporation
In bulk electroporation, several factors determine the extent of cell permeabilization (42), as measured by dye or toxin uptake. For electroporation to occur, a critical transmembrane potential (TMP), TMPc, must be exceeded. In bulk electroporation, the applied field and cell size determine whether TMPc is exceeded. In single-cell electroporation with an EFC, the local electric field depends not only on the applied potential (as in bulk electroporation) but also on the capillary-cell distance d. This is because the potential distribution around the cell changes with d. Thus, we determined how both distance, d and applied potential affect the fractional electroporated area (FEA) of a cell. Electroporation calculations were performed with the model shown in Fig. 4. The FEA was calculated as the fraction of the membrane surface area where the absolute value of TMP is greater than TMPc.
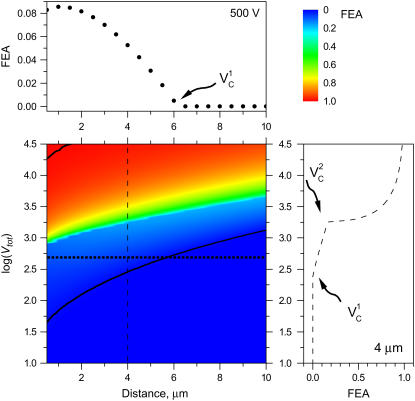
It is important to note that FEA is not the fractional cell area that exists as pores. It is effectively the area in which pores might be found. The bottom portion of the cell should not be electroporated if a cell has adhered well to the culture dish and therefore an insulator boundary condition was set here. This area was not included in FEA calculations. An electroporation threshold of TMPc = 250 mV was chosen from previous studies (3,7,43). The simulated variation of FEA with the distance d and applied potential is presented in Fig. 7. Data are presented as a contour plot of FEA in d − log(Vtot) coordinates with two cross-sections shown in the upper and right panels. At all distances, no electroporation is observed at the lowest applied potential (Vtot < 40 V) as is indicated by the dark blue color of this region in the figure. At small distances when very high potentials are applied, nearly 100% of the cell area should become permeable and these regions are colored red. A sharp shift from blue to green color is apparent corresponding to a sharp increase from modest to large FEA transition. Another transition, much less obvious in the contour plot, occurs when an unaffected cell becomes modestly electroporated. To illustrate this transition we marked the contour of 1% FEA with a solid line. The contour of 99% FEA is marked with a solid line as well.
FIGURE 7.
Fraction electroporated area of the cell membrane as function of distance and applied potential (in volts). Contours that correspond to 1% and 99% FEA are shown with black solid lines. The upper panel shows a slice of the contour plot at Vtot = 500 (marked with the horizontal dotted line on the contour). The right panel illustrates how FEA varies with log(Vtot) at d = 4 μm (marked with the vertical dashed line in the contour plot). Critical electroporation potentials that correspond to the beginning of the electroporation ( ) and the electroporation of the cell side walls (
 ) are marked. The electroporation threshold potential
  increases with increasing cell-to-tip distance. The increase is the most pronounced at short and becomes more gradual at large distances.
A closer look of FEA at a 4 μm distance is shown in the side panel of Fig. 7. The electroporation onset is observed when log(Vtot) reaches 2.4. This is followed by a gradual increase until log(Vtot) becomes 3.25. Let us call these critical values of Vtot  and
and  , respectively. As Vtot is further raised above
  , the FEA increases very rapidly and finally levels off while approaching 100%. A similar pattern is observed at other distances except that critical values of Vtot shift to higher values with increasing distance.
It is of particular interest to examine electroporation at Vtot = 500 V as function of distance, because this potential was used in our experiments discussed later. This cross-section is marked with a dotted line in the contour plot. FEA values for these conditions are shown in the upper panel of Fig. 7. FEA is <1% at distances, d, >∼6 μm away from the cell (intersection of lower black curve and horizontal dotted line in Fig. 7). As the capillary is brought even closer in simulations, FEA gradually increases until it reaches a maximum value of ∼8%. At the shortest distance of 0.5 μm a very slight decrease is observed. Unlike in electroporation at a constant distance and varied potential, at these conditions only  is observed. At a higher Vtot (e.g., log(V) = 3.2) the FEA change with distance resembles the FEA change with log(V) and two critical values of Vtot can be distinguished in the curve (not shown).
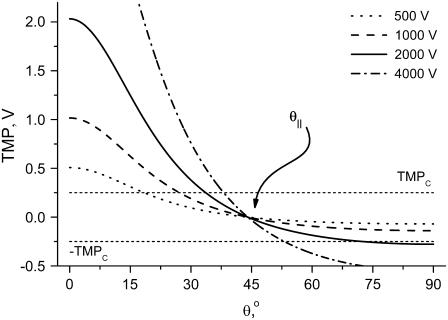
To understand the origin of the two critical values of Vtot let us examine the TMP dependence on the polar angle θ under various conditions. Fig. 8 presents TMP at four Vtot values when the capillary is 4 μm away from the cell. All curves intersect at a point where the electric field is parallel to the membrane surface (TMP = 0 V; θ = θ‖). At polar angles smaller than θ‖, TMP is positive and at values larger than θ‖, it is negative. At small Vtot values, the TMP does not exceed the TMPc and no electroporation is expected. For our experimental conditions of Vtot = 500 V, a portion of the cell surface closest to the capillary opening is above TMPc. At higher Vtot values, this portion of the membrane increases. When a certain potential is reached (near Vtot = 2000 V), the TMP becomes more negative than the (–)TMPc at angles θ > θ‖. Under these conditions, the sides of the cell are electroporated in addition to the pole. It can be shown that the area corresponding to a range of polar angles is significantly larger at the equator than at the pole, thus a very dramatic FEA increase can be observed when Vtot exceeds  . In contrast, a relatively small cell area is permeated if only
  is exceeded because only the pole of the cell is electroporated. In cell suspension electroporation experiments, θ‖ = 90° and therefore only the poles of the cell are thought to be permeated. Due to these considerations only
  can be observed in bulk electroporation data. When
  , FEA increases in a continuous manner.
FIGURE 8.
TMP versus polar angle, θ, for cell-tip distance d = 4 μm and a range of Vtot. Dashed parallel lines mark threshold electroporation conditions |TMPc| = 250 mV. Angle θ‖, where the electric field is parallel to the membrane surface, is marked.
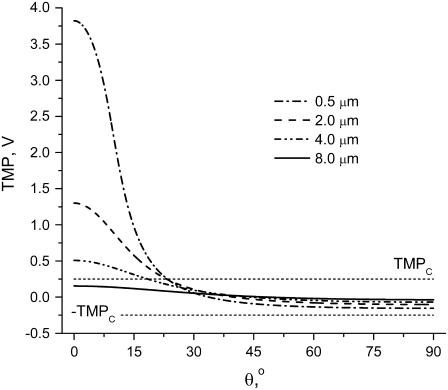
For Vtot = 500 V, TMP variations with polar angle at four capillary distances are presented in Fig. 9. The capillary has to be closer than some critical distance for TMP to exceed TMPc. At close distances, a very large TMP is formed near the pole. Yet, even at the closest distance of 0.5 μm, TMP only exceeds the critical value for polar angles <∼20°, and only on the pole. This is consistent with the previous observation that only  is observed under these conditions. While decreasing cell-capillary distance does not have exactly the same effect as increasing Vtot, both of these parameters control electric field strength around the cell and therefore it is not surprising that, at some conditions, FEA versus distance curves look similar to FEA versus log(V) changes.
FIGURE 9.
TMP versus polar angle θ at various cell-tip distances. Applied potential Vtot = 500 V. Dashed parallel lines mark threshold electroporation conditions |TMPc| = 250 mV.
Comparison to experimental results
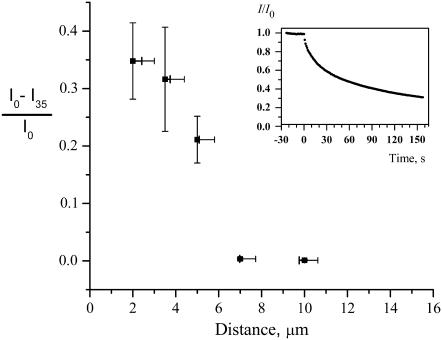
We electroporated cells that were stained with ThioGlo-1 (the predominant product is the glutathione adduct, MW = 685) at various cell-capillary tip distances. Vtot was 500 V in all experiments, and a single unipolar pulse of 100 ms duration was applied. At each distance, several cells (∼10) with R = 10 ± 1 μm were subjected to the pulse of potential. While we cannot determine directly the FEA, we can easily determine the average fluorescence intensity loss 35 s after pulsing. We take this measurement to be related to the FEA. The results are presented in Fig. 10. At 10 μm distance, the pulse caused no noticeable effect on cells. Only some fluorescence intensity loss due to bleaching can be observed. At 7.0 μm distance most of the cells were unaffected while some exhibited mild electroporation. For 5.0 μm and smaller distances, significant electroporation could be observed. Membrane permeation is clearly dependent on cell-capillary distance. There appears to be a “critical” capillary-cell distance of 5–7 μm. At longer distances, membrane permeability is low or improbable after exposure to a single, 100 ms pulse of 500 V through a 15-cm-long, 100 μm-inside diameter capillary pulled to a ∼4 μm tip. The computational results in Fig. 7 suggest a critical distance of 5.5–6.5 μm under the same conditions. Given that there are no adjustable parameters in the computational model, the agreement between the two “critical” distances is good.
FIGURE 10.
Fraction of the fluorescence lost 35 s after the electroporation pulse versus cell-tip distance. Inset shows a typical fluorescence intensity change with time after electroporation (d = 3.5 μm, Vtot = 500 V). Error bars for the intensity represent standard error of the mean. The values on the distance axis corresponding to each point represent the length between cell and the capillary as seen in microscope images. The range along the distance axis corresponds to the best estimate of the range of true values of the distance. Because the capillary tip opening (3.6 μm) is of comparable size to the cell (10 μm radius), the distance measurement is somewhat subjective. When the capillary is at 45° with respect to the dish surface normal and beside the cell 5 μm above the surface of the dish (as in Fig. 3), there is actually a range of distances between the lumen and the cell membrane. The bar to the left is the shortest distance between the cell and the capillary. The bar to the right is the shortest distance between the cell and the center of the capillary opening.
Two parameters that are difficult to determine have a great influence on the result, thus their uncertainties must be discussed. One is the tip-cell distance. We included an estimated uncertainty in tip-cell distance measurements in Fig. 10. We believe that the best estimate of tip-cell distance is represented by the closest distance between the tip and the membrane. This corresponds to the minimum (left) of the ranges shown in Fig. 10. Note that these values are close to the experimentally observed values. It is also worth noting that even a precise and accurate measurement of distance to a hemispherical cell would suffer from uncertainties related to variations in cell shape. The other parameter is the value of TMPc. A smaller TMPc would make cell permeation easier when cell-tip distances are large. Experimental evidence points to longer pulses significantly reducing TMPc (44,45). There are numerous reports that longer pulses or repeated short pulses lead to greater permeabilization. Yet, we have found no quantitative model for this. Karassowska et al. (9) theoretically modeled the creation and evolution of pores. This study covered long pulse lengths but did not model pore size changes during the experiment. A later model (46) included pore size changes too, but was limited to short pulse lengths. In our experiments electric pulses are long compared to most bulk electroporation reports. It may therefore be that TMPc is smaller under our conditions than is generally seen in bulk electroporation with short (sub-millisecond) pulses.
There is a potential opportunity in single-cell electroporation for future unraveling of mechanistic issues such as those just discussed. We noticed that while the FEA is approximately the same for 0.5-μm and 2-μm distances, at 0.5 μm the TMP is significantly higher at the cell pole. Thus, in the single-cell experiment, FEA and TMP are independent variables under some conditions. Increasing TMP in bulk electroporation is possible only by increasing the electric field, which also increases FEA. Thus, in bulk electroporation, FEA and TMP are correlated variables, complicating the evaluation of the change in membrane permeability. Single-cell experiments thus have a potential to give new insights into the fundamental process of electroporation.
CONCLUSIONS
These TMP calculations for single-cell electroporation with an EFC apply the principles governing bulk electroporation and extend them to conditions for which analytical solutions are impossible or are not practical. For bulk electroporation, our numerical calculations completely agree with the analytical solution so there is no disadvantage to this approach. One can argue that with the analytical equations it is more apparent how various conditions affect the monitored property, be it FEA or some other parameter of interest. However, analytical solutions are simple and short equations only for a spherical cell with a uniform membrane conductance. When σm = f(θ), these solutions are no simpler than finite element simulations. The finite element approach is not limited to the simulation of the electroporation by an EFC. It can be used for chip-based geometries and electroporation with a microelectrode. The calculations of a TMP or a FEA for these methods would be a big step forward from calculation of electric field alone. Even more exciting is the finite element method's capability of expansion to calculate heat buildup from joule heating or diffusion through permeated portions of the cell membrane. The conductivity of the membrane itself can be a function of the TMP, consequently making the simulation even more realistic. Thus, the calculations presented here are informative in their own right, and act as a foundation for future, more realistic and complex calculations.
It is noteworthy that single-cell electroporation, because of its characteristic nonuniform electric field distribution, offers possibilities to design experiments that are impossible in bulk electroporation. In particular, in the single-cell experiment we predict that, under some conditions, the maximum TMP and FEA can be varied independently. This allows, for example, for testing the hypothesis that the value of the maximum TMP influences the membrane permeability.
The calculations presented here demonstrate that the electric field at a cell, and thus, TMP, can be controlled by controlling tip-cell distance. We have also found reasonable agreement with experiment, supporting a value for TMPc near 0.25 V. Two different critical values of Vtot have been found. Creating conditions so that TMP > TMPc at the pole results in permeabilization of the pole over a small fraction of the surface area. At higher Vtot or smaller d, the TMP at the sides or equatorial region of the cell result in a large fractional area electroporated.
Acknowledgments
This work was financially supported by the National Institutes of Health (grant No. GM R01 66018).
References
- 1.Weaver, J. C., and Y. A. Chizmadzhev. 1996. Theory of electroporation: a review. Bioelectrochem. Bioenerg. 41:135–160. [Google Scholar]
- 2.Teissie, J., M. Golzio, and M. P. Rols. 2005. Mechanisms of cell membrane electropermeabilization: a minireview of our present (lack of?) knowledge. Biochim. Biophys. Acta. 1724:270–280. [DOI] [PubMed] [Google Scholar]
- 3.Teissie, J., N. Eynard, M. C. Vernhes, A. Benichou, V. Ganeva, B. Galutzov, and P. A. Cabanes. 2002. Recent biotechnological developments of electropulsation. A prospective review. Bioelectrochemistry. 55:107–112. [DOI] [PubMed] [Google Scholar]
- 4.Gehl, J. 2003. Electroporation: theory and methods, perspectives for drug delivery, gene therapy and research. Acta Physiol. Scand. 177:437–447. [DOI] [PubMed] [Google Scholar]
- 5.Neumann, E., S. Kakorin, and K. Toensing. 1999. Fundamentals of electroporative delivery of drugs and genes. Bioelectrochem. Bioenerg. 48:3–16. [DOI] [PubMed] [Google Scholar]
- 6.Grosse, C., and H. P. Schwan. 1992. Cellular membrane potentials induced by alternating fields. Biophys. J. 63:1632–1642. [DOI] [PMC free article] [PubMed] [Google Scholar]
- 7.Puc, M., T. Kotnik, L. M. Mir, and D. Miklavcic. 2003. Quantitative model of small molecules uptake after in vitro cell electropermeabilization. Bioelectrochemistry. 60:1–10. [DOI] [PubMed] [Google Scholar]
- 8.Kotnik, T., F. Bobanovic, and D. Miklavcic. 1997. Sensitivity of transmembrane voltage induced by applied electric fields—a theoretical analysis. Bioelectrochem. Bioenerg. 43:285–291. [Google Scholar]
- 9.Smith, K. C., J. C. Neu, and W. Krassowska. 2004. Model of creation and evolution of stable electropores for DNA delivery. Biophys. J. 86:2813–2826. [DOI] [PMC free article] [PubMed] [Google Scholar]
- 10.Joshi, R. P., Q. Hu, R. Aly, K. H. Schoenbach, and H. P. Hjalmarson. 2001. Self-consistent simulations of electroporation dynamics in biological cells subjected to ultrashort electrical pulses. Phys. Rev. E. Stat. Nonlin. Soft Matter Phys. 64:011913-1–011913-10. [DOI] [PubMed] [Google Scholar]
- 11.Tekle, E., R. D. Astumian, and P. B. Chock. 1990. Electro-permeabilization of cell membranes: effect of the resting membrane potential. Biochem. Biophys. Res. Commun. 172:282–287. [DOI] [PubMed] [Google Scholar]
- 12.Hibino, M., H. Itoh, and K. Kinosita, Jr. 1993. Time courses of cell electroporation as revealed by submicrosecond imaging of transmembrane potential. Biophys. J. 64:1789–1800. [DOI] [PMC free article] [PubMed] [Google Scholar]
- 13.Gabriel, B., and J. Teissie. 1997. Direct observation in the millisecond time range of fluorescent molecule asymmetrical interaction with the electropermeabilized cell membrane. Biophys. J. 73:2630–2637. [DOI] [PMC free article] [PubMed] [Google Scholar]
- 14.Kotnik, T., and D. Miklavcic. 2000. Analytical description of transmembrane voltage induced by electric fields on spheroidal cells. Biophys. J. 79:670–679. [DOI] [PMC free article] [PubMed] [Google Scholar]
- 15.Hibino, M., M. Shigemori, H. Itoh, K. Nagayama, and K. Kinosita, Jr. 1991. Membrane conductance of an electroporated cell analyzed by submicrosecond imaging of transmembrane potential. Biophys. J. 59:209–220. [DOI] [PMC free article] [PubMed] [Google Scholar]
- 16.Sixou, S., and J. Teissie. 1993. Exogenous uptake and release of molecules by electroloaded cells: a digitized videomicroscopy study. Bioelectrochem. Bioenerg. 31:237–257. [Google Scholar]
- 17.Valic, B., M. Golzio, M. Pavlin, A. Schatz, C. Faurie, B. Gabriel, J. Teissie, M.-P. Rols, and D. Miklavcic. 2003. Effect of electric field induced transmembrane potential on spheroidal cells: theory and experiment. Eur. Biophys. J. 32:519–528. [DOI] [PubMed] [Google Scholar]
- 18.Prausnitz, M. R., J. D. Corbett, J. A. Gimm, D. E. Golan, R. Langer, and J. C. Weaver. 1995. Millisecond measurement of transport during and after an electroporation pulse. Biophys. J. 68:1864–1870. [DOI] [PMC free article] [PubMed] [Google Scholar]
- 19.Lundqvist, J. A., F. Sahlin, M. A. I. Aberg, A. Stromberg, P. S. Eriksson, and O. Orwar. 1998. Altering the biochemical state of individual cultured cells and organelles with ultramicroelectrodes. Proc. Natl. Acad. Sci. USA. 95:10356–10360. [DOI] [PMC free article] [PubMed] [Google Scholar]
- 20.Ryttsen, F., C. Farre, C. Brennan, S. G. Weber, K. Nolkrantz, K. Jardemark, D. T. Chiu, and O. Orwar. 2000. Characterization of single-cell electroporation by using patch-clamp and fluorescence microscopy. Biophys. J. 79:1993–2001. [DOI] [PMC free article] [PubMed] [Google Scholar]
- 21.Haas, K., W.-C. Sin, A. Javaherian, Z. Li, and H. T. Cline. 2001. Single-cell electroporation for gene transfer in vivo. Neuron. 29:583–591. [DOI] [PubMed] [Google Scholar]
- 22.Nolkrantz, K., C. Farre, A. Brederlau, R. I. D. Karlsson, C. Brennan, P. S. Eriksson, S. G. Weber, M. Sandberg, and O. Orwar. 2001. Electroporation of single cells and tissues with an electrolyte-filled capillary. Anal. Chem. 73:4469–4477. [DOI] [PubMed] [Google Scholar]
- 23.Rae, J. L., and R. A. Levis. 2002. Single-cell electroporation. Pfluegers Archiv. 443:664–670. [DOI] [PubMed] [Google Scholar]
- 24.Fox, M. B., D. C. Esveld, A. Valero, R. Luttge, H. C. Mastwijk, P. V. Bartels, A. van den Berg, and R. M. Boom. 2006. Electroporation of cells in microfluidic devices: a review. Anal. Bioanal. Chem. 385:474–485. [DOI] [PubMed] [Google Scholar]
- 25.Seo, J., C. Ionescu-Zanetti, J. Diamond, R. Lal, and L. P. Lee. 2004. Integrated multiple patch-clamp array chip via lateral cell trapping junctions. Appl. Phys. Lett. 84:1973–1975. [Google Scholar]
- 26.Huang, Y., N. S. Sekhon, J. Borninski, N. Chen, and B. Rubinsky. 2003. Instantaneous, quantitative single-cell viability assessment by electrical evaluation of cell membrane integrity with microfabricated devices. Sensors Actuators A Physical A. 105:31–39. [Google Scholar]
- 27.Lin, Y.-C., M. Li, and C.-C. Wu. 2004. Simulation and experimental demonstration of the electric field assisted electroporation microchip for in vitro gene delivery enhancement. Lab Chip. 4:104–108. [DOI] [PubMed] [Google Scholar]
- 28.Fox, M., E. Esveld, R. Luttge, and R. Boom. 2005. A new pulsed electric field microreactor: comparison between the laboratory and microtechnology scale. Lab Chip. 5:943–948. [DOI] [PubMed] [Google Scholar]
- 29.Lu, H., M. A. Schmidt, and K. F. Jensen. 2005. A microfluidic electroporation device for cell lysis. Lab Chip. 5:23–29. [DOI] [PubMed] [Google Scholar]
- 30.Shin, Y. S., K. Cho, J. K. Kim, S. H. Lim, C. H. Park, K. B. Lee, Y. Park, C. Chung, D.-C. Han, and J. K. Chang. 2004. Electrotransfection of mammalian cells using microchannel-type electroporation chip. Anal. Chem. 76:7045–7052. [DOI] [PubMed] [Google Scholar]
- 31.Pavlin, M., and D. Miklavcic. 2003. Effective conductivity of a suspension of permeabilized cells: a theoretical analysis. Biophys. J. 85:719–729. [DOI] [PMC free article] [PubMed] [Google Scholar]
- 32.Miklavcic, D., D. Semrov, H. Mekid, and L. M. Mir. 2000. A validated model of in vivo electric field distribution in tissues for electrochemotherapy and for DNA electrotransfer for gene therapy. Biochim. Biophys. Acta. 1523:73–83. [DOI] [PubMed] [Google Scholar]
- 33.Gowrishankar, T. R., and J. C. Weaver. 2003. An approach to electrical modeling of single and multiple cells. Proc. Natl. Acad. Sci. USA. 100:3203–3208. [DOI] [PMC free article] [PubMed] [Google Scholar]
- 34.Sel, D., S. Mazeres, J. Teissie, and D. Miklavcic. 2003. Finite-element modeling of needle electrodes in tissue from the perspective of frequent model computation. IEEE Trans. Biomed. Eng. 50:1221–1232. [DOI] [PubMed] [Google Scholar]
- 35.Khine, M., A. Lau, C. Ionescu-Zanetti, J. Seo, and L. P. Lee. 2005. A single cell electroporation chip. Lab Chip. 5:38–43. [DOI] [PubMed] [Google Scholar]
- 36.Díaz-Rivera, R. E., and B. Rubinsky. 2006. Electrical and thermal characterization of nanochannels between a cell and a silicon based micro-pore. Biomed. Microdev. 8:25–34. [DOI] [PubMed] [Google Scholar]
- 37.Olofsson, J., M. Levin, A. Stroemberg, S. G. Weber, F. Ryttsen, and O. Orwar. 2005. Generation of focused electric field patterns at dielectric surfaces. Anal. Chem. 77:4667–4672. [DOI] [PMC free article] [PubMed] [Google Scholar]
- 38.Agarwal, A., I. Zudans, O. Orwar, and S. G. Weber. 2007. Simultaneous maximization of cell permeabilization and viability in single-cell electroporation using an electrolyte-filled capillary. Anal. Chem. 79:161–167. [DOI] [PMC free article] [PubMed] [Google Scholar]
- 39.Soederdahl, T., M. Enoksson, M. Lundberg, A. Holmgren, O. P. Ottersen, S. Orrenius, G. Bolcsfoldi, and I. A. Cotgreave. 2003. Visualization of the compartmentalization of glutathione and protein-glutathione mixed disulfides in cultured cells. FASEB J. 17:124–126. [DOI] [PubMed] [Google Scholar]
- 40.Kotnik, T., D. Miklavcic, and T. Slivnik. 1998. Time course of transmembrane voltage induced by time-varying electric fields—a method for theoretical analysis and its application. Bioelectrochem. Bioenerg. 45:3–16. [Google Scholar]
- 41.Hu Q., S. Viswanadham, R. P. Joshi, K. H. Schoenbach, S. J. Beebe, and P. F. Blackmore. 2005. Simulations of transient membrane behavior in cells subjected to a high-intensity ultrashort electric pulse. Phys. Rev. E. Stat. Nonlin. Soft Matter Phys. 71:031914-1–031914-9. [DOI] [PubMed] [Google Scholar]
- 42.Rols, M.-P., and J. Teissie. 1998. Electropermeabilization of mammalian cells to macromolecules: control by pulse duration. Biophys. J. 75:1415–1423. [DOI] [PMC free article] [PubMed] [Google Scholar]
- 43.Teissie, J., and M. P. Rols. 1993. An experimental evaluation of the critical potential difference inducing cell membrane electropermeabilization. Biophys. J. 65:409–413. [DOI] [PMC free article] [PubMed] [Google Scholar]
- 44.Glaser, R. W. 1986. Appearance of a “critical voltage” in reversible electric breakdown. Studia Biophysica. 116:77–86. [Google Scholar]
- 45.Tovar, O., and L. Tung. 1991. Electroporation of cardiac cell membranes with monophasic or biphasic rectangular pulses. Pacing Clin. Electrophysiol. 14:1887–1892. [DOI] [PubMed] [Google Scholar]
- 46.Bilska, A. O., K. A. DeBruin, and W. Krassowska. 2000. Theoretical modeling of the effects of shock duration, frequency, and strength on the degree of electroporation. Bioelectrochemistry. 51:133–143. [DOI] [PubMed] [Google Scholar]


