

Abstract
Both folded and unfolded conformations should be observed for a protein at its melting temperature, or Tm, where the ΔG between these states is zero. In an all-atom molecular dynamics simulation of chymotrypsin inhibitor 2 (CI2) at its experimental Tm, the protein rapidly loses its low-temperature native structure, it then unfolds before refolding to a stable, native-like conformation. The initial unfolding follows the unfolding pathway described previously for higher temperature simulations: the hydrophobic core is disrupted, the β-sheet pulls apart and the α-helix unravels. The unfolded state reached under these conditions maintains a kernel of structure in the form of a nonnative hydrophobic cluster. Refolding simply reverses this path, the side chain interactions shift, the helix refolds, and the native packing and hydrogen bonds are recovered. The end result of this refolding is not the initial crystal structure; it contains the proper topology and the majority of the native contacts, but the structure is expanded and the contacts are long. We believe this state to be the native one at elevated temperature and the change in volume and contact lengths is consistent with experimental studies of other native proteins at elevated temperature and the chemical denaturant equivalent of Tm.
The unfolding pathway of chymotrypsin inhibitor 2 (CI2) has been extensively characterized by molecular dynamics (MD) simulations at a range of temperatures. The unfolding was first characterized by simulation at 498 K.1,2 These simulations were compared extensively with experimental data.3-6 The good agreement with experiment achieved by these simulations indicated that the unfolding process in simulations at high temperature is similar to the experimentally observed folding and unfolding processes at lower temperatures. More recent simulations as a function of temperature for CI2 and several other proteins demonstrate that the overall unfolding pathway is essentially independent of temperature7-15 and that the unfolding pathway observed in a small number of simulations is similar to the average unfolding pathway calculated from 100 independent simulations.16 But, lowering the temperature does have a minor effect on the unfolding pathway: partially unfolded conformations take a longer time to completely expose their hydrophobic cores to solvent. During this time, elements of secondary structure can slide relative to one another in a movement that is rare at extremely high temperatures.7,16
Our force field and simulation protocols yield temperature-dependent, or temperature-activated, conformational behavior consistent with the experiment melting temperature (Tm) for a variety of proteins, including CI2,7 the WW domain,14 α3D,15 the engrailed homeodomain,9, 10 and, most recently and most systematically, Trp cage.17 In contrast, replica exchange molecular dynamics simulations and the use of other force fields lead to overestimates of Tm by ∼65-125 K.18-20 So, given that we do obtain unfolding within the proper temperature regimes, we now explore the detailed interactions within CI2 in simulations at its Tm.
It seems reasonable to assume that microscopic reversibility holds for protein folding and unfolding, such that the conformational changes observed in unfolding are reversed in the refolding process. We use the extended IUPAC definition of microscopic reversibility,21 which is a structural definition:
“The principle was widely applied to the analyses of reaction mechanisms, in particular of substitution reactions. In the case of SN2 reactions at tetrahedral centers implying a formation of the trigonal bipyramid transition state (or intermediate structure), the original formulation of the principle was extended in the following way: if a molecule or reactant enters a trigonal bipyramid at an apical position, this (or another) molecule or reactant must likewise leave the trigonal bipyramid from an apical position.”
This definition has been in use for decades in the fields of physical organic chemistry22, 23 and enzymology.24 By considering the principle of microscopic reversibility structurally, we may apply it to the protein folding-unfolding reaction. Conformations, or ensembles of conformations such as the transition state and any intermediate states, that have relatively low free energies will be populated in both the folding and unfolding directions. Thus, we consider folding to be microscopically reversible in the sense that the conformations that are observed in the unfolding process will also be observed in the refolding process. This structural view is the natural way to evaluate an MD trajectory. With atomistic MD simulations of a solvated system the statistics are too poor to use the definition of microscopic reversibility based on detailed balance, which requires that the transitions between any two states take place with equal frequency in both directions at equilibrium. Furthermore, we desire an in-depth view of the process, of the transitions per se and therefore favor a structural approach.
The qualitative and quantitative agreement between our unfolding simulations and experiments probing refolding intermediates and the folding transition state25-27 supports this position. But, the principle of microscopic reversibility requires that the conditions are the same for the forward and reverse processes, which is clearly not the case when comparing high temperature unfolding with low-temperature refolding. We aim to test this issue more directly by simulation of a protein at its Tm, where the ΔG between the native and denatured states is zero. In this way we can track the unfolding and refolding of a single-protein molecule under identical conditions in a single continuous trajectory.
The approach is distinct from annealing: the temperature is not raised and lowered. Limited refolding has been observed with such annealing approaches with all-atom models and explicit solvent by simulating higher-temperature unfolded structures under folding conditions. The first such simulations were performed on ubiquitin.28, 29 Structures were taken from various points along a 498 K trajectory and simulated at 335 K. Structures taken from early in the unfolding trajectory collapsed and became more native-like. Structures taken later in time along the unfolding pathway tended to undergo multiple cycles of unfolding and hydrophobic collapse, with successive collapse events gaining more native-like structure. 335 K quench simulations of CI2 have also been performed.30 These simulations were intended to probe the location of the transition state (TS) of folding/unfolding (a Pfold-like analysis). Simulations that were started from structures before the TS became more native-like while those beginning with structures after the TS became did not. In all of these cases, however, refolding was limited to a short portion of the reaction coordinate. A very long continuous folding simulation was performed on the villin headpiece in which the protein refolded from a disrupted high-temperature (1000 K) structure to a stable folding intermediate at 298 K.31 While significant, but incomplete, folding was observed in this simulation, folding events were not compared to unfolding events, unfolding and refolding were monitored under different conditions, and the structural properties of the intermediate were not experimentally validated. More recently, a replica-exchange method has been used to simultaneously study protein folding and unfolding.18 This method allows sampling of the entire folding/unfolding reaction coordinate at a range of temperatures. While this method may be useful for determining thermodynamic properties of folding/unfolding, it is a fundamentally discontinuous method in that no single replica folds and unfolds at a single temperature and should not be used to compare microscopic events in unfolding and refolding. So, while these various studies have implicitly assumed that the principle of microscopic reversibility is valid, no one of them has been able to directly monitor the forward and reverse processes under the same conditions.
Here we present a single-molecule simulation of CI2 at 348 K in which the protein unfolds to a highly distorted structure and then refolds to a long-lived native-like conformation. This temperature is just below the experimental Tm of the protein (approximately 353 K)32 such that both the native and denatured states should be populated at equilibrium. This simulation allows for direct comparison of the unfolding and refolding processes under identical conditions. As the unfolding and refolding processes take place under the same conditions, true differences between the unfolding and refolding pathways can be separated from temperature or other environmental effects.
Results
The crystalline conformation of CI233 (N) is not stable in simulation at 348 K. Instead it deforms rapidly, reaching an expanded, native-like conformation (N’) before unfolding to a structure that is nearly 9 Å Cα-root-mean-square-deviation (RMSD) from the starting crystal structure. The protein then refolds to the N’ conformation (blue curve, Figure 1). This final N’ ensemble is relatively stable for the remainder of the simulation, although there are some large excursions over time (for example see the peak at 170 ns, red curve, Figure 1). The average Cα-RMSD between structures over the last 150 ns of the simulation is 2.6 ± 0.5 Å (see large black and blue cluster in Figure 2A). This conformational ensemble satisfies 89% of the short range (5 or fewer residue sequence separation) nuclear Overhauser effect (NOE) restraints from NMR experiments at 310 K.34 Only 47% of the long range NOEs are satisfied. Nevertheless, the conformations over the last 150 ns of simulation are topologically the same as the crystal structure and they have native, though loosened, packing (Figures 3). The average Voronoi volume of these structures is 8670 Å3, whereas the average volume in a 298 K simulation is 8360 Å3, corresponding to a volume increase of 4%. If the NOE-related cutoff is increased from 5.5 to 8.5 Å, 96% of the short-range and 71% of the long-range NOEs are satisfied, illustrating the expansion but retention of the topology. Unfortunately, experimental NOEs for CI2 at, or near, its Tm have not been determined.
Figure 1.
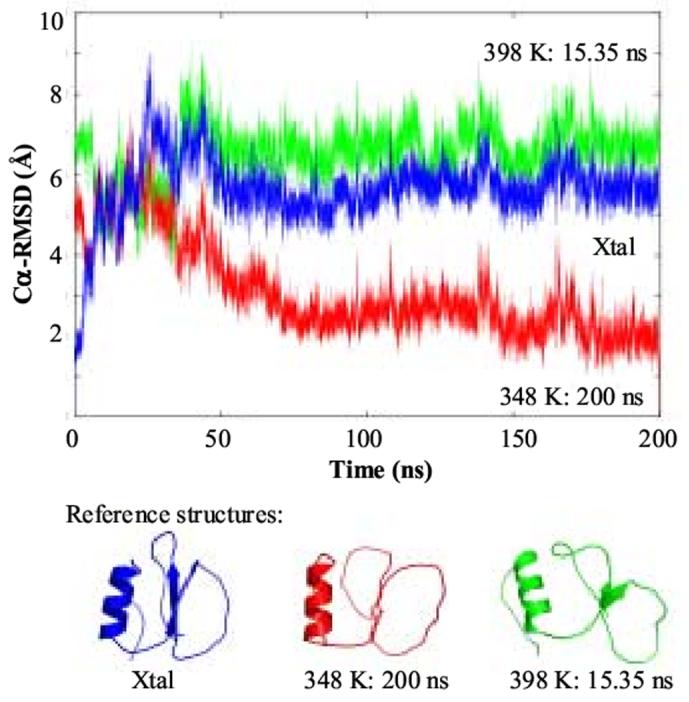
Cα-RMSD of the MD structures during the 348 K simulation relative to different reference states. The reference structures used: crystal structure33 (blue), the 200 ns 348 K N’ structure (red), and a partially unfolded 398 K MD structure (green). The reference structures are given below the plot.
Figure 2.
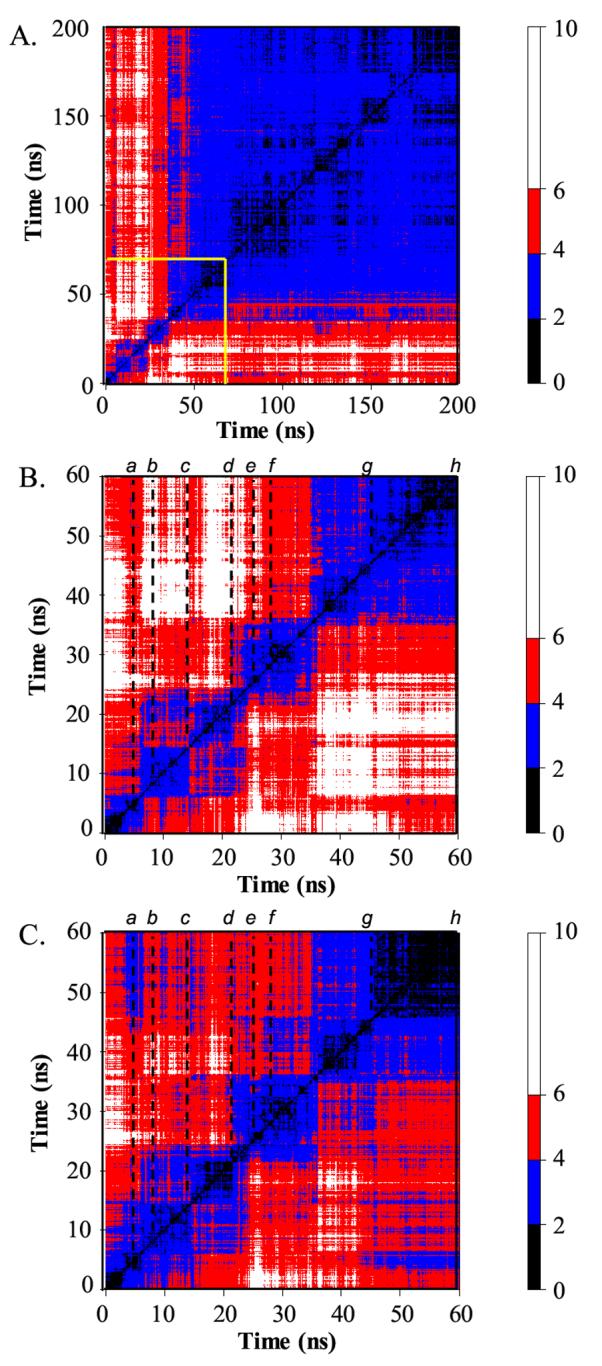
All vs. all Cα-RMSD matrices between structures along the 348 K trajectory. (A) Cα-RMSD matrix for the full 200 ns. Structures are compared every 100 ps. (B) Cα-RMSD matrix for the first 60 ns, blocked out in yellow in panel A. Structures are compared every 20 ps. The dotted lines indicate the times of representative structures given in Figure 4. (C) As B, but residues in the N- and C-termini (residues 1-12 and 53-64) are not included in the Cα-RMSD calculation. The color of a point gives the Cα-RMSD between the two time points given on the X and Y axes according to the scale on the right. Regions of black to blue along the diagonal indicate clusters of highly similar structures. Actual conformational states were determined using 3-dimensional projections with higher granularity of time points.
Figure 3.
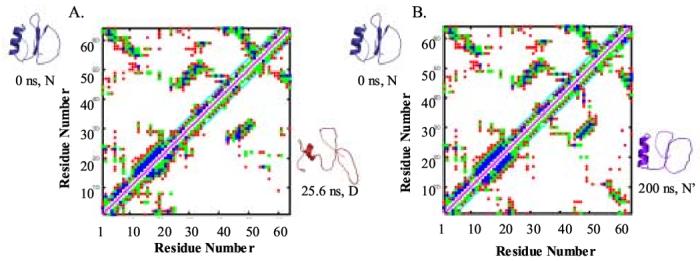
Contact maps of the starting, maximally unfolded, and final structures. (A) Contacts in the starting (crystal) structure are plotted above the diagonal, and contacts in the maximally unfolded (25.6 ns) structure are plotted below the diagonal. (B) Contacts in the crystal structure and in the final structure (below diagonal). Ribbon diagrams of the respective structures are provided next to the appropriate contact map. A contact between two residues is defined by the shortest distance between heavy atoms: blue ≤ 3.5 Å separation; green ≤ 5.5 Å; and red ≤ 7.5 Å.
Many native or near-native interactions are present in the final, refolded 200 ns structure, but the distances tend to be longer (Figure 3). Interactions that define the native α-helix and those between strands 1 and 2 of the sheet are present in the refolded structure, as are contacts between the N and C-termini. The active site loop has formed native-like contacts with strand 2 and the C-terminus of the protein. Long range interactions across the protein core are present, although the distances between these residues are longer. Additionally, Trp 5 is buried, which is notable as it is the fluorescence probe used in experimental studies to distinguish the native and denatured states. In other words, when the fluorescence of this residue changes upon exposure to solvent, the protein is, by definition, denatured (or unfolded). In any case, in the simulations the protein passes through conformations in which Trp 5 is buried, then becomes exposed to solvent, and then is re-buried in the hydrophobic core. In the maximally distorted structure, seen at 25.6 ns, the termini are not in contact, and the active site loop is no longer packed against the sheet. Additionally, the α-helix is unfolded and the remaining hydrophobic interactions are nonnative. For these reasons, and the other structural issues raised above, we denote the early and late structures during the simulation the native state at 348 K, or N’.
Unfolding/refolding pathway
The unfolding from N/N’ and refolding to N’ proceeds through a series of minimally stable conformations before settling into the final, stable state. Representative structures from the process of N → N’ → TS → D → TS → N’ are show in Figure 4. The unfolding is similar to the early stages of the unfolding pathway at high temperature described previously.7 There is initially some movement in the termini and loops, as well as a loss of well-defined β-sheet structure. The core becomes partially solvated as the N and C-termini separate. The N-terminal end of the α-helix separates from the β-sheet and the helix unfolds. The C-terminal turn of the α-helix is generally preserved (i.e. it fluctuates but it is persistent) in the denatured state in the 348 K simulation, as is also the case in the denatured state as probed by both experiment and high-temperature MD.5 In addition, many hydrophobic contacts between the C-terminus of the helix and residues within strands 1 and 2 from the β-sheet are present, although they are nonnative (Figures 5 and 6). By 25.6 ns, this kernel of nonnative structure is essentially all that remains of the hydrophobic core and the Cα-RMSD to the crystal structure is 8.9 Å. The N- and C-termini are separated from one another and the core of the protein and the active site loop have become highly deformed. Furthermore, Trp 5 is exposed to solvent (Figure 5).
Figure 4.
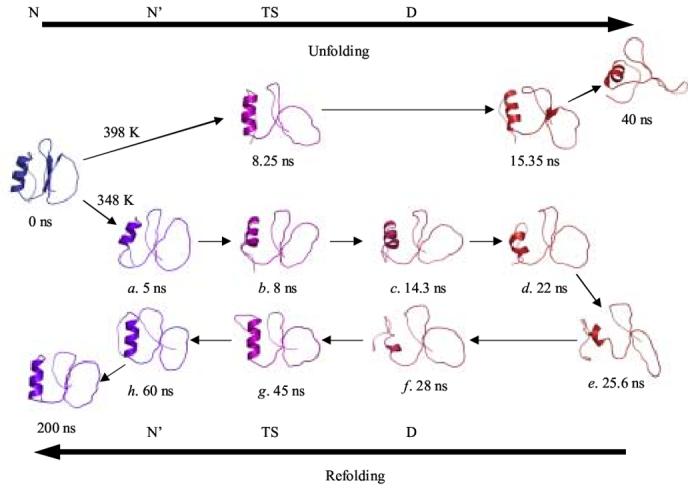
Representative structures from the simulation. Structures are colored from blue to red according to their relative degree of native structure. The lowercase letters correspond to those used in Figure 2. Structures from a 398 K simulation7 are given as an unfolding reference. Structures that are in the same column are similar by Cα-RMSD and position along the reaction coordinate.
Figure 5.
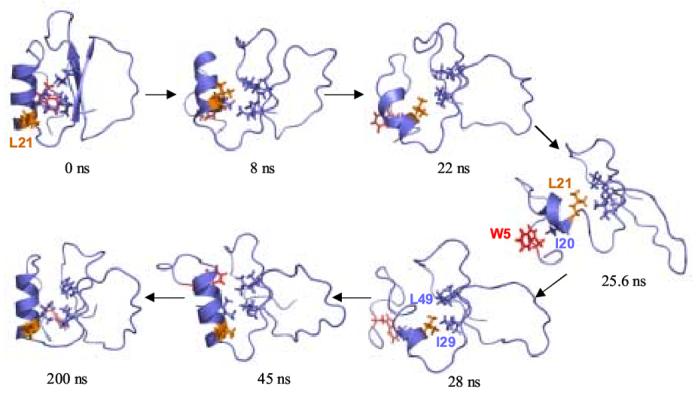
Hydrophobic core interactions in the unfolding and refolding pathways. The side chains of residues Trp 5, Ile 20, Leu 21, Ile 29, Val 31, Val 47, and Leu 49 are shown. Trp 5 is colored red and Leu 21 is orange. As the protein unfolds, the α-helix twists and Leu 21 is buried in the core of the protein and the α-helix unfolds. In the most distorted structure, at 25.6 ns, the protein is held together by a nonnative cluster consisting of Leu 21, Ile 29, Ile 30, and Leu 49. The α-helix twists back as it refolds, and Ile 20 reforms its native contacts in the core.
Figure 6.
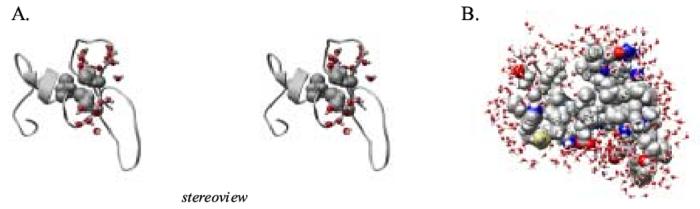
Core interactions in the denatured state at 348 K. (A) Stereoview of waters around the nonnative core interactions in the 25.6 ns structure. Side chain atoms of residues Leu 21, Ile 29, and Leu 49 are rendered as spheres and all solvent molecules within 5 Å are displayed. (B) Space-filling view of the structure with solvating waters.
The unfolding pathway (approximately 8 - 36 ns) is very similar to the previously described unfolding trajectory at 398 K (7) (Figure 4). The structures during this time period of the 348 K simulation have Cα-RMSDs from 3.6 - 6 Å to the unfolded structures in the 398 K simulation (see green curve in Figure 1 and structures in Figure 4). The unfolded structures in the 348 K simulation are more similar to the unfolded structures at 398 K than they are to either N or N’ (compare the 3 curves in Figure 1).
Unlike the behavior at 398 K, rather than continuing to unfold to achieve complete solvation of the core, the protein begins to refold at 348 K from the nonnative nucleus of structure formed between the C-terminus of the α-helix and the N-termini of strands 1 and 2 (Figures 4, 5 and 6). In the crystal structure, Leu 21 is on the surface of the α-helix and Ile 20 is packed against Ile 29, Val 31, Val 47, and Leu 49 on strands 1 and 2 in the core of the protein. As the protein unfolds and Trp 5 is exposed to solvent, the helix twists and unravels, bringing Leu 21 into the core. Leu 21 makes contact with Ile 29, Ile 30, and Leu 49, forming a nucleus for refolding (Figure 6). Refolding begins when contacts between strands 1 and 2 recover their native register, bringing Leu 21 into contact with Val 47 (Figure 5). The active site loop then assumes a more native-like conformation. The α-helix reforms and twists back to its native conformation, bringing Ile 20 back into contact with Ile 29, Val 31, Val 47, and Leu 49 on strands 1 and 2. Some contacts between the N and C-termini are reformed, but they do not recover their tight packing with the helix and strands 1 and 2. Nonetheless, Trp 5 is buried in this process. The active site loop remains fairly distorted and does not adopt the precise conformation of the crystal structure. Experimentally, the active site loop and the N-terminal tail comprise the most dynamic portions of the native protein.35, 36 As would be expected, the refolding to N’ yields large deviations from the 398 K denatured state (Figure 1).
The Cα-RMSD between conformational clusters partially reflects these changes, though the changes are masked by the mobility in the termini and active site loop (Figure 2). The time point (structure) e at 25.6 ns represents the maximally distorted protein conformation observed at 348 K (Figures 2 and 4). Conformations in this cluster, represented by structure f at 28 ns, are within 6Å Cα-RMSD of structures in the clusters preceding e, such as c and d (Figure 2). If the N- and C-termini are excluded from the calculation, the Cα-RMSD drops below 4 Å for many pairs of structures. In the cluster from about 35 to 45 ns, represented by structure g, the protein is refolding, leading to an increase in the Cα-RMSD between these structures and those in the unfolding portion of the simulation (c and d, Figures 2 and 4). Furthermore, the TS ensemble (represented by structure b) traversed during unfolding is very similar to that of refolding (represented by structure g) (Figures 2C and 4). Between 45 and 50 ns (h), the N’ state is recovered, as evidenced by the low RMSDs between the structures before the unfolding transitions state and after the folding transition state (i.e. see the off-diagonal blue region linking the 3-5 ns and the 45-60 ns time periods in Figure 2C and structures in Figure 4).
The drastic overall changes that the protein undergoes can be seen clearly in Figure 7. The structures are all aligned at the α-helix with residues 16 and 20 pointing towards the right in every case. From the crystal structure to the 5 ns snapshot the protein expands some, but the four highlighted residues remain in contact. In contrast, the C-terminal part of the protein unravels and moves around to the other side of the helix in the 25.6 ns structure. In the 200 ns snapshot the refolding is evident, the C-terminal half of the protein has moved back to the other face of the helix and the correct topology is recovered along with the packing of the hydrophobic residues in the core. The change in the shape and surface of the protein throughout this process is displayed in the bottom panel of Figure 7.
Figure 7.
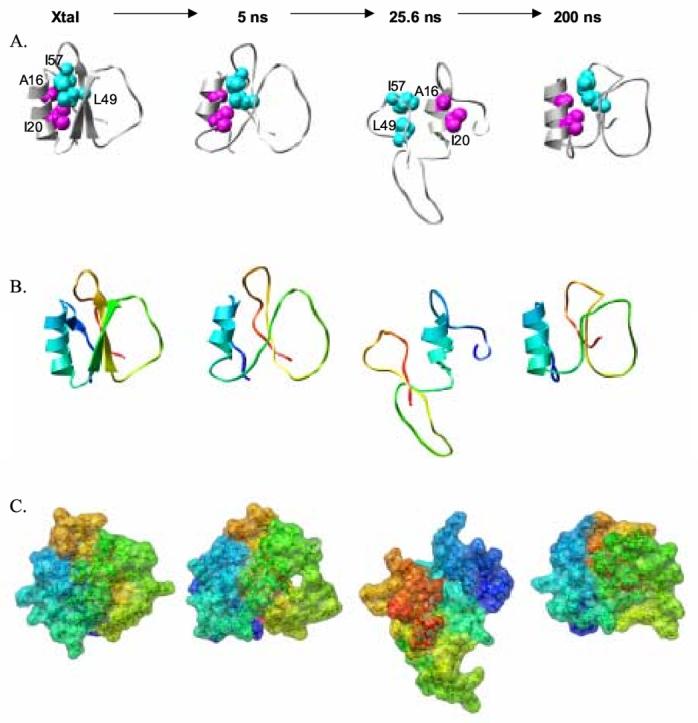
Changes in structure, packing, topology, shape and surface properties as CI2 unfolds and refolds. (A) The crystal structure and MD snapshots are aligned at the α-helix and the same orientation is shown for each image with Ala 16 and Ile 20 of the helix pointing toward the right. (B) The same structures are displayed as in panel (A) but the protein is colored from the N- to the C-terminus from blue to red. (C) The same structures are shown in the same orientation as in the previous panels. The rainbow coloring scheme from panel B is shown but in space filling mode.
Discussion
At temperatures greater than 448 K, the unfolding of CI2 is essentially a unidirectional process. The native structure expands rapidly, allowing the core to become completely solvated and leading to a statistical coil-like denatured state.1, 5, 7 At lower temperatures, 373 K and 398 K, unfolding is less direct. Core contacts are lost in a more piecemeal fashion, allowing for sliding of the helix along the sheet before complete unfolding is achieved.7 These smaller-scale movements require less solvent rearrangement, and are thus more favorable at lower temperatures and higher solvent densities. The volume of the cavity required to separate one of the terminal strands from the core is much smaller than that required to expose the entire cavity to solvent. In the simulation described here at the Tm of CI2, unfolding proceeds until only a small nonnative hydrophobic cluster remains, then the protein refolds to a stable native-like state, which we denote N’.
The initial unfolding process in this 348 K simulation is similar to the unfolding observed at higher temperatures7. At the beginning of the 348 K simulation there is movement in the termini and loops, as well as a loss of well-defined β-sheet structure. The core becomes partially solvated as the N and C-termini separate. The N-terminal end of the α-helix moves away from the β-sheet and the helix unfolds aside from its C-terminal turn. The C-terminal turn of the α-helix is also preserved in the denatured state as probed by previous MD simulations and NMR experiments.5 The remaining hydrophobic contacts between this segment of the helix (Leu 21, which was originally on the surface of the helix pointing away from the core in the native state) and strand residues (particularly Ile 29, Ile 30, and Leu 49) are nonnative, and this hydrophobic cluster is essentially all that remains of the protein’s hydrophobic core (Figures 4, 5 and 6). Furthermore, Trp 5, the fluorescence probe of folding and unfolding, is exposed to solvent. Consistent with our findings, the residues involved in the nonnative cluster have chemical shift deviations distinct from random coil values indicative of residual structure in the chemically denatured state5 as well as in fragments used to model the denatured state in water.37
Whereas at high temperatures the unfolding continues from this point with the complete solvation of the hydrophobic core, in this simulation the protein does not completely unfold. Instead, it refolds in a process that mirrors the initial unfolding. Refolding begins when contacts between strands 1 and 2 recover their native register, bringing Leu 21 into contact with Val 47. The active site loop also assumes a more native-like conformation. The α-helix refolds and twists back to its native conformation. Leu 21 returns to its position on the surface of the protein, and Ile 20 comes back into contact with Ile 29, Val 31, Val 47, and Leu 49 on strands 1 and 2. Trp 5 is re-buried in the process (Figure 5). Thus, structure coalesces around a nucleus of hydrophobic residues in the reverse of the order that it is lost. Furthermore, the protein passes through the same transition-state ensemble in both the unfolding and folding processes. That is, the unfolding pathway is, structurally, microscopically reversible to give the refolding pathway.
The order of structure loss in unfolding observed here is also similar to the order of structure loss observed in multiple simulations at 498 K (100 independent runs), where we observe a statistically favored mean unfolding pathway in an ensemble of similar possible pathways.16 Similarly, the unfolding and refolding pathways observed in this simulation are likely to represent only one of a variety of pathways. It is, of course, impossible to show from this single simulation that refolding is always the exact mirror of unfolding, but the partial unfolding and refolding observed here do present a model for what microscopic reversibility could look like in proteins. Namely, that the order of structure formation from a given nucleus of structure in refolding will be similar to the order of structure loss in unfolding to that nucleus of structure. A complete description of the refolding process would necessarily include all possible paths to all possible nuclei, but the statistically favored pathway observed at 498 K suggests that a smaller set of pathways will allow a reasonable description of the folding and unfolding process.
The refolding is not a complete mirror of the unfolding principally in that the crystal structure determined at low temperature33 is not recovered, nor would we expect it to be. There are still significant differences between N’ and the crystal structure in the active site loop and N and C-termini. Core packing is not as tight in the final N’ ensemble, but the residues in the native hydrophobic core are buried and interacting, and, importantly, Trp 5 is buried. The N’ ensemble is very long-lived in the simulation.
In crystallographic studies of the structural and dynamic behavior of ribonuclease A and metmyoglobin, Petsko and co-workers found that increasing temperature leads to a linear increase in the protein volume.38, 39 The crystal structure of myoglobin increases in volume by about 3 % over a 120 K temperature range, and that of ribonuclease-A by 0.4 % per 100 K. The volume of our simulated N’ state is 4% greater than the native state at 298 K. This volume increase is probably reasonable given the difference in the environments: the protein volume probed experimentally is constrained in the crystalline state. Regardless, the change in volume affects the packing interactions; with longer interaction distances observed in higher temperature crystal structures of ribonuclease A.39 Experimentally there is a shift in the native state to looser packing and longer intermolecular interactions with increasing temperature, consistent with our findings. In addition, a distinct high temperature folded state has been proposed as an explanation for the unfolding behavior of CspA in laser T-jump experiments.40 Similarly, Rhoades et al.41 also observed a shift from the tightly packed native structure to a more loosely packed native state, N’, for folding events at the GndHCl equivalent of Tm in single-molecule folding experiments. Thus, it is our contention that our refolded conformer (N’) represents the native state at 348 K.
In previous temperature-quenched simulations of CI2 near its unfolding transition state,30 the extent of core solvation was observed to be the major determinant of whether or not a conformation quickly refolded. In pre-transition state conformations, waters were not well bound in the protein core and could be easily expelled to allow rapid refolding. In later structures, waters remained in the core, deterring refolding. In the simulation presented here, the protein becomes highly distorted, achieving nearly complete core solvation. Although specific native core interactions are lost, nonnative interactions between hydrophobic residues prevent solvent from totally penetrating between residues comprising the α-helix and strands 1 and 2 in the native state, and thus prevents complete unfolding. This nonnative cluster facilitates rapid refolding precipitated by a simple rearrangement of hydrophobic residues, allowing us to observe partial unfolding and refolding events despite the fact that the timescale of complete unfolding and refolding is much longer than the simulation time. But, we note that this is a rare process and we were fortunate to see it. More recently we have been investigating this phenomenon using an ultrafast folding and unfolding protein, the engrailed homeodomain. So far, in two separate simulations of this protein at its Tm (unpublished results) we have observed reversible unfolding and refolding by the same structural pathway, which supports our position that MD simulations can display microscopic reversibility.
Conclusions
In a single, all-atom simulation of CI2 at 348 K, the protein unfolds and refolds to a stable, native-like structure. The protein unfolds through a highly distorted state but unfolding is incomplete, with a small kernel of nonnative hydrophobic contacts remaining in the maximally distorted structure. Folding from this nucleus of nonnative structure is the reverse of unfolding: the nonnative contacts shift back to their native positions, the helix refolds, and the hydrophobic core is recovered. The same transition state ensemble is traversed during both unfolding and refolding. Thus, the order in which structure is reformed mirrors the order in which it was lost under identical conditions, thereby satisfying the principle of microscopic reversibility.
Methods
MD was performed using the program ENCAD.42 The potential energy function and the protocols for molecular dynamics are described elsewhere.43-45 The initial structure used in all simulations was the crystal structure solved at 1.7 Å resolution (1YPC).33 The simulation was carried out at neutral pH (Asp and Glu negatively charged, His uncharged, Lys and Arg positively charged).
The protocols for the MD simulation were as follows. The starting structure was minimized for 1000 steps. After minimization, water molecules (1 g/ml) were added to solvate the protein in a rectangular box extending at least 8 Å in all directions resulting in 2596 waters. The water density was set to the experimental value for 348 K, 0.975 g/ml, by adjusting the volume of the box.46 The solvent water was then subjected to conjugate gradient minimization of 1000 cycles followed by 1000 steps of molecular dynamics. The water was then minimized again for 1000 cycles. Finally, the protein was minimized for 1000 steps, followed by 1000 steps of minimization of the entire protein-water system. After these preparatory steps, the system was heated to 348 K by initially assigning low atomic velocities from a Maxwellian distribution. Atoms were allowed to move according to Newton’s equations of motion and the velocities of the atoms were adjusted intermittently until the system reached the desired temperature. At this point the microcanonical ensemble was used (NVE). An 8 Å force-shifted nonbonded interaction cut-off was used42 and the nonbonded list was updated every five cycles. The simulation was performed for 200 ns using a 2 fs integration time step, yielding 106 structures for analysis.
For comparison with the experimental nuclear Overhauser effect crosspeaks (NOE)34, r-6 weighted distances between the appropriate hydrogen pairs were averaged over the specified time period. Figures were rendered using PyMOL.47
Acknowledgements
We are grateful for financial support from the National Institutes of Health (R01 GM 50789).
Footnotes
Publisher's Disclaimer: This is a PDF file of an unedited manuscript that has been accepted for publication. As a service to our customers we are providing this early version of the manuscript. The manuscript will undergo copyediting, typesetting, and review of the resulting proof before it is published in its final citable form. Please note that during the production process errors may be discovered which could affect the content, and all legal disclaimers that apply to the journal pertain.
References
- 1.Li A, Daggett V. Characterization of the Transition State of Protein Unfolding Using Molecular Dynamics: Chymotrypsin Inhibitor 2. Proc. Natl. Acad. Sci. USA. 1994;91:10430–10434. doi: 10.1073/pnas.91.22.10430. [DOI] [PMC free article] [PubMed] [Google Scholar]
- 2.Li A, Daggett V. Identification and Characterization of the Unfolding Transition State of Chymotrypsin Inhibitor 2 by Molecular Dynamics Simulations. J. Mol. Biol. 1996;257:412–429. doi: 10.1006/jmbi.1996.0172. [DOI] [PubMed] [Google Scholar]
- 3.Daggett V, Li A, Itzhaki LS, Otzen DE, Fersht AR. Structure of the Transition State for Folding of a Protein Derived from Experiment and Simulation. J. Mol. Biol. 1996;257:430–440. doi: 10.1006/jmbi.1996.0173. [DOI] [PubMed] [Google Scholar]
- 4.Ladurner AG, Itzhaki LS, Daggett V, Fersht AR. Synergy Between Simulation and Experiment in Describing the Energy Landscape of Protein Folding. Proc. Natl. Acad. Sci. USA. 1998;95:8473–8478. doi: 10.1073/pnas.95.15.8473. [DOI] [PMC free article] [PubMed] [Google Scholar]
- 5.Kazmirski SL, Wong K-B, Freund SMV, Tan Y-J, Fersht AR, Daggett V. Protein Folding from a Highly Disordered Denatured State: The Folding Pathway of Chymotrypsin Inhibitor 2 at Atomic Resolution. Proc. Natl. Acad. Sci. USA. 2001;98:4349–4354. doi: 10.1073/pnas.071054398. [DOI] [PMC free article] [PubMed] [Google Scholar]
- 6.Pan YP, Daggett V. Direct comparison of experimental and calculated folding free energies for hydrophobic deletion mutants of chymotrypsin inhibitor 2: Free energy perturbation calculations using transition and denatured states from molecular dynamics simulations of unfolding. Biochemistry. 2001;40:2723–2731. doi: 10.1021/bi0022036. [DOI] [PubMed] [Google Scholar]
- 7.Day R, Bennion BJ, Ham S, Daggett V. Increasing Temperature Accelerates Protein Unfolding without Changing the Pathway of Unfolding. J. Mol. Biol. 2002;322:189–203. doi: 10.1016/s0022-2836(02)00672-1. [DOI] [PubMed] [Google Scholar]
- 8.Day R, Daggett V. Sensitivity of the folding/unfolding transition state ensemble of chymotrypsin inhibitor 2 to changes in temperature and solvent. Prot. Sci. 2005;14:1242–1252. doi: 10.1110/ps.041226005. [DOI] [PMC free article] [PubMed] [Google Scholar]
- 9.Mayor U, Johnson CM, Daggett V, Fersht AR. Protein Folding and Unfolding in Microseconds to Nanoseconds by Experiment and Simulation. Proc. Natl. Acad. Sci. USA. 2000;97:13518–13522. doi: 10.1073/pnas.250473497. [DOI] [PMC free article] [PubMed] [Google Scholar]
- 10.Mayor U, Johnson CM, Grossmann JG, Sato S, Jas GS, Freund SMV, Guydosh NR, Alonso DOV, Daggett V, Fersht AR. The Complete Folding Pathway of a Protein from Nanoseconds to Microseconds. Nature. 2003;421:863–867. doi: 10.1038/nature01428. [DOI] [PubMed] [Google Scholar]
- 11.Gianni S, Guydosh NR, Khan F, Caldas TD, Mayor U, White GWN, DeMarco ML, Daggett V, Fersht AR. Unifying features in protein-folding mechanisms. Proc. Natl. Acad. Sci. USA. 2003;100:13286–13291. doi: 10.1073/pnas.1835776100. [DOI] [PMC free article] [PubMed] [Google Scholar]
- 12.White GWN, Gianni S, Grossman JG, Jemth P, Fersht AR, Daggett V. Simulation and Experiment Conspire to reveal Cryptic Intermediates and the Slide from the Nucleation-Condensation to Framework Mechanism of Folding. J. Mol. Biol. 2005;350:757–775. doi: 10.1016/j.jmb.2005.05.005. [DOI] [PubMed] [Google Scholar]
- 13.Ferguson N, Day R, Johnson CM, Allen MD, Daggett V, Fersht AR. Simulation and experiment at high temperatures: Ultrafast folding of a thermophilic protein by nucleation-condensation. J. Mol. Biol. 2005;347:855–870. doi: 10.1016/j.jmb.2004.12.061. [DOI] [PubMed] [Google Scholar]
- 14.Ferguson N, Pires JR, Toepert F, Johnson CJ, Pan YP, Volkmer-Engert R, Schneider-Mergener J, Daggett V, Oschkinat H, Fersht AR. Using Flexible Loop Mimetics to Extend Φ-value Analysis to Secondary Structure Interactions. Proc. Natl. Acad. Sci. USA. 2001;98:13008–13013. doi: 10.1073/pnas.221467398. [DOI] [PMC free article] [PubMed] [Google Scholar]
- 15.Zhu Y, Alonso DOV, Maki K, Huang C-Y, Lahr SJ, Daggett V, Roder H, DeGrado WF, Gai F. Ultrafast Folding of α3D, A De Novo Designed Three-Helix Bundle Protein. Proc. Natl. Acad. Sci. USA. 2003;100:15486–15491. doi: 10.1073/pnas.2136623100. [DOI] [PMC free article] [PubMed] [Google Scholar]
- 16.Day R, Daggett V. Ensemble versus single-molecule protein unfolding. Proc. Natl. Acad. Sci. USA. 2005;102:13445–13450. doi: 10.1073/pnas.0501773102. [DOI] [PMC free article] [PubMed] [Google Scholar]
- 17.Beck DAC, White GWN, Daggett V. Exploring the Energy Landscape of Protein Folding using Replica-Exchange and Conventional Molecular Dynamics Simulations. J. Struct. Biol. 2006 doi: 10.1016/j.jsb.2006.10.002. in press and available on-line. [DOI] [PMC free article] [PubMed] [Google Scholar]
- 18.Garcia AE, Onuchic JN. Folding a protein in a computer: An atomic description of the folding/unfolding of protein A. Proc. Natl. Acad. Sci. U. S. A. 2003;100:13898–13903. doi: 10.1073/pnas.2335541100. [DOI] [PMC free article] [PubMed] [Google Scholar]
- 19.Pitera JW, Swope W. Understanding folding and design: Replica-exchange simulations of “Trp-cage” fly miniproteins. Proc. Natl. Acad. Sci. U. S. A. 2003;100:7587–7592. doi: 10.1073/pnas.1330954100. [DOI] [PMC free article] [PubMed] [Google Scholar]
- 20.Zhou RH. Trp-cage: Folding free energy landscape in explicit water. Proc. Natl. Acad. Sci. U. S. A. 2003;100:13280–13285. doi: 10.1073/pnas.2233312100. [DOI] [PMC free article] [PubMed] [Google Scholar]
- 21.Commission on Physical Organic Chemistry (V. I. Minkin) Pure Appl. Chem. 1999;71:1919–1981. [Google Scholar]
- 22.Westheimer FH. Pseudo-rotation in the hydrolysis of phosphate esters. Acc. Chem. Res. 1968;1:70–78. [Google Scholar]
- 23.Lahti DW, Espenson JH. Issues of microscopic reversibility and an isomeric intermediate in ligand substitution reactions of five-coordinate oxorhenium(V) dithiolate complexes. J. Am. Chem.Soc. 2001;123:6014–6024. doi: 10.1021/ja004145h. [DOI] [PubMed] [Google Scholar]
- 24.Fersht AR. Structure and Mechanism in Protein Science. W.H. Freeman and Company; New York: 1999. [Google Scholar]
- 25.Fersht AR, Daggett V. Protein Folding and Unfolding at Atomic Resolution. Cell. 2002;108:573–582. doi: 10.1016/s0092-8674(02)00620-7. [DOI] [PubMed] [Google Scholar]
- 26.Daggett V, Fersht AR. Is There a Unifying Mechanism for Protein Folding? Trends in Biochem. Sci. 2003;28:18–25. doi: 10.1016/s0968-0004(02)00012-9. [DOI] [PubMed] [Google Scholar]
- 27.Daggett V, Fersht AR. The present view of the mechanism of protein folding. Nat. Rev. Mol. Cell. Biol. 2003;4:497–502. doi: 10.1038/nrm1126. [DOI] [PubMed] [Google Scholar]
- 28.Alonso DOV, Daggett V. Molecular Dynamics Simulations of Protein Unfolding and Limited Refolding: Characterization of Partially Unfolded States of Ubiquitin in Methanol and in Pure Water. J. Mol. Biol. 1995;247:501–520. doi: 10.1006/jmbi.1994.0156. [DOI] [PubMed] [Google Scholar]
- 29.Alonso DOV, Daggett V. Molecular Dynamics Simulations of Hydrophobic Collapse of Ubiquitin. Prot. Sci. 1998;7:860–874. doi: 10.1002/pro.5560070404. [DOI] [PMC free article] [PubMed] [Google Scholar]
- 30.De Jong D, Riley R, Alonso DOV, Daggett V. Probing the Energy Landscape of Protein Folding/Unfolding Transition States. J. Mol. Biol. 2002;319:229–242. doi: 10.1016/S0022-2836(02)00212-7. [DOI] [PubMed] [Google Scholar]
- 31.Duan Y, Kollman PA. Pathways to a protein folding intermediate observed in a 1-microsecond simulation in aqueous solution. Science. 1998;282:740–744. doi: 10.1126/science.282.5389.740. [DOI] [PubMed] [Google Scholar]
- 32.Jackson SE, Fersht AR. Folding of chymotrypsin inhibitor 2.1 Evidence for a two-state transition. Biochemistry. 1991;30:10428. doi: 10.1021/bi00107a010. [DOI] [PubMed] [Google Scholar]
- 33.Harpaz Y, elMasry N, Fersht AR, Henrick K. Direct observation of a better hydration at the N-terminus of an α-helix with glycine rather than alanine as the N-cap residue. Proc. Natl. Acad. Sci. USA. 1994;91:3–15. doi: 10.1073/pnas.91.1.311. [DOI] [PMC free article] [PubMed] [Google Scholar]
- 34.Ludvigsen S, Shen H, Kjaer M, Madsen JC, Poulsen FM. Refinement of the three-dimensional solution structure of barley serine proteinase inhibitor 2 and comparison with the structures in crystals. J. Mol. Biol. 1991;222:621–635. doi: 10.1016/0022-2836(91)90500-6. [DOI] [PubMed] [Google Scholar]
- 35.Shaw GL, Davis B, Keeler J, Fersht AR. Backbone dynamics of chymotrypsin inhibitor 2: effect of breaking the active site bond and its implications for the mechanism of inhibition of serine proteases. Biochemistry. 1995;34:2225–2233. doi: 10.1021/bi00007a017. [DOI] [PubMed] [Google Scholar]
- 36.Li A, Daggett V. Investigation of The Solution Structure of Chymotrypsin Inhibitor 2 Using Molecular Dynamics: Comparison to X-ray and NMR Data. Prot. Eng. 1995;8:1117–1128. doi: 10.1093/protein/8.11.1117. [DOI] [PubMed] [Google Scholar]
- 37.de Prat Gay G, Ruiz-Sanz J, Davis B, Fersht AR. The structure of the transition state for the association of two fragments of the barley chymotrypsin inhibitor 2 to generate native-like protein: implications for mechanisms of protein folding. Proc. Natl. Acad. Sci. USA. 1994;91:10943–10946. doi: 10.1073/pnas.91.23.10943. [DOI] [PMC free article] [PubMed] [Google Scholar]
- 38.Frauenfelder H, Hartmann H, Karplus M, Kuntz ID, Kuriyan J, Parak F, Petsko GA, Ringe D, Tilton RF, Connolly ML, Max N. Thermal expansion of a protein. Biochemistry. 1987;26:254–261. doi: 10.1021/bi00375a035. [DOI] [PubMed] [Google Scholar]
- 39.Tilton RF, Dewan JC, Petsko GA. Effects of temperature on protein structure and dynamics: X-ray crystallographic studies of the protein ribonuclease-A at nine different temperatures from 98 to 320 K. Biochemistry. 1992;31:2469–2481. doi: 10.1021/bi00124a006. [DOI] [PubMed] [Google Scholar]
- 40.Leeson DT, Gai F, Rodriguez HM, Gregoret LM, Dyer RB. Protein folding and unfolding on a complex energy landscape. Proc. Natl. Acad. Sci. USA. 2000;97:2527–2532. doi: 10.1073/pnas.040580397. [DOI] [PMC free article] [PubMed] [Google Scholar]
- 41.Rhoades E, Gussakovsky E, Haran G. Watching proteins fold one molecule at a time. Proc. Natl. Acad. Sci. USA. 2003;100:3197–3202. doi: 10.1073/pnas.2628068100. [DOI] [PMC free article] [PubMed] [Google Scholar]
- 42.Levitt M. ENCAD-Energy Calculations and Dynamics. Yeda, Rehovat, Israel and Stanford University; Stanford, CA: 1990. [Google Scholar]
- 43.Levitt M, Hirshberg M, Sharon R, Daggett V. Potential Energy Function and Parameters for Simulations of the Molecular Dynamics of Proteins and Nucleic Acids in Solution. Computer Physics Communications. 1995;91:215–231. [Google Scholar]
- 44.Levitt M, Hirshberg M, Sharon R, Laidig KE, Daggett V. Calibration and Testing of a Water Model for Simulation of the Molecular Dynamics of Proteins and Nucleic Acids in Solution. J. Phys. Chem. B. 1997;101:5051–5061. [Google Scholar]
- 45.Beck DAC, Armen RS, Daggett V. Cutoff size need not strongly influence molecular dynamics results on solvated polypeptides. Biochemistry. 2005;44:609–616. doi: 10.1021/bi0486381. [DOI] [PubMed] [Google Scholar]
- 46.Haar L, Gallagher JS, Kell GS. NBS/NRC steam tables: thermodynamic and transport properties and computer programs for vapor and liquid states of water in SI units. Hemisphere Pub. Corp.; Washington, DC: 1984. [Google Scholar]
- 47.DeLano WL. The PyMOL molecular graphics system. DeLano Scientific; San Carlos, CA: 2002. [Google Scholar]