Abstract
Dual-color fluorescence cross-correlation spectroscopy (dual-color FCS) has previously been shown to be a suitable tool not only for binding but also for catalytic rate studies. In this work, its application as a rapid method for high-throughput screening (HTS) and evolutionary biotechnology is described. This application is called RAPID FCS (rapid assay processing by integration of dual-color FCS) and does not depend on the characterization of diffusion parameters that is the prerequisite for conventional fluorescence correlation spectroscopy. Dual-color FCS parameters were optimized to achieve the shortest analysis times. A simulated HTS with homogeneous assays for different restriction endonucleases (EcoRI, BamHI, SspI, and HindIII) achieved precise yes-or-no decisions within analysis times of about 1 s per sample. RAPID FCS combines these short analysis times with the development of fast and flexible assays resulting in sensitive, homogeneous fluorescence-based assays, where a chemical linkage between different fluorophores is either cleaved or formed, or where differently labeled molecules interact by noncovalent binding. In principle, assay volumes can be reduced to submicroliters without decreasing the signal strength, making RAPID FCS an ideal tool for ultra-HTS when combined with nanotechnology. RAPID FCS can accurately probe 104 to 105 samples per day, and possibly more. In addition, this method has the potential to be an efficient tool for selection strategies in evolutionary biotechnology, where rare and specific binding or catalytic properties have to be screened in large numbers of samples.
Finding molecules that exhibit specific features, such as binding, inhibiting, or catalytic properties, is a central task in drug development and in biotechnological applications. Molecules with such properties can either be discovered, or they can be designed. In this sense, “discovering” means the isolation and massive screening of natural compounds, whereas molecular “design” can be achieved by rational or evolutionary techniques. Rational design requires a deep insight into molecular biophysics to enable the prediction of structure–function relationships. In contrast, evolutionary design applies the principles of Darwinian evolution to the molecular level and designs novel or altered molecules by a combination of mutation, amplification, and selection. Application of evolutionary techniques in biotechnology, so-called evolutionary biotechnology, was proposed by Eigen and Gardiner in the early 1980s (1) and has found broad acceptance in recent years (2). Unfortunately, in many evolutionary approaches the process of selection is not necessarily linked to amplification. Consequently, selection must be introduced artificially; this is achieved either by mass selection steps (e.g., affinity binding to a target) or by high-throughput screening (HTS) in combination with a suitable assay.
HTS systems are subject to economic constraints and must have short analysis times per sample to enable the processing of large numbers of samples in a reasonable time (3–6). In recent years, major efforts have been undertaken in miniaturization, parallelization, and automation of screening technologies, as well as in the development of new homogeneous assays and the integration of highly sensitive and rapid detection devices. Among the many alternative principles of detection, fluorescence-based techniques are widely used (7, 8); examples are fluorescence resonance energy transfer, fluorescence quenching, fluorescence polarization, time-resolved fluorescence, and fluorescence correlation spectroscopy (FCS) (9–12).
This article focuses on the application of a FCS technique, the dual-color fluorescence cross-correlation spectroscopy (dual-color FCS), to HTS; this combination is called RAPID FCS (rapid assay processing by integration of dual-color FCS). In principle, FCS measures the fluorescence fluctuations from single molecules in a tiny volume element of ≈1 femtoliter and thereby allows a precise determination of the molecular diffusion characteristics by mathematically evaluating the auto-correlation of single-color fluorescence signals. Application of conventional FCS to large number screening has been proposed (11, 13, 14), taking advantage of homogeneous assaying with high sensitivities in tiny sample volumes, but it suffers from relatively long analyses to evaluate diffusion times. Dual-color FCS was proposed by Eigen and Rigler in the early 1990s (11) and has recently been realized in our laboratory (15). Successful applications were demonstrated for hybridization kinetics (15), protein aggregation (16), as well as for enzyme kinetics as described in the preceding article (17).
In this work, the potential of RAPID FCS for HTS is demonstrated. As a first example, a homogeneous assay for detecting restriction enzyme activities was adapted to the specific requirements of dual-color FCS, resulting in analysis times of several hundred milliseconds for reliable yes-or-no decisions. In general, this method can be applied to assays in which a chemical linkage between different fluorophores is either cleaved or formed, or where differently labeled molecules interact by noncovalent binding. RAPID FCS can be adapted to many specific systems and it has a great potential for the development of efficient assays for HTS and evolutionary biotechnology.
MATERIALS AND METHODS
Materials.
Type II restriction endonucleases (E.C. 3.1.21.4) EcoRI (25 units/μl), BamHI (10 units/μl), SspI (8 units/μl), and HindIII (25 units/μl) were purchased from Stratagene); the activities are given in parenthesis. Fluorescently labeled 66-nt oligonucleotides Cy5-ATGGCTAATGACCGAGAATAGGGATCCGAATTCAATATTGGTACCTACGGGCTTTGCGCTCGTATC and RhG-GATACGAGCGCAAAGCCCGTAGGTACCAATATTGAATTCGGATCCCTATTCTCGGTCATTAGCCAT were custom-synthesized and HPLC purified by MWG-Biotech (Ebersberg, Germany); the first oligonucleotide has the fluorescent dye Cy5 (Amersham) and the second oligonucleotide has Rhodamine Green (RhG, Molecular Probes) at their respective 5′ ends. When the two complementary sequences are hybridized they contain the recognition sites of BamHI (underlined), EcoRI (doubly underlined), and SspI (dotted line). The two complementary strands were annealed at concentrations of 1 μM in 100 mM KOAc, 25 mM Tris-acetate (pH 7.6), 10 mM MgOAc, 0.5 mM β-mercaptoethanol, and 10 μg/ml BSA by heating the solution to 94°C and cooling it down to 23°C with a gradient of 1.2°C/min. This resulted in a double-stranded, doubly labeled DNA substrate containing cleavage sites for BamHI, EcoRI, and SspI.
Homogeneous Restriction Endonuclease Assay.
Endonucleolytic assays were carried out for 3 h at 37°C in a reaction buffer suitable for all the restriction enzymes applied in this study; the buffer contained 150 mM KOAc, 37.5 mM Tris-acetate (pH 7.6), 15 mM MgOAc, 0.75 mM β-mercaptoethanol, 515 μg/ml BSA, 0.05% Triton X-100, and 0.5% glycerol, with 1–20 nM labeled DNA substrate and excess amounts (0.08–0.25 units/μl) of restriction enzymes BamHI, EcoRI, SspI, and HindIII.
RAPID FCS Setup.
Rapid measurements were carried out on a dual-color fluorescence cross-correlation spectrometer of which a prototype was developed in our laboratory and which was commercialized by C. Zeiss (dual-color ConfoCor; Zeiss); the setup was as described in the preceding article (17). The confocal detection volume of 0.44 fl was formed by the superimposed focal spots of an argon-ion laser (488 nm) and a helium-neon laser (633 nm), enabling the excitation of RhG and Cy5. The dual-color ConfoCor was equipped with a thermostatting and positioning unit constructed by the workshop at the Max Planck Institute for Biophysical Chemistry, Göttingen. The focal spot was positioned 100 μm above the bottom of the sample vial. The temperature for all measurements was 22°C. A carrier was mounted onto the positioning table and was equipped with a variety of sample holders for standard microtiter plate formats, including contamination-free sealed plastic foils (workshop of the Max Planck Institute for Biophysical Chemistry, Göttingen), and commercial coverglass chambers (Nunc).
Cross-Correlation Analysis.
The theoretical background of cross-correlation analysis has been thoroughly described by Schwille et al. (15). The cross-correlation data were evaluated by using a three-dimensional model for a single diffusing species (18):
 |
1 |
G(0) denotes the correlation amplitude at τ = 0, which is proportional to the concentration of doubly labeled molecules in the observed cylindrical volume element with radius r0 and half-length z0. The parameter τDiff is inversely related to the diffusion coefficient, D, according to the relation τDiff = r02/4D. The experimental data curves were processed with a Marquardt nonlinear least-squares fitting routine implemented in the access 2.0 program (Evotec BioSystems, Hamburg, Germany). This software package allows the handling of large numbers of data files and the simultaneous fitting of correlation data with standard settings. G(0) was the only free parameter for evaluating the rapid cross-correlation measurements. The structural parameter z0/r0 was determined from auto-correlation calibration measurements by using a solution of free dye; the average diffusion time, τDiff, of the substrate was obtained by making a 60-s measurement of the substrate without enzyme addition. Both parameters were then fixed in the fitting procedure of the subsequent fast measurements.
Statistical Evaluation of Rapid Cross-Correlation Results.
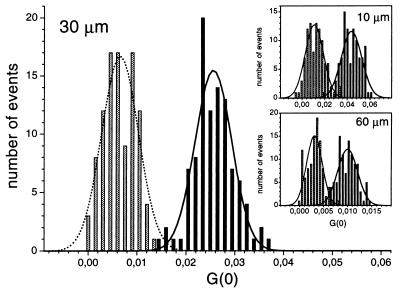
One set of rapid cross-correlation measurements included typically 100 curves that were recorded by using accumulation times between 760 ms and a few seconds. From each set, the amplitudes G(0) (corresponding to the concentration of doubly labeled molecules) that were derived from the fitting procedure were plotted in a histogram graph. These histogram graphs compared the frequencies of G(0) values in preset number ranges (for more details, see Fig. 3). The analysis showed that it was adequate to approximate the extracted G(0) distributions with a Gaussian function and that this allowed a simple comparison of different distributions. Mean values of Gaussian functions corresponded to the average concentration of fluorophores, whereas standard deviations represented the scattering of single measurements. To specify a measure for the discrimination of distributions, the overlap area of the fitted Gaussian curves was calculated by integrating the Gaussian function. Because all the distribution curves showed similar shapes and areas were constant as all data sets included 100 samples, the overlap areas were standardized in percent values such that a 100% overlap corresponded to Gaussian curves with identical mean values and standard deviations.
Figure 3.
Histogram plots showing the distributions of evaluated cross-correlation amplitudes G(0) obtained from samples with and without restriction endonucleolytic activity at different pinhole diameters. The bars indicate the number of G(0) values lying in the respective bin of size 0.0015 (30 μm), 0.0026 (10 μm), or 0.00062 (60 μm). The main part of the figure shows the distributions of samples with (dotted bars) and without (solid bars) enzymatic activity at the optimal diameter (30 μm). The line plots represent the fitted Gaussian distributions. The overlaps of the Gaussian curves are 0.6% (an overlap of 100% would correspond to identical Gaussian curves). (Insets) Histogram plots for pinhole diameters of 10 μm (overlap 2.4%) and 60 μm (overlap 3.4%). Assays were performed by using 10 nM of labeled DNA substrate, incubated for 3 h at 37°C with 0.25 units/μl EcoRI (dotted bars) and with 0.25 units/μl HindIII (solid bars). Correlation times were 1.6 s, and excitation power densities of 38 kW/cm2 (488 nm) and 31 kW/cm2 (633 nm) were used.
RESULTS
The accuracy of fluorescence correlation analyses strongly depends on the analysis time; therefore, the required accuracy determines the minimal time of data recording. In this work, dual-color fluorescence cross-correlation analysis was applied to detect rapidly restriction endonuclease activities in a homogeneous assay. Because this assay was intended to be applied to HTS, the effect of shorter analysis times on the suitability for rapid analysis, as well as the influence of several system settings and assay conditions, was investigated. Finally, a HTS was simulated by using RAPID FCS for probing the enzyme activities of different restriction endonucleases.
Short Correlation Times.
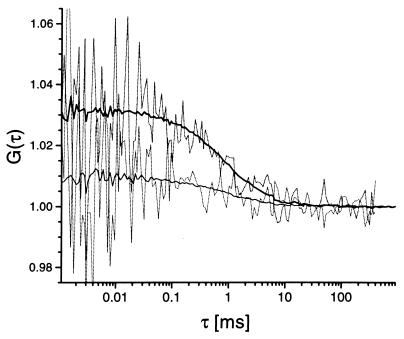
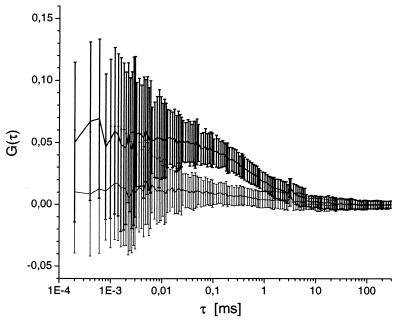
The effect of short analysis times was determined by recording cross-correlation curves of labeled substrate before and after cleavage; analysis durations ranging from several hundred milliseconds to minutes were tested (Fig. 1). Cross-correlation curves recorded over shorter times were noisier than curves derived from data taken over longer times, but the characteristic diffusion times and particle numbers were similar, indicating that both curves contain essentially the same information. Thus, there should be a lower threshold for the duration of data acquisition to allow a clear determination of the cross-correlation amplitudes. A statistical evaluation of standard deviations and mean values for each cross-correlation τ value was carried out to determine the optimal range of τ for the fitting routines. For a set of 100 RAPID FCS analysis runs with analysis times of 760 ms (data not shown), 1.6 s (Fig. 2), and 3.6 s (data not shown), the standard deviations were quite constant over most of the cross-correlation curve, but increased drastically at τ values below 0.01 ms. Above this value, substrate and product cross-correlation curves were clearly distinguishable with an analysis time of 1.6 s or more. Consequently, further fitting routines to determine the cross-correlation amplitudes G(0) were restricted to τ values starting at 10−2 ms.
Figure 1.
Typical cross-correlation curves that were obtained from samples with and without restriction endonucleolytic activity at different analysis times. Assays were performed by using 10 nM labeled DNA substrate, incubated for 3 h at 37°C with 0.25 units/μl EcoRI (lower, thin lines) and without enzyme addition (upper, bold lines). Correlation times were 760 ms (dotted lines) and 120 s (solid lines) by using a 30 μm pinhole diameter and excitation power densities of 19 kW/cm2 (488 nm) and 15 kW/cm2 (633 nm).
Figure 2.
Traces of mean values of each single cross-correlation point and their standard deviations that were obtained from samples with and without restriction endonucleolytic activity. Assays were performed by using 1 nM labeled DNA substrate, incubated for 3 h at 37°C with 0.25 units/μl EcoRI (lower, thin lines) and with 0.25 units/μl HindIII (upper, bold lines). Correlation times were 1.6 s by using a 30 μm pinhole diameter and excitation power densities of 38 kW/cm2 (488 nm) and 31 kW/cm2 (633 nm).
Influence of Dual-Color FCS Settings.
Pinhole diameters were varied between 10 and 60 μm, and the influence of the pinhole diameters at short dual-color correlation times was statistically evaluated for positive and negative samples at different substrate concentrations. The optimal diameter of the pinhole was 30 μm, where a clear separation between positive and negative samples was obtained with a 1.6-s analysis time; the calculated overlap was 0.6% (Fig. 3). Such an optimum may reflect the compromise between an increasing detection efficiency with increasing diameter caused by a longer residence time of fluorophores in the focus, and a decreasing signal to noise ratio with increasing diameter caused by a larger fluorescence background. The influence of the intensities of the excitation lasers was studied by comparing the cross-correlation amplitudes. The amplitude ratio between positive and negative samples, as well as the difference between the amplitudes, became maximal at 19 kW/cm2 and 15 kW/cm2 at 488 nm and 633 nm, respectively (Table 1). Most probably these values are optima between the photobleaching of the fluorescent dyes at high intensities and insufficient excitation at low intensities. Because the photobleaching is usually higher and the quantum efficiency is lower for bound fluorescent dyes, both too low and too high intensities lead to an overrepresentation of the free dye molecules, thereby lowering the cross-correlation amplitude.
Table 1.
Optimization of excitation power
| Excitation power at 488 nm | 10 kW/cm2 at 633 nm | 15 kW/cm2 at 633 nm | 31 kW/cm2 at 633 nm |
|---|---|---|---|
| 12 kW/cm2 | 2.0/1.1 | ||
| 19 kW/cm2 | 1.7/0.7 | 2.6/1.3 | 1.8/0.5 |
| 38 kW/cm2 | 1.8/1.0 | 1.8/0.9 | 2.6/1.1 |
| 61 kW/cm2 | 2.0/0.9 |
The laser excitation was optimized using a solution of 10 nM labeled DNA substrate incubated for 3 h at 37°C with 0.25 unit/μl EcoRI for positive (+) and with 0.25 unit/μl HindIII for negative (−) control. The correlation time was 60 s using a 20-μm pinhole diameter. For each excitation pair the ratio G−(0)/G+(0) and the difference G−(0) − G+(0) of the correlation amplitudes was calculated. The best separation of correlation amplitudes was achieved at 19 kW/cm2 for 488 nm and 15 kW/cm2 for 633nm.
Influence of Assay Parameters.
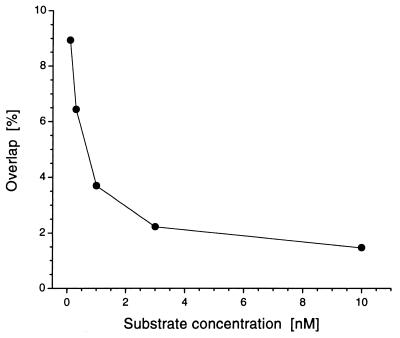
The effect of substrate concentrations between 0.1 and 10 nM for discriminating positive (with enzyme activity) and negative samples (without enzyme activity) was analyzed at short data acquisition times (Fig. 4). The distribution became increasingly separated as the concentrations increased, resulting in a minimum overlap of the Gaussian fits at 10 nM. Higher concentrations did not improve the separation but aggravated the correlation analysis (data not shown). Non-cross-correlating fluorescent molecules had only a minor influence when either RhG- or Cy5-labeled oligonucleotides were added to positive and negative samples in an equimolar amount (5 nM, data not shown). Therefore, purity of the substrates is supposed to be a relevant, but not a crucial parameter.
Figure 4.
Influence of the substrate concentration on the separability of distributions from samples with and without enzymatic activity. The overlap of Gaussian fittings was plotted versus substrate concentration. Assays were performed as described in legend of Fig. 3 by using a pinhole diameter of 30 μm.
Simulation of HTS.
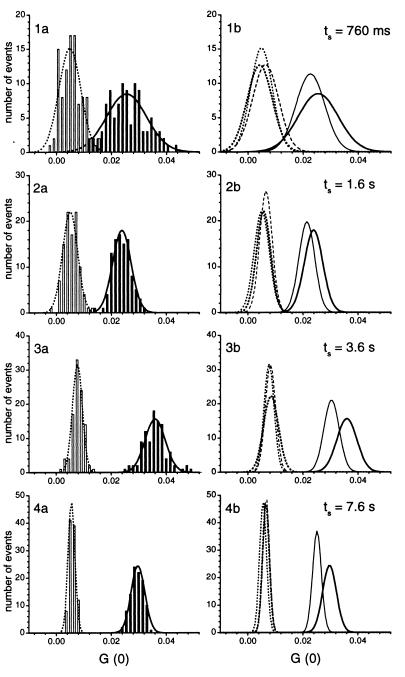
HTS for enzymatic activity was simulated by using the sequence-specific cleavage activities of four different restriction endonucleases. BamHI, EcoRI, and SspI served as positive controls, whereas HindIII, whose recognition sequence was not included in the substrate sequence and a sample without any added enzyme, served as negative controls. With optimal system settings and assay parameters, these reference samples were analyzed in a simulated HTS run in volumes of 5 μl and with analysis times ranging from 760 ms to 7.6 s (Fig. 5). The distributions of each sample variant could be characterized by Gaussian functions, i.e., by their mean values and overlaps. With increasing analysis times, the distributions became increasingly narrow and their mean values became clearly separated; however, at the shortest analysis time (760 ms), the distributions showed an overlap in the range of 2.6 to 5.4%. With an analysis time of 1.6 s, distributions of positive and negative samples were almost perfectly separated, as shown exemplarily with BamHI and HindIII (remaining overlap of 0.1%) (Fig. 5).
Figure 5.
Application of RAPID FCS for a simulated HTS for restriction endonucleolytic activities. The samples were screened in a circular manner for a total of 500 measurements at each analysis time. Left-hand plots (1a–4a) compare the distributions of samples with (BamHI, open bars) and without specific endonucleolytic activity (HindIII, solid bars) for analysis times of 760 ms, 1.6 s, 3.6 s, and 7.6 s. Distributions of the cross-correlation amplitudes G(0) were evaluated as described in the legend of Fig. 3 with bin sizes of 0.0015. The right-hand plots (1b–4b) show the ability to separate the different restriction endonucleases by their extracted Gaussian fittings with pure substrate (solid lines), HindIII (bold solid lines), BamHI (bold dotted lines), EcoRI (dotted lines), and SspI (dashed lines). The overlaps were 2.6–5.4% (760 ms), 0.1% (1.6 s), <0.002% (3.6 s), and ≪ 10−5% (7.6 s). Assays were performed in 5 μl volumes with 10 nM labeled DNA substrate, incubated for 3 h at 37°C with 0.25 unit/μl HindIII, 0.1 unit/μl BamHI, 0.25 unit/μl EcoRI, 0.08 unit/μl SspI and without enzyme addition. Excitation power densities of 19 kW/cm2 (488 nm) and 15 kW/cm2 (633 nm) and a pinhole diameter of 30 μm were applied. During the time of sample positioning the beams of the excitation lasers were blocked by an automatic shutter control.
DISCUSSION
Dual-color FCS has previously been applied to sensitive endpoint determinations and real-time kinetic studies of nucleic acid hybridization (15), of protein aggregation (16), as well as of enzymatic reactions [see the preceding article (17)]. In these cases, analysis times were between 30 and 120 s for precise determinations of cross-correlation amplitudes and diffusion times; this is far from suitable for HTS applications. In this article, a RAPID FCS for homogeneously assaying large numbers of catalyzed cleavage or addition reactions is presented. At present, this setup is characterized by analysis times of about 1 s and sample volumes of a few microliters (and below), but all parameters can still potentially be scaled down further. However, the most striking advantages of the method are the generality and the flexibility in assay design. In principle, it can be applied to any reaction that can be linked to the establishment or the destruction of chemical bonds between two spectrally different fluorescent dyes. A simulated HTS for restriction endonuclease activities was carried out, where the analysis time of 1.6 s was sufficient to diminish the overlap between the positive and the negative samples to 0.1%. Therefore, the present lower limit of analysis times without any further modifications is between 1 and 2 s, depending on the desired tolerance for false-positives or false-negatives.
Even faster analyses could be achieved with an on-line evaluation of the cross-correlation data. The correlation procedure is a real-time process; therefore, an on-line fitting during the correlation process is possible. Such a procedure is being developed and will markedly shorten the assay times, because the time to record the data can then be adapted to the actual experimental results. In the case of screening for restriction enzyme activities as described in this study, most samples would be negative because the specific enzyme activity is usually rare in any applied library. Although distributions of negative samples (i.e., a mean amplitude of 0.02–0.03) are relatively broad when using 760-ms analysis times, about two-thirds of them are clearly distinguished from positive references. By using a Gaussian-like distribution of positive samples and setting a tolerance level that defines how many unidentified positive events can be tolerated during a screening run, a threshold of G(0) can be defined for clearly negative samples. All samples revealing a G(0) value below this threshold would immediately be analyzed again for the same record time, resulting in a 2-fold analysis time. For this analysis time a threshold must be defined again. Because the distributions are even better separated for analysis times of 1.6 s, most of the samples will be identified as false-positives. Positive samples will be subjected to successively longer analysis times until the high certainty of conventional cross-correlation analysis is achieved. Such an “adapted” speed of acquisition and analysis will not only increase the overall pace of screening, but will also reduce the amount of processed data and incorporate a validation and a characterization of the positive events into the prescreening run by using the same sample and detection device. Applying such an adapted speed to the restriction assay in this study, an average assay time of 930 ms at a tolerance level of less than 0.1% for unidentified positives was estimated.
The lower physical limit of the correlation times for RAPID FCS is the ratio of the minimal number of events necessary for a correlation analysis and the frequency of such events. It depends on the frequency with which doubly labeled fluorescent molecules enter the detection volume element, the average residence time in the focus volume, as well as the photon emission and collection efficiencies. The shortest possible correlation time has been estimated to be several milliseconds for nanomolar concentrations of molecules with diffusion coefficients of 10−5–10−7 cm2/s (11). Thus, the accuracy for distinguishing positive and negative samples presented in this work should in principle be within reach with analysis times at least one order of magnitude lower than those recorded here. This could be achieved by an improved detection efficiency, by a higher signal to noise ratio, and by more adapted correlation algorithms. In addition, it is even no longer required to carry out correlation analysis, which is the fundamental prerequisite for single-color FCS. Dual-color FCS is independent of characterizing the difference in mass, but it is based on the identification of fluctuations that happen simultaneously in both channels. Instead of performing a lengthy correlation analysis, single molecules that bear both labels can be identified by a coincidence analysis of fluorescence bursts in both channels; this is expected to enable more rapid data recording and evaluation. Finally, dual-color FCS is not restricted to fluctuations originating from translational diffusion processes. Alternatively, short analysis times can be achieved independently from the mass-dependent diffusion by a directed flow through the focal volume element (19, 20), or by scanning the focus through the sample.
One of the most important advantages for the development of homogeneous assays based on dual-color FCS is the general applicability and the flexibility of the method. Target design for conventional single-color FCS is limited by the necessity for distinguishing the diffusion times of fluorescent molecules in positive and negative samples. Other fluorescence techniques based on fluorescence resonance energy transfer or fluorescence quenching are restricted by the requirement that the two fluorophores be separated by short distances. Fluorescence polarization assays require an altered fluorophore flexibility to monitor a reaction. Assays based on dual-color FCS avoid these limitations by simply “counting” the doubly-labeled molecules in a femtoliter volume. Its versatility arises from the principal applicability to any reaction that establishes or destroys a covalent or a noncovalent bond between two spectrally distinguishable fluorescent dyes. Therefore, screenings of enzyme activities, as well as inhibitors of enzymatic processes, are feasible. The development of an assay is faster and more flexible; the substrate can be designed without being concerned about the diffusion times, distances between fluorophores, or fluorophore flexibilities.
This work extended dual-color FCS to high-throughput screening applications; the combination is called RAPID FCS. With this technique a measurement volume of only one femtoliter (the size of an Escherichia coli cell) is required, lending itself to miniaturization. The potential of the technology is exhibited by flexible and easy-to-develop homogeneous assays with high sensitivities in the picomolar range (17), and with competitive analysis times per sample of one second and below, allowing throughput rates of 104 to 105 samples per day. The physical limitations of the method have not yet been reached. By operating on a nano-scale (20), it offers possibilities well beyond current fluorescence-based technologies. In addition to its application for HTS, RAPID FCS is an ideal tool for complex selection processes in evolutionary biotechnology. Most evolutionary setups select for binders with higher affinities and specificities, because then selection can be accomplished by a simple affinity separation of fitter variants from a large background of mutants. Evolutionary optimization of targets like enzymes, ribozymes, or catalytic antibodies by direct catalytic activity screening is often difficult to realize. Therefore, only a few successful examples have been reported until now (21–27). With RAPID FCS, it is now possible to accurately and rapidly probe very large libraries of mutants with respect to their catalytic features. Combining this technology with novel mutagenesis technologies such as error-prone PCR or DNA-shuffling, will open up possibilities for the design or the optimization of a great variety of catalytic functions by applying the principles and methods of evolutionary biotechnology.
Acknowledgments
We are grateful to Dr. Petra Schwille for expert advice and for helpful discussions. We acknowledge the construction of the ConfoCor positioning and temperature unit by Wolfgang Simm and the workshop of the Max Planck Institute for Biophysical Chemistry. In addition, we thank Klaus Dörre and Dr. Jens Stephan for discussions, and Margitta Clegg for reading the manuscript. This work was supported by the German Bundesministerium für Bildung, Wissenschaft, Forschung und Technologie (Grant 0310739), by Evotec BioSystems, Hamburg, and by the Max Planck Society.
ABBREVIATIONS
- FCS
fluorescence correlation spectroscopy
- dual-color FCS
dual-color fluorescence cross-correlation spectroscopy
- HTS
high-throughput screening
- RAPID FCS
rapid assay processing by integration of dual-color FCS
References
- 1.Eigen M, Gardiner W. Pure Appl Chem. 1984;56:967–978. [Google Scholar]
- 2.Koltermann A, Kettling U. Biophys Chem. 1997;66:159–177. doi: 10.1016/s0301-4622(97)00063-x. [DOI] [PubMed] [Google Scholar]
- 3.Palmer M A J. Nat Biotechnol. 1996;14:513–515. doi: 10.1038/nbt0496-513. [DOI] [PubMed] [Google Scholar]
- 4.Okun I, Veerapandian P. Nat Biotechnol. 1997;15:287–288. doi: 10.1038/nbt0397-287. [DOI] [PubMed] [Google Scholar]
- 5.Harding D, Banks M, Fogarty S, Binnie A. Drug Discovery Today. 1997;2:385–390. [Google Scholar]
- 6.Broach J R, Thorner J. Nature (London) 1996;384:14–16. [PubMed] [Google Scholar]
- 7.Rogers M V. Drug Discovery Today. 1997;2:156–160. [Google Scholar]
- 8.Schober A, Günther R, Tangen U, Goldmann G, Ederhof T, Koltermann A, Wienecke A, Schwienhorst A, Eigen M. Rev Sci Instrum. 1997;68:2187–2194. [Google Scholar]
- 9.Magde D, Webb W W, Elson E L. Phys Rev Lett. 1972;29:705–708. [Google Scholar]
- 10.Ehrenberg M, Rigler R. Chem Phys. 1974;4:390–401. [Google Scholar]
- 11.Eigen M, Rigler R. Proc Natl Acad Sci USA. 1994;91:5740–5747. doi: 10.1073/pnas.91.13.5740. [DOI] [PMC free article] [PubMed] [Google Scholar]
- 12.Maiti S, Haupts U, Webb W W. Proc Natl Acad Sci USA. 1997;94:11753–11757. doi: 10.1073/pnas.94.22.11753. [DOI] [PMC free article] [PubMed] [Google Scholar]
- 13.Rigler R. J Biotechnol. 1995;41:177–186. doi: 10.1016/0168-1656(95)00054-t. [DOI] [PubMed] [Google Scholar]
- 14.Sterrer S, Henco K. J Recept Signal Transduct Res. 1997;17:511–520. doi: 10.3109/10799899709036624. [DOI] [PubMed] [Google Scholar]
- 15.Schwille P, Meyer-Almes F-J, Rigler R. Biophys J. 1997;72:1878–1886. doi: 10.1016/S0006-3495(97)78833-7. [DOI] [PMC free article] [PubMed] [Google Scholar]
- 16.Bieschke J, Schwille P. In: Fluorescence Microscopy and Fluorescent Probes, Vol. 2. Slavik J, editor. New York: Plenum; 1997. , in press. [Google Scholar]
- 17.Kettling U, Koltermann A, Schwille P, Eigen M. Proc Natl Acad Sci USA. 1998;95:1416–1420. doi: 10.1073/pnas.95.4.1416. [DOI] [PMC free article] [PubMed] [Google Scholar]
- 18.Rigler R, Widengren J. Bioscience. 1990;3:180–183. [Google Scholar]
- 19.Brinkmeier M, Rigler R. Exp Tech Phys. 1995;41:205–210. [Google Scholar]
- 20.Brinkmeier M, Dörre K, Riebeseel K, Rigler R. Biophys Chem. 1997;66:229–239. doi: 10.1016/s0301-4622(97)00065-3. [DOI] [PubMed] [Google Scholar]
- 21.Li T, Janda K D, Lerner R A. Nature (London) 1996;379:326–327. doi: 10.1038/379326a0. [DOI] [PubMed] [Google Scholar]
- 22.Lerner R A, Janda K D. EXS. 1995;73:121–138. doi: 10.1007/978-3-0348-9061-8_7. [DOI] [PubMed] [Google Scholar]
- 23.Black M E, Loeb L A. Methods Mol Biol. 1996;57:335–349. doi: 10.1385/0-89603-332-5:335. [DOI] [PubMed] [Google Scholar]
- 24.Christians F C, Loeb L A. Proc Natl Acad Sci USA. 1996;93:6124–6128. doi: 10.1073/pnas.93.12.6124. [DOI] [PMC free article] [PubMed] [Google Scholar]
- 25.Moore J C, Arnold F H. Nat Biotechnol. 1996;14:458–467. doi: 10.1038/nbt0496-458. [DOI] [PubMed] [Google Scholar]
- 26.Shao Z, Arnold F H. Curr Opin Struct Biol. 1996;6:513–518. doi: 10.1016/s0959-440x(96)80117-5. [DOI] [PubMed] [Google Scholar]
- 27.Zhang J H, Dawes G, Stemmer W P C. Proc Natl Acad Sci USA. 1997;94:4504–4509. doi: 10.1073/pnas.94.9.4504. [DOI] [PMC free article] [PubMed] [Google Scholar]


