

Abstract
Mutagenic, reproductive, and toxicity effects of two closely related chemicals, ethylnitrosourea (ENU) and methylnitrosourea (MNU), were compared at equimolar and near-equimolar doses in the mouse specific-locus test in a screen of all stages of spermatogenesis and spermiogenesis. In stem-cell spermatogonia (SG), ENU is more than an order of magnitude more mutagenic than MNU. During post-SG stages, both chemicals exhibit high peaks in mutation yield when differentiating spermatogonia (DG) and preleptotene spermatocytes are exposed. The mutation frequency induced by 75 mg MNU/kg during this peak interval is, to date, the highest induced by any single-exposure mutagenic treatment – chemical or radiation – that allows survival of the exposed animal and its germ cells, producing an estimated 10 new mutations per genome. There is thus a vast difference between stem cell and differentiating spermatogonia in their sensitivity to MNU, but little difference between these stages in their sensitivity to ENU.
During stages following meiotic metaphase, the highest mutation yield is obtained from exposed spermatids, but for both chemicals, that yield is less than one-quarter that obtained from the peak interval. Large-lesion (LL) mutations were induced only in spermatids. Although only a few of the remaining mutations were analyzed molecularly, there is considerable evidence from recent molecular characterizations of the marker genes and their flanking chromosomal regions that most, if not all, mutations induced during the peak-sensitive period did not involve lesions outside the marked loci. Both ENU and MNU treatments of post-SG stages yielded significant numbers of mutants that were recovered as mosaics, with the proportion being higher for ENU than for MNU.
Comparing the chemicals for the endpoints studied and additional ones (e.g., chromosome aberrations, toxicity to germ cells and to animals, teratogenicity) revealed that while MNU is generally more effective, the opposite is true when the target cells are SG.
Keywords: Mouse, Mutagenesis, Specific-locus mutations, Germ-cell stage, Ethylnitrosourea (ENU), Methylnitrosourea (MNU), Spermatogonia
1. Introduction
Almost three decades ago, N-ethyl-N-nitrosourea (ENU) was demonstrated to be the most effective germline mutagen in the mouse when administered to stem-cell spermatogonia [1,2]. Productive dosing regimens that were subsequently developed [3] yield mutation rates 12 times higher than those obtainable with X-rays. Already in the first publication [1], there were strong indications that most, if not all, of the mutations were intragenic, and it has subsequently been shown that ENU-induced mutations in spermatogonia are, for the most part, single-base-pair changes [4–8]. ENUs superior effectiveness in inducing point mutations has subsequently fulfilled the statement made back in 1979 [1] that it “would be the mutagen of choice for the production of new mutations in the mouse whenever gene mutations of any of various kinds might be needed”. Indeed, ENU has been used worldwide for gene discovery, fine-structure mapping, and the generation of allelic series [9].
By contrast, stem-cell spermatogonia were found to be relatively resistant to mutation induction by the related chemical N-methyl-N-nitrosourea (MNU), although this chemical was highly mutagenic in differentiating spermatogonia [10,11]. The MNU data were presented at meetings, as were large-scale ENU experiments on poststem-cell stages of spermatogenesis [12], but were not published in detail prior to the death of William L. Russell. Subsequently, mutagenesis experiments on MNU and ENU were carried out at Neuherberg [13–15].
A comparison between the actions of these two closely related chemicals on a number of endpoints appears of interest. The mutagenic effects of ENU on stem-cell spermatogonia have been studied and reported extensively [1–3,13,16]. This paper reports on large-scale ENU experiments on the subsequent germ-cell stages, as well as on MNU mutagenesis studies on all male germ-cell stages. The choice of exposure levels made it possible to compare equimolar doses and revealed dramatic differences in the response of different types of germ cells to closely related chemicals.
2. Materials and methods
2.1. Animals
Mutation induction was studied by the morphological specific-locus test (SLT) [17], in which mutagen-exposed wild-type mice are mated to mice that are homozygous for recessives at each of seven loci (a/a; Tyrp1b/Tyrp1b; p Tyrc-ch/p Tyrc-ch; Myo5ad Bmp5se/Myo5ad Bmp5se; Ednrbs/Ednrbs), so that mutations can be visually detected in the immediate progeny. All males were genetically uniform (101/Rl × C3H/Rl)F1 hybrids, while the multiple-recessive females came from the random-bred T stock. All mice were bred in the Mammalian Genetics facility at the Oak Ridge National Laboratory.
2.2. N-Ethyl-N-nitrosourea (ENU) experiments
The ENU experiments were conducted between February 1979 and January 1984 at three exposure levels, 50, 100, and 250 mg ENU/kg, in altogether 23 replicates: 11, 7, and 5, respectively. Except for a smaller group at the start of each dose series, each replicate involved 80 treated males aged 11–14 weeks (except for two of the 5 replicates at 250 mg ENU/kg for which the age range was 9–17 weeks).
Of the total of 1551 injected males, 193 (12.4%) received ENU purchased from Bio-Clinical Laboratories (Bohemia, NY). For the remaining 87.6%, the ENU was synthesized at Oak Ridge National Laboratory by Dr. D.G. Doherty. It had been shown previously that ENU from these two sources yielded similar frequencies of mutations from exposed stem-cell spermatogonia [16]. The chemical was dissolved in phosphate buffer adjusted to pH 6.0, as previously described [1], at concentrations of 1.5, 3.0, and 7.5 mg/ml for exposures, respectively, to 50, 100, and 250 mg ENU/kg. The solution was injected intraperitoneally, the volume being adjusted to the body weight of the animals, such that a 30 g mouse would receive 1 ml.
Three to 5 h following injection, each male was housed with two T-stock females. Seven days later, and at weekly intervals thereafter, each male was re-mated to a fresh set of two T females. The females were moved to individual cages following their week of cohabitation with the male. At the 50 mg ENU/kg exposures, the fifth and sixth mating weeks were each split in two (designated weeks 5a, 5b, 6a, and 6b), i.e., females were replaced after the first 3 (rarely, 4) days during these weeks; all experiments were terminated after 7 weeks. Thus, there were nine mating intervals scored for each of the replicates at that dose. At 100 mg ENU/kg, experiments were terminated after 4 weeks of serial matings, since pilot studies had shown that virtually no offspring would result from subsequent matings. For similar reasons, all 250 mg ENU/kg replicates were terminated after 3 weekly matings.
2.3. N-Methyl-N-nitrosourea (MNU) experiments
The MNU experiments were conducted between March 1981 and June 1983 at two exposure levels, 75 and 44 mg MNU/kg. The former dose is slightly below the LD50 (Generoso, personal communication, see Section 3), and the latter was chosen because it is equimolar to 50 mg ENU/kg, at which the majority of poststem-cell ENU data had been collected. (Molecular weights: MNU, 103.1 and ENU, 117.1.) Experiments with 75 and 44 mg MNU on poststem-cell stages were conducted in five and seven replicates, respectively (including one small replicate for which the dose was 50, instead of 44 mg/kg). Nine of the replicates each involved 80-mated males, and three involved 38–40 males each, a total of 836 males. Additional injected males were held in reserve and used as immediate replacements for treated males that died.
MNU (purity ≥ 99%) was obtained from the National Toxicology Program’s Chemical Repository and originally purchased from Sigma Chemicals (St. Louis, MO). The chemical was dissolved in phosphate buffer, pH 6.0, at concentrations of 2.25 or 1.32 mg/ml for the higher and lower dose, respectively. The solution was injected intraperitoneally, the volume being adjusted to the body weight of the animals, such that a 30 g mouse would receive 1 ml.
The weekly mating scheme during the 7-week mating period was similar to that described for ENU, except that in two small replicates, each male was mated to a single female (instead of two). In all replicates at the 44 mg MNU/kg exposure, and in two of the five replicate at 75 MNU/kg, the fifth and sixth mating weeks were each split in two, i.e., females were replaced after 3 (rarely, 4) days during these weeks.
For the scoring of mutations induced in stem-cell spermatogonia, mice were exposed to 75, 70, or 80 mg MNU/kg (weighted average, 74.6 mg MNU/kg) in altogether four replicates. Males were mated to two T-stock females each at 12 or 16 weeks postinjection (two replicates), or at 7 weeks (two replicates, which continued the matings of the first 7 weeks). In all, but one of the replicates, males were re-mated at weekly intervals to a fresh set of two T females, which were moved to individual cages following the week of cohabitation with the male. This cycle was repeated every 7 weeks for the duration of the males’ reproductive life.
2.4. Detection and study of mutations
At weaning age (18–21-days old), all offspring were examined for the presence of externally visible phenotypes that could be the result of specific-locus mutations or other genetic changes; some of these phenotypes had already been noted at pre-weaning ages. Presumed mutants were appropriately mated to confirm allelism at one of the marked loci. Additionally, mottled or variegated probands were test-mated to determine whether they might be gonosomic mosaics for an allele at one of the specific loci, i.e., whether their genotype was +/m///m*/m (where m is the marker allele and m* the mutant allele, and /// separates the two genotypes of the mosaic). Alternatively, variegated probands might be mutant at an X-linked locus expressed in a daughter, or heterozygous for a dominant autosomal mottling mutation, or “mottled” due to environmental causes.
In the case of specific-locus mosaics, the locus at which the mutation might have occurred can generally not be deduced with certainty from the appearance of the non-wild-type fur patches, so that it is usually necessary to employ a number of different mates for the genetic tests. Additionally, mosaics at the Bmp5 and Ednrb loci would be difficult or impossible to detect. If the mutant allele differs from the marker allele, or if the mutation was at a locus with linkage to another marker locus (Myo5a and Bmp5, p and Tyr), tests are simple, and usually definitive. If neither of these situations pertains, gonosomic mosaicism can be detected only from abnormal transmission ratios. In the case of female probands, the various required test matings must be performed successively and a sufficient number of offspring collected from each to detect abnormal ratios, a requirement that often cannot be met. There is also the possibility that mosaicism involves only the soma and not the gonad, or that the mutant sector of the gonad is too small to yield a detectable frequency of offspring.
Whole-body or mosaic mutants for which allelism had been confirmed were subjected to additional genetic tests to determine whether the new mutation was homozygous viable (and, if so, what its homozygous phenotype was), prenatally lethal, or postnatally lethal (and, if so, at what stage). In addition to presumed specific-locus mutants, all animals with externally detectable variations in morphology or pigmentation were recorded, and most were genetically tested to determine whether the variation was transmissible and, if so, in what manner. Only transmissible phenotypes are included in the tables.
2.5. Statistical analyses
Statistical comparisons of mutation rates were made by Fisher’s exact test (www.exactoid.com). Significances of other differences were calculated by chi-square. Confidence limits were derived from the tables of Crow and Gardner [18].
2.6. Assignment of germ-cell stage exposed
Conclusions about what exposed germ-cell stage gave rise to the sperm that produced a given offspring were based on the interval between injection and conception of that offspring, using the time relations derived by Oakberg [19] for ejaculated sperm. Applying these criteria, week 1 samples spermatozoa; weeks 2 and 3 sample spermatids (from late through early); week 4 samples meiotic divisions, preceded by late spermatocytes (diplotene and late pachytene). The first part of week 5, designated 5a, samples early pachytene spermatocytes, while 5b samples leptotene and preleptotene spermatocytes. During week 6, one traverses (in reverse order) various substages of differentiating spermatogonia (B, In, A4, A3, A2, and A1), to be collectively abbreviated as DG. Finally, week 7 samples Aa1 and Apr spermatogonia. From day 50 on, all offspring are derived from stem-cell spermatogonia, As, which will be abbreviated SG.
It should be noted that sequential matings made at 1-week intervals sample primarily the early part of a week since males tend to mate as soon as females come into estrus (every 4–5 days). It is for this reason that, after early replicates indicted high mutation rates for weeks 5 and 6, these weeks were split into two mating periods each for the remainder of the studies (see Sections 2.2 and 2.3). When males are mated continuously, instead of sequentially, stage assignments become very uncertain, since, with the much smaller number of mating opportunities available, the possibility of sperm storage cannot be entirely dismissed (see frequency of fertile mating, discussed in Section 3.1). Similarly, histological identification of germ cells in mixed populations, as encountered in mutagenesis studies on transgenic mice, makes it more difficult to attribute mutants to specific stages [20].
3. Results
3.1. Survival and productivity
No significant mortality of exposed males was observed at the lowest exposure to either of the chemicals. Following 44 mg MNU/kg, all 478 treated males survived the entire 7-week mating period; and following treatment with the equimolar dose of 50 mg ENU/kg, only three of the 800 mated males (0.38%) died during the 7 weeks, two of the three in the first week.
At higher exposure levels, however, MNU was considerably more toxic than ENU. Following 75 mg MNU/kg, 72 of 430 mated males (16.7%) died during the 7-week mating period, with 82% of the deaths occurring during the first 4 weeks (43% of them during the third week). By contrast, 100 mg ENU/kg did not cause a single death among 408 males (P < 0.00001). In fact, even at the high dose of 250 mg ENU/kg, the mortality among 341 mated males was only 7.3% during 3 weeks of mating, i.e., lower than that which occurred during the first 3 weeks following 75 mg MNU/kg, when it was 11.6% (P = 0.049). These findings parallel those of Generoso (personal communication), who observed 27.8% deaths within 45 days after injection with 75 mg MNU/kg, but only 8.2% within 3 weeks after 250 mg ENU/kg. Ehling and Neuhäuser-Klaus [15] note only that 70 mg MNU/kg was “slightly toxic”.
While all offspring were examined at weaning age, pups in selected groups were also observed at birth. Following exposure of spermatids and spermatozoa to 250 mg ENU/kg (the highest dose), survival of offspring between birth and weaning age was 95.4% (5050/5292). This high survival rate confirms that any dominant-lethal mutations are expressed prior to birth.
Productivity data for the post-SG experiments with ENU and MNU are shown in Table 1. Although the experiments, as well as the multiple replicates of any one experiment, were spread over a 5-year period, one may, for any given treatment, legitimately compare the various postinjection intervals, since each group of males, no matter when injected, traversed the consecutive matings described in Section 2. Decreases in average litter size provide an approximate indication of dominant lethality, while decreases in litters per male may be an indication of morbidity following injection (i.e., fewer attempted copulations) and, beyond this, are the result of germ-cell killing (primarily) and/or dominant lethality (secondarily).
Table 1.
Productivity of males following exposure to ENU or MNU
| Weeka | ENU
|
MNU
|
|||||||||||||
|---|---|---|---|---|---|---|---|---|---|---|---|---|---|---|---|
| 50 mg/kg
|
100 mg/kg
|
250 mg/kg
|
44 mg/kg
|
75 mg/kg
|
|||||||||||
| Number of males | Litters per mate | Average litter size | Number of males | Litters per mate | Average litter size | Number of malesb | Litters per mate | Average litter size | Number of males | Litters per matec | Average litter size | Number of malesb | Litters per matec | Average litter size | |
| 1 | 802 | 0.70 | 6.9 | 408 | 0.66 | 6.6 | 321 | 0.39 | 6.6 | 478 | 0.70 | 6.7 | 342 | 0.46 | 6.3 |
| 2 | 802 | 0.76 | 7.2 | 408 | 0.70 | 7.0 | 316 | 0.53 | 5.6 | 478 | 0.74 | 6.4 | 327 | 0.38 | 4.7 |
| 3 | 802 | 0.78 | 7.1 | 408 | 0.74 | 6.4 | 316 | 0.53 | 4.4 | 478 | 0.72 | 6.5 | 346 | 0.38 | 4.8 |
| 4 | 802 | 0.66 | 6.0 | 328 | 0.47 | 4.9 | 478 | 0.78 | 6.8 | 351 | 0.57 | 6.1 | |||
| 5 + 5a | 802 | 0.32 | 5.3 | 8 | 0.06 | (1) | 478 | 0.62 | 6.4 | 353 | 0.62 | 6.5 | |||
| 5b | 797 | 0.53 | 6.1 | 478 | 0.64 | 6.5 | 160 | 0.60 | 5.8 | ||||||
| 6 + 6a | 801 | 0.29 | 4.9 | 478 | 0.51 | 6.2 | 357 | 0.54 | 5.6 | ||||||
| 6b | 797 | 0.12 | 4.2 | 478 | 0.61 | 6.9 | 160 | 0.47 | 5.3 | ||||||
| 7 | 801 | 0.03 | 3.7 | 478 | 0.79 | 6.8 | 358 | 0.69 | 6.3 | ||||||
Week 1 begins with the day of injection, designated day 1. Weeks 5a, 5b, 6a, 6b, designate, respectively, days 29–31, 32–35, 36–38, 39–42. For the three replicates at 75 mg MNU/kg in which mating weeks 5 and 6 were not split into two portions (see Section 2.3), results for week 5 (i.e., days 29–35) have been combined with those for week 5a, and results for week 6 (i.e., days 36–42) have been combined with those for week 6a, because experience shows that when male mice are caged with females for a full week, most copulations occur during the first half of that week.
Males that died during a given week are subtracted from those mated, on the assumption that they were moribund and unable to sire offspring.
Litters per male are generally twice the number shown, except in this dose group, which included a single small replicate in which only a single female (instead of two) was paired with each male, In all groups, some of the decrease for weeks 5a, 5b, 6a and 6b may be attributable to the shorter mating interval.
During the first 7 weeks after injection, when exposed post-SG stages are sampled, the MNU data indicated only moderate germ-cell killing at 75 mg/kg, and none at 44 mg/kg. By contrast, even the lowest dose of ENU, 50 mg/kg, caused significant amounts of germ-cell killing during intervals starting with the fifth week postinjection (exposed spermatocytes and earlier stages); and following the higher doses of ENU, essentially no offspring were recovered from matings made after the fourth week.
Any sterility observed in matings made after the seventh week postinjection results from the death of SG (stem-cell spermatogonia) [19]. Counting from day 49, a sterile period (when no male is fertile) of 9 or more days was found to follow 50 mg ENU/kg (WR unpublished), and a sterile period of more than 6 weeks was produced by 250 mg ENU/kg [1]. MNU fertility data for matings made subsequent to day 49 were obtained in the present experiment at the 75 mg/kg dose. There was no time when all males were sterile following MNU treatment; however, the number of litters produced from week-8 and -9 matings was only about 20% of that typically produced in subsequent weeks, indicating that some, but not all, males were sterile during that period. A histological study of germ-cell response had indeed found MNU to be less effective than ENU in killing undifferentiated spermatogonia [21]. Thus, the fraction of such cells that survived 5 days after injection was found to be 74.8% after 75 mg MNU/kg, but only 14.5% or 36.0% after 100 or 50 mg ENU/kg, respectively.
The MNU results for 75 mg/kg indicate that dominant-lethal mutations are induced during weeks 2 and 3 preconception (exposed spermatids), in confirmation of the uterine-dissection results reported for that dose [22,15]. At 44 mg MNU/kg, no clear depressions in litter size were detectable. Generoso et al.’s uterine-dissection results for a similar dose [22] suggest a low frequency of dominant-lethal mutations (~17%) for week 2, as do those of Ehling and Neuhäuser-Klaus for weeks 2 and 3 at doses ranging from 25 to 50 mg MNU/kg [15], but neither set of data shows clearly positive effects for other stages. The ENU littersize data for 50 mg/kg (Table 1) give no indication of induction of dominant lethals during the first three preconception weeks. The same is probably true for 100 mg ENU/kg, demonstrating a difference from the clear effects of MNU at the slightly lower-than-equimolar dose of 75 mg/kg.
ENU results for the longer intervals (i.e., exposure of pre-spermatid stages) are harder to interpret because significant germ-cell killing occurs during these times (see litters per mate in Table 1). At 250 mg ENU/kg, the highest dose in the present experiment, Generoso et al. found that the proportion of matings that were fertile was severely reduced during the third week, and was zero after the third week [22]. Following 160 mg ENU/kg, Favor et al. found the number of offspring to be reduced by over 90% after 3 weeks of sequential matings [14]. When their matings were continuous rather than sequential, however, even 250 mg ENU/kg allowed a significant number of offspring to be conceived after 3 weeks, suggesting that any conclusions as to germ-cell stages sampled with continuous matings may not be accurate. Such a regimen reduces the number of mating opportunities, and this may lead to some sperm storage.
3.2. Mutation frequency
Because mutations induced during the perigametic interval, i.e., from the last premeiotic to the first post-meiotic DNA synthesis, can produce visibly mosaic mutants in the specific-locus test [23,24], mosaics were included in calculations of mutation frequencies. Mutation yields in the ENU and MNU experiments are presented in Tables 2 and 3, respectively, for two scenarios, namely excluding or including the unproven mosaics. Because of the considerable uncertainty concerning unproven mosaics (see Section 2.4), the true frequencies are probably intermediate. The tables list experimental frequencies; to calculate induced mutation rates (see below), the spontaneous mutation rate, determined by the large Oak Ridge historical control, namely, 0.43 × 10⁻⁴ (i.e., 46 in 1,079,202) [23] was subtracted. During the first four mating weeks, the chemicals can be compared both at the equimolar doses (50 mg ENU/kg versus 44 mg MNU/kg) and at the roughly equimolar doses (100 mg ENU/kg versus 75 mg MNU/kg). (Note that calculations to extrapolate from 100 to the equimolar dose of 85.2 mg ENU/kg are probably legitimate since these doses lie within the straight portion of the dose curve [2].) Neither chemical yields overall higher frequencies than the other during this time, except for week-3 matings (sampling early spermatids), when MNU rates are higher than ENU rates (though not significantly so) in each of four possible comparisons (two scenarios for each of two doses). It is this same week-3 interval that yields the highest frequencies (among the four initial weeks) under both scenarios and all doses for each chemical, except for 50 mg ENU/kg; however, confidence intervals overlap broadly.
Table 2.
Mutation frequencies following exposure to ENU
| Exposure (mg/kg) | Weeka | Number of offspring | Specific-locus mutants
|
Dominant or X-linked mutationsb | ||
|---|---|---|---|---|---|---|
| Numberc | Frequencyd × 10−4 (90% confidence limits) | |||||
| 50 | 1 | 7767 | 1m? | 0 (0, 3.1)[1.3 (0.1, 5.8)] | 0 | |
| 2 | 8733 | 1 + 1m? | 1.1 (0.1, 5.2) [2.3 (0.6, 6.8)] | 0.6 (0.1, 2.6) [1.7 (0.6, 4.3)] | 0 | |
| 3 | 8840 | 1m? | 0 (0, 2.8) [1.1 (0.1, 5.1)] | 1 | ||
| 4 | 6338 | 1 + 1m? | 1.6 (0.2, 7.2) [3.2 (0.8, 9.4)] | 1 | ||
| 5a | 2706 | 0 | 0 (0, 9.0) | 1 + 1? | ||
| 5b | 5132 | 4 + 1m + 1m? | 9.7 (4.7, 18.9) [11.7 (4.7, 22.1)] | 0 | ||
| 6a | 2250 | 1 | 4.4 (0.5, 20.1) | 8.5 (4.4, 15.3) [11.0 (5.5, 18.6)] | 0 | |
| 6b | 836 | 1m + 1m? | 12.0 (1.3, 54.2) [23.9 (6.4, 71.5)] | 0 | ||
| 7 | 167 | 0 | 0 (0, 145.9) | 0 | ||
| 100 | 1 | 3583 | 1m + 1m? | 2.8 (0.3, 12.7) [5.6 (1.5, 16.7)] | 0 | |
| 2 | 4000 | 1 | 2.5 (0.3, 11.3) | 3.8 (1.4, 9.6 [6.4 (3.1, 12.4)] | 0 | |
| 3 | 3854 | 2 + 2m? | 5.2 (1.4, 15.5) [10.4 (4.5, 22.3)] | 3 | ||
| 4 | 1495 | 1m? | 0 (0, 16.3) [6.7 (0.7, 30.3)] | 0 | ||
| 250 | 1 | 1705 | 1m? | 0 (0, 14.3) [5.9 (0.6, 26.6)] | 1 | |
| 2 | 1916 | 1m | 5.2 (0.6, 23.7) | 5.8 (1.5, 17.3) | 0 | |
| 3 | 1547 | 1 | 6.5 (0.7, 29.3) | 1 | ||
Week 1 begins with the day of injection, designated day 1. Weeks 5a, 5b, 6a, 6b, designate, respectively, days 29-31, 32-35, 36-38, 39-42.
Of the eight proven dominants, six transmitted a small or medium white ventral spot, one carried an X-linked mottling (male-lethal) mutation, and one was mosaic for Eda (formerly, Ta). In addition, one proband (indicated by ?) with malformed forelegs died shortly after weaning and thus could not be tested.
Verified specific-locus mosaics are indicated by m; unproven mosaics by m?.
Experimental frequencies are shown. For induced frequencies, see text. Experimental frequencies calculated with inclusion of unproven mosaics are enclosed by square brackets. The second column indicates combined frequencies for Weeks 2 + 3, and for Weeks 5b + 6a + 6b.
Table 3.
Mutation frequencies following exposure to MNU
| Exposure (mg/kg) | Weeka | Number of offspring | Specific-locus mutants
|
Dominant or X-linked mutationsb | ||
|---|---|---|---|---|---|---|
| Numberc | Frequencyd × 10−4 (90% confidence limits) | |||||
| 44 | 1 | 4,300 | 0 | 0 (0, 5.7) | 1 | |
| 2 | 4,333 | 1 | 2.3 (0.2, 10.5) | 3.5 (1.3, 8.7) [4.6 (2.0, 10.0)] | 1 | |
| 3 | 4,291 | 1 + 1m + 1m? | 4.7 (1.2, 13.9) [7.0 (2.6, 17.5)] | 2 | ||
| 4 | 4,843 | 0 | 0 (0, 5.0) | 0 | ||
| 5 + 5a | 3,682 | 0 | 0 (0, 6.6) | 1 | ||
| 5b | 3,618 | 4 + 2m | 16.6 (6.7, 31.4) | 0 | ||
| 6 + 6a | 2,894 | 5 | 17.3 (8.4, 33.6) | 18.6 (12.3, 26.3) | 3 | |
| 6b | 3,720 | 7 + 1m | 21.5 (12.2, 36.4) | 2 | ||
| 7 | 5,174 | 1 | 1.9 (0.2, 8.8) | 0 | ||
| 75 | 1 | 1,868 | 0 | 0 (0, 13.0) | 0 | |
| 2 | 1,092 | 0 | 0 (0, 22.3) | 8.7 (2.3, 26.0) | 0 | |
| 3 | 1,210 | 2 | 16.5 (4.4, 49.4) | 0 | ||
| 4 | 2,319 | 1m? | 0 (0, 10.5) [4.3 (0.5, 19.5)] | 0 | ||
| 5 + 5a | 2,676 | 0 | 0 (0, 9.1) | 1 | ||
| 5b | 1,117 | 1 | 9.0 (0.9, 40.6) | 0 | ||
| 6 + 6a | 2,044 | 16 + 3m | 93.0 (61.3, 131.8) | 55.7 (38.7, 76.4) | 8 | |
| 6b | 788 | 2 | 25.4 (6.8, 75.8) | 0 | ||
| 7 | 2,945 | 1 | 3.4 (0.4 15.4) | 0 | ||
| >7 | 23,491 | 4e | 1.7 (0.7, 3.7) | 3 | ||
Week 1 begins with the day of injection, designated day 1. Weeks 5a, 5b, 6a, 6b, designate, respectively, days 29–31, 32–35, 36–38, 39–42. For the three replicates at 75 mg MNU/kg in which mating weeks 5 and 6 were not split into two portions (see Section 2.3), results for week 5 (i.e., days 29–35) have been combined with those for week 5a, and results for week 6 (i.e., days 36–42) have been combined with those for week 6a, because experience shows that when male mice are caged with females for a full week, most copulations occur during the first half of that week.
Of the 22 dominants, 11 transmitted a small or medium white ventral spot (plus kinky tail, in one case), 2 + 2? (i.e., not allelism-tested) carried alleles at Kit (formerly W), 3 carried alleles at Krt2-6g (formerly Ca), and 4 carried X-linked mottling, male-lethal mutations.
Verified specific-locus mosaics are indicated by m; unproven mosaics by m?.
Experimental frequencies are shown. For induced frequencies, see Section 3.2. Experimental frequencies calculated with inclusion of unproven mosaics are enclosed by square brackets. The second column indicates combined frequencies for Weeks 2 + 3, and for Weeks 5b + 6 + 6a + 6b.
In addition, a mosaic at Tyr, conceived >13 months postinjection, was presumably of spontaneous origin [23].
For weeks 5a–7, the patterns are similar for the two chemicals, both of which produce a sharp peak in mutation frequencies for conceptions occurring 32–42 days (i.e., weeks 5b–6b) postinjection, which sample exposed differentiating spermatogonia (DG) and preleptotene spermatocytes (PLC). For each group, the weeks 5b–6b peak frequency is significantly greater than the frequencies for the preceding 10 days (days 22–31, i.e., weeks 4 and 5a); thus, for each dose of MNU, P < 1 × 10⁻⁵, and for 50 mg ENU/kg, P < 0.03 (with or without inclusion of unproven mosaics). Peak frequencies are also significantly greater than the frequencies for the following week (week 7); for 44 mg MNU/kg, P = 0.03, and for 75 mg MNU/kg, P < 0.0001 (in the case of ENU, the week-7 data are insufficient for comparison). Following exposure of DG/PLC to 75 mg MNU/kg, the induced frequency (i.e., historical-control rate subtracted) is 79.0 × 10⁻⁵ per locus.
Comparing the chemicals during the DG/PLC period, the mutation frequency for 50 mg ENU/kg is less than one-half that for the equimolar dose of 44 mg MNU/kg when unproven mosaics are excluded (but the difference is not clearly significant: P = 0.051 one-tailed, P = 0.078 two-tailed). With inclusion of unproven mosaics, the frequencies approach each other, though the ENU yield remains lower overall. For each dose of MNU, the DG/PLC frequency is about five to six times greater than the frequency for all exposed spermatids (weeks 2 and 3), and three to four times greater than that for early spermatids (week 3 only). The differentials are greater for 50 mg ENU/kg, because the ENU spermatid rates are relatively lower. Experimental frequencies for MNU-induced specific-locus mutations are plotted in Fig. 1 for all stages, including SG.
Fig. 1.
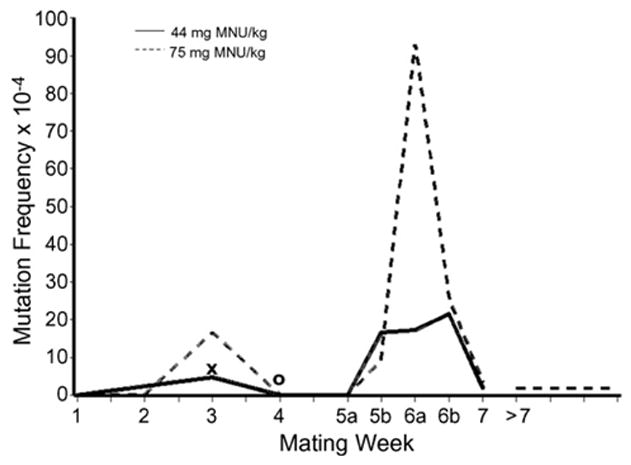
Experimental frequencies of specific-locus mutations recovered at various intervals following exposure of male mice to 44 or 75 mg methylnitrosourea (MNU)/kg. The germ-cell stages sampled range from stem-cell spermatogonia (mating weeks >7) through spermatozoa (mating week 1) (see Section 2.6). The frequencies include confirmed mosaic as well as whole-body mutants. The two values that also include unproven mosaics are indicated by ‘x’ (week 3) for 44 mg MNU/kg, and ‘o’ for 75 mg MNU/kg (week 4).
Specific-locus mutation frequencies induced in SG had earlier been extensively measured for ENU at a large variety of doses [1–3,13]. In the present experiment, the SG mutation rate following MNU exposure was measured at 75 mg/kg. For the 7 specific loci, this experimental frequency of 1.7 (0.7, 3.7) × 10−4 (Table 3) differs significantly (P = 0.02) from the Oak Ridge historical control rate of 0.43 × 10⁻⁴ [23]. It is, however, vastly lower than the SG frequency reported for 100 mg ENU/kg, namely, 30.5 (25.2, 36.3) × 10−4 [16], and low, even, when compared with the frequency at less-than-equimolar 50 mg ENU/kg, namely, 6.6 (3.9, 10.5) × 10−4 [2] (P = 0.015). (It may be noted that at 50 mg ENU/kg, the spermatogonial mutation rate lies below the straight-line portion of the dose curve, indicating that a repair process is active at that level, but is saturated at the higher doses tested [2,16].) When the historical control rate is subtracted, the mutation frequency induced by 75 mg MNU/kg in SG is found to be 1.82 × 10⁻⁵ per locus, as compared with 43.6 × 10⁻⁵ per locus induced by 100 mg ENU/kg [16]. Ehling and Neuhäuser-Klaus subsequently observed a similar induced rate of 2.6 × 10⁻⁵ per locus following 70 mg MNU/kg [15].
Fig. 2 compares peak-period (DG/PLC) frequencies for each chemical with like-dose SG frequencies (broad bars). For ENU at 50 mg/kg, the two frequencies are fairly similar. For, MNU, by contrast, there is a vast difference, the point estimate of the DG/PLC frequency being 32.8 times that of the SG frequency. Also shown (by narrower bars) are values for which no like-dose comparison between DG/PLC and SG frequencies can be made, namely, the SG rate for 100 mg ENU/kg (weeks 5b–6b data are not obtainable because of cell killing) and the DG/PLC rate for 44 mg MNU/kg (the SG rate was not determined at this dose). These frequencies are, however, instructive when compared with like stages exposed to the other dose and/or chemical. It may be noted that, while specific-locus experiments in two laboratories reveal a vast difference between DG/PLC and SG in their response to MNU [10,15, this experiment], a mutagenesis test in λlacZ transgenic mice was apparently not sensitive enough to show this difference [25].
Fig. 2.
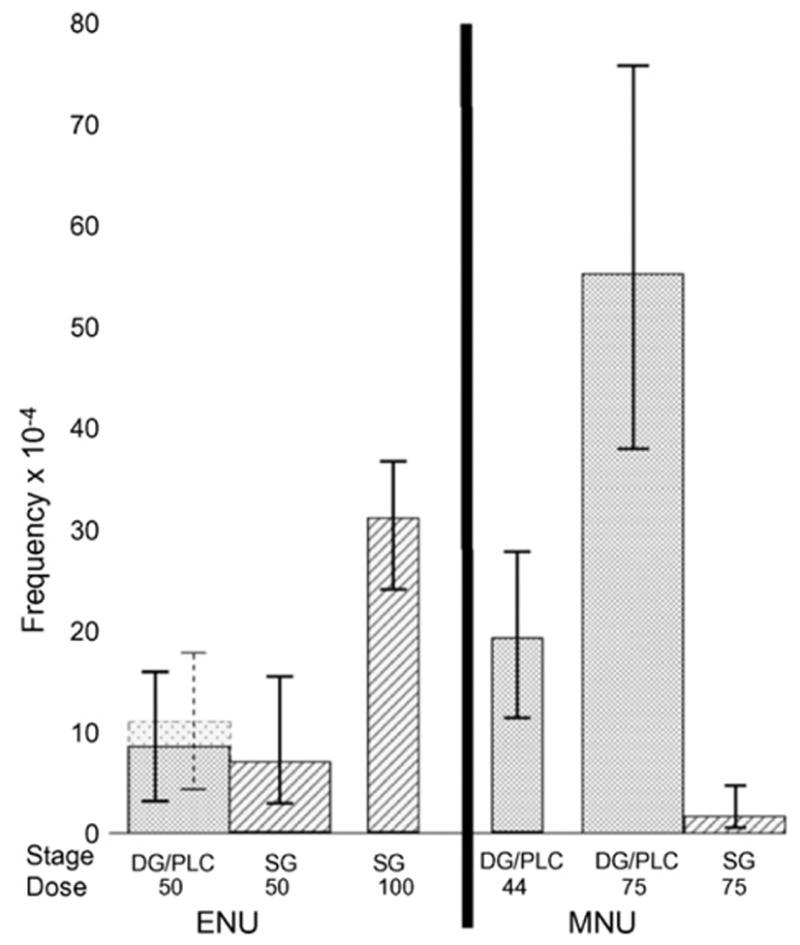
Comparison of the peak-period mutation frequency (exposed DG/PLC) with the stem-cell spermatogonia (SG) frequency for ENU (broad columns, left portion of diagram), and similar comparison for MNU (broad columns, right portion of diagram). The narrow columns represent frequencies for which no equal-dose comparisons can be made (DG/PLC: differentiating spermatogonia and preleptotene spermatocytes; SG: stem-cell spermatogonia). Error bars are 90% confidence limits. The broken lines for the 50 mg ENU/kg exposure of DG/PLC indicates frequencies calculated by including unproven mosaics.
In addition to mutations at the specific loci, Tables 2 and 3 record various dominant mutations. The latter have only limited value for quantitative comparisons, because detection of miscellaneous variants (unlike that of specific-locus mutations) is somewhat subjective, and the proportion of variants that are heritable differs with the phenotype, affecting the decisions about which variants to test genetically. (For example, out of 35 probands in the ENU experiments recorded as having small or medium white belly spots, only five turned out to transmit dominant mutations, and several probands with similar phenotypes therefore remained untested.) Nonetheless, the quantitative relations for miscellaneous dominants roughly parallel those for specific-locus mutations. Thus, the frequency of dominants for weeks 5b–6b is higher than that for exposed spermatids (weeks 2 and 3); for MNU (the two doses combined), the respective frequencies are 9.2 × 10⁻⁴ and 2.7 × 10⁻⁴. Additionally, the frequency of dominants for exposed SG is low, namely 1.3 × 10⁻⁴. A systematic study of congenital defects in late fetuses sired by MNU-treated male mice found that frequencies induced by exposures of early spermatids and of SG were similar; the weeks 5b–6b interval was not sampled [26].
3.3. Nature of the mutations
For ENU and MNU, respectively, Tables 4 and 5 show the distribution of mutations among the seven loci, as well as mutation type (right-hand columns). Only a few of the 67 specific-locus mutations observed in the present experiments were analyzed molecularly. Nevertheless, based on extensive genetic and molecular analyses (performed over the past two decades) of deletion complexes encompassing each of the specific-locus markers, and, subsequently, of induced and spontaneous alleles at these loci [27], certain conclusions about the nature of specific-locus mutations may be derived from their phenotypes. The phenotype of the null allele at each marker having been established, it is possible to conclude that any mutation that, in the homozygous state, has a phenotype additional to that of the ablated marker (e.g., a Tyr mutation that is lethal at any stage, or a Myo5a mutation that is a prenatal, rather than juvenile, lethal) involves genetic alterations outside the marked locus. We have classified such alleles as “large lesions”, abbreviated LL, and the remainder as “other lesions”, abbreviated OL.
Table 4.
Distribution of specific-locus mutations from ENU experiments among loci and mutation types
| Exposure(mg/kg) | Week | Locusa |
Mutation typeb |
||||||||
|---|---|---|---|---|---|---|---|---|---|---|---|
| a | Tyrp1 | Tyr | p | Myo5a | Bmp | Ednrb | LL | OLc | ? | ||
| 50 | 1 | ||||||||||
| 2 | 1 | 1? | |||||||||
| 3 | |||||||||||
| 4 | 1 | 1 | |||||||||
| 5a | |||||||||||
| 5b | 1 | 1 | 1 + 1m | 1 | 5 (3) | ||||||
| 6a | 1 | 1 | |||||||||
| 6b | 1m | 1 (Tyrp1) | |||||||||
| 7 | |||||||||||
| 100 | 1 | 1m | 1 | ||||||||
| 2 | 1 | 1 | |||||||||
| 3 | 1 | 1 | 2 (2) | ||||||||
| 4 | |||||||||||
| 250 | 1 | ||||||||||
| 2 | 1m | 1 (1?) | |||||||||
| 3 | 1 | 1 | |||||||||
| All doses | All intervals | 3 + 1m | 2 + 1m | 2 + 1m | 3 + 1m | 1 | 1 + 1? | 12 (5 + 1?) | 1 | ||
“m” indicates gonosomic mosaics (detection of mosaics at Bmp and Ednrb would be difficult if not impossible). In addition, 12 probands for all doses combined with possibly mutant sectors of fur could not be shown to transmit a specific-locus mutation (see text). They are shown as “unproven” mosaics, m?, in Table 2.
LL: large lesions; OL: other lesions, see text; ?: unknown because homozygotes were not generated (the locus is indicated).
The number of OL mutants that were hypomorphs is shown in parentheses.
Table 5.
Distribution of specific-locus mutations from MNU experiments among loci and mutation types
| Exposure(mg/kg) | Week | Locusa |
Mutation typeb |
||||||||
|---|---|---|---|---|---|---|---|---|---|---|---|
| a | Tyrp1 | Tyr | p | Myo5a | Bmp | Ednrb | LL | OLc | ?d | ||
| 44 | 1 | ||||||||||
| 2 | 1 | 1 (0) | |||||||||
| 3 | 1m | 1 | 1? | 1 (p) | |||||||
| 4 | |||||||||||
| 5 + 5a | |||||||||||
| 5b | 2 + 2m | 1 | 1 | 4 (2) | 2 (2Tyrp1) | ||||||
| 6 + 6a | 1 | 2 | 1 | 1 | 5 (2) | ||||||
| 6b | 2 + 1m | 1 | 2 | 1 | 1 | 7 (3) | 1 (Tyrp1) | ||||
| 7 | 1 | 1 (0) | |||||||||
| 75 | 1 | ||||||||||
| 2 | |||||||||||
| 3 | 2 | 2 | |||||||||
| 4 | |||||||||||
| 5 + 5a | |||||||||||
| 5b | 1 | 1 (1) | |||||||||
| 6 + 6a | 3 | 2 | 2 | 4 + 1m | 4 + 2m | 1 | 18 (9) | 1 (Myo5a) | |||
| 6b | 2 | 2 (0) | |||||||||
| 7 | 1 | 1 (0) | |||||||||
| >7 | 2 | 1 | 1 | 4 (2) | |||||||
| All doses | All intervals | 4 | 10 + 3m | 7 | 13 + 2m | 6 + 2m | 2 | 3 | 2 + 1? | 44 (19) | 5 |
“m” indicates gonosomic mosaics (detection of mosaics at Bmp and Ednrb would be difficult if not impossible). In addition, 2 probands (44 mg MNU/kg group, week 3; 75 mg MNU/kg, week 4) with possibly mutant sectors of fur could not be shown to transmit a specific-locus mutation (see “unproven” mosaics, m?, in Table 3).
LL: large lesions; OL: other lesions, see text; ?: unknown because homozygotes were not generated (the locus is indicated).
The number of OL mutants that were hypomorphs is shown in parentheses.
All were mosaics. The locus is indicated.
In all the experiments (ENU and MNU at all doses), there were only three verified LL mutations, all of them derived from conceptions in week 3 (early spermatids); two were prenatally lethal mutations at p, with the extent of each multilocus deletion characterized molecularly, and the third was a prenatally lethal mutation at Ednrb. Two other mutants (at Ednrb in week 3, and at Myo5a in week 2) were classified as LL? on the basis of the early death of the heterozygote. Thus, among 11 classifiable mutations resulting from exposure occurring after the meiotic metaphase (weeks 1–3), there were five presumed large lesions (three of them verified). By contrast, there were no LLs or LLs? among 43 classifiable mutations conceived 32–42 days postinjection, the peak-frequency period (P < 0.00001).
Of 62 mutants that were not LL or LL?, 6 (all of them mosaics) could not be classified because they were not bred to the homozygous state. For most of the remaining 56, classified OL, there is considerable evidence that the lesion was intragenic and/or very small. Five of the mutations (all but one of them induced by MNU) were molecularly analyzed. At a, a hypomorph was a G → A transition [8] and a null was a 2.8 kb intragenic deletion [28]. At Bmp5, a null was an intragenic deletion of 10 base pairs [4]. At Myo5a, one hypomorph was a C → T transition, and another (ENU induced) was a C → G transversion [6].
Roughly one-half of the mutants classified OL were viable hypomorphs, which may be assumed to have resulted from mutations within the marker gene. The remainder had the null phenotype at the respective locus (see Table 3 in Ref. [27]) with regard to appearance and viability of homozygotes (namely, fully viable in the case of five of the loci, juvenile lethal in the case of Myo5a and Ednrb). An extensive literature on molecular characterization of the marker genes and their immediately flanking chromosomal regions (e.g., [8,29,30,6,7,4,31,32]) supports the conclusion that most, if not all, mutations classified OL in the present experiments did not involve lesions outside the marked loci. In past investigations, cases where such a conclusion did not always hold involved radiation-induced nulls, e.g., at Tyr [30] and Bmp5 [33].
4. Discussion
The mutagenesis experiments with ENU and MNU here reported have made it possible to compare the effects of these two closely related chemicals at equimolar and near-equimolar doses for a number of different endpoints studied in the same strains of mice in the same laboratory. The biological responses are found to vary in a complex manner, with the relative effectiveness differing in opposite directions for different endpoints (Table 6). MNU is more toxic to the exposed males, but ENU causes considerably more germ-cell killing, as indicated both by the present fertility results and by histological studies [21] in the same strain. The results are most intriguing when ENU and MNU are compared with regard to specific-locus mutation frequencies induced in different male germ-cell stages. There is a vast difference between the chemicals in mutation yield from exposed SG, ENU being more than an order of magnitude more mutagenic than MNU. But there is relatively little difference for the mutation yield from exposed DG and PLC, cell stages that are highly sensitive to both chemicals; if a difference exists, it is in the direction opposite to that for SG.
Table 6.
Comparisons of effectiveness of ENU and MNU
| Observation | MNU > ENU | ENU > MNU | Referencesa |
|---|---|---|---|
| Specific-locus mutations | |||
| Stem-cell spermatogonia | ++ | TP | |
| Differentiating spermatogonia; preleptotene | (+)b | TP | |
| Pachytene through sperm | + | TP, [25] | |
| Proportion of postspermatogonial mutations that are mosaics | + | TP | |
| Melanocyte precursor cells | + | [34] | |
| Other mutational endpoints | |||
| Dominant visible mutations | + | TP | |
| Dominant lethals | + | [22,41] | |
| Translocations | ++ | [22,41] | |
| Repair indicators | |||
| Unscheduled DNA synthesis in male germ cells | + | [43] | |
| Repair (of dominant lethals) in fertilized egg | + | [42] | |
| Toxicity to | |||
| Exposed males | + | TP | |
| Mid-term embryos | ++ | [34] | |
| Melanocyte precursor cells | + | ||
| Spermatogonial stemcells | + | TP | |
| Postspermatogonial germ cells | + | TP | |
| Teratogenicity | + | [34] | |
TP: this paper.
Parentheses indicate that the difference was not statistically significant.
The post-SG stages at which mutation rate peaks for both chemicals (but especially for MNU) include the time of the last premeiotic DNA synthesis (probably preleptotene), as well as more than a week prior to this. The gene-mutation frequency induced by 75 mg MNU/kg during this peak interval is, to date, the highest induced by any single-exposure mutagenic treatment – chemical or radiation – that allows survival of the exposed animal and its germ cells. Assuming about 30,000 potentially mutable genes per genome, and an average per-locus rate that is half that for the seven specific loci (some of which may be more mutable than most genes), exposure of DG and PLC to 75 mg MNU/kg would yield more than 10 new mutations per genome. For purposes of maximizing mutation production, this is not, however, the most practical regimen, mainly because the sensitive period lasts only 10 days or less. ENU, by contrast, when administered to SG, will yield mutations during the entire reproductive lifetime of the male. Further, because mutations accumulate in SG, it is possible to administer a series of treatments with additive effects. An optimum regimen has been developed [3], whereby 3 weekly doses of 100 mg ENU/kg can produce a frequency of 87.5 × 10⁻⁴ (or 125.0 × 10⁻⁵ per locus), i.e., more than half again as high as that produced by 75 mg MNU/kg in the most sensitive stages.
Mutagenesis comparisons between ENU and MNU can be expanded to somatic cells (Table 6), where mutation induction in some of the same loci has been studied by means of the “spot test” [34]. This test involved injection of C57BL/Rl females made pregnant by T-stock males, and observation of the resultant offspring that had been exposed in utero. These offspring are heterozygous at six of the seven loci of the specific-locus test, and a somatic mutation at any of four of these (all except Ednrb and Bmp5) is scored as a “recessive spot”. MNU was more toxic than ENU to the injected animals (paralleling results of the present experiment) and to melanocyte precursors of the developing embryo (as revealed by relative frequencies of “white midventral spots”). It was so much more effective than ENU at killing the exposed embryos that equimolar doses could not practicably be compared for mutagenesis; 7.5 mg MNU/kg killed most embryos, while even 100 mg ENU/kg decreased survival only slightly. With regard to induced teratogenicity, also, MNU surpassed ENU. The per-locus frequency of specific-locus mutations induced by ENU in melanocyte precursor cells was quite similar to the high frequency induced in SG. MNU, however, was probably (extrapolating to equimolar doses) even more effective than ENU in inducing somatic mutations at specific loci, thus paralleling the relative mutagenicities of the two chemicals in stages subsequent to SG.
The germ-cell data reported in this paper permit comparisons not only of the frequency, but of the nature of the specific-locus mutations. With regard to the size of mutational lesions, the determining factor appears to be the germ-cell stage, rather than the chemical, confirming earlier findings for various mutagens [35,27,36]. There is considerable evidence that the numerous mutations induced by either ENU or MNU during the stages of peak sensitivity, i.e., recovered in offspring sired 32–42 days after exposure, are intragenic or, at least, do not extend far, if at all, beyond the boundaries of the marked locus. Of five that were analyzed molecularly, three were single base-pair changes, and two were intragenic deletions (10 base pairs and 2.8 kb). By contrast, almost half of the mutations induced subsequent to meiotic metaphase are identifiable as multilocus deletions or other large genetic changes. Of five of these large lesions (LLs), four were induced in early spermatids, one in mid or late spermatids.
Mutations induced in SG have for some time been known to be small lesions when the mutagen is ENU. Thus, 32 specific-locus mutants (from earlier experiments) that met the phenotypic criteria for OL (see Section 3.3) have been analyzed molecularly. Sequencing revealed 27 of them, at four loci, to be single base-pair changes, with no evidence for large lesions in the remaining 5 [5 (review),8]. In λlacZ transgenic mice, none of 31 mutations induced by ENU in spermatogonia was found to be a deletion or insertion, even though the test is capable of detecting such changes up to 550 bp [20]. The present experiment generated SG mutations induced by MNU. While the number was small, all four of them met OL criteria. The same was true of six MNU-induced SG mutations reported in Ref. [15]. (Note: Although one of the six, at Myo5a, was considered a possible exception, independent molecular information for that locus is consistent with an OL classification.)
For mutations induced by ENU in post-SG stages, distribution among the marked loci (though not overly meaningful for a total number of only 15) is not dissimilar from the distribution found in the past for ENU-treated SG [27]. In the latter, only 9.4% of 382 mutations were at a or Bmp5. The same percentage would have yielded only 1.4 mutations at these two loci among the 15 post-SG ENU mutants of the present experiment—not meaningfully different from their actual absence. The spectrum for the 52 MNU mutants of the present experiment generally resembles that compiled earlier for all chemical mutagenesis in SG. Such a spectrum would be expected for point mutations since, as noted earlier [27], the three loci represented in the smallest proportions among mutations (a, Bmp5, and Ednrb) encompass the shortest lengths of coding sequence. By contrast, a good correlation with coding-region length is not expected for multi-locus deletions and other large lesions, which almost always have breakpoints located outside the marker locus. It should, however, be noted that for Bmp5 and Ednrb the lengths are not as much shorter as might be expected from the ratio between the mutation rates at these loci and those at higher-frequency loci. Additionally, it is known that a few ENU mutations are not located in coding regions [33,8].
The ENU and MNU mutations that were definite or probable large lesions (LLs), though small in number, indicate a different locus-spectrum. Of the five, two were at the Ednrb locus, a proportion characteristic of large-lesion inducers, such as radiations [27]. All of the five were induced in spermatids (see above), again confirming that the action of chemical mutagens is determined by germ-cell stage.
About 60–70% of ENU alkylations are found as ethyl phosphotriesters [37]. Of base alkylations, the most significant pre-mutagenic lesions induced by ENU are O6-ethylguanine, O2-ethylthymine, and O4-ethylthymine. The first of these adducts is, however, readily repaired by O6-alkylguanine transferase [38] and by nucleotide excision repair, while the other two types of adducts have been reported not to be removed by either mechanism [20]. This leads to the greater proportion of mutations in A–T than G–C base pairs that has been reported for ENU-induced SG mutations recovered in the specific-locus test [4,5,8] or in transgenic mice, both λlacZ [20] and λlacI [39].
Regrettably, there has been little molecular analysis of MNU-induced specific-locus mutations in the mouse. MNU produces relatively little alkylation of the phosphate backbone [37]. In bases, MNU, like ENU, is known to induce adducts at the O2 and O4 positions of thymine, as well as O6-methylguanine which, in contrast to O4-methylthymine, is efficiently repaired [40]. For MNU, the primary alkylation site is the N7 of guanine, as is the case for the postspermatogonial mutagens EMS and MMS (ethyl and methylmethanesulfonate). This has led van Delft et al. to suggest that alkylation of the O2 and O4 positions of thymine may be critical for SG mutagenesis, since EMS and MMS which do not induce adducts at these positions, are not mutagenic in SG, while N7 alkylguanine appears critical for post-SG mutagenesis [25]. The two MNU mutations from the present experiment that were changes in C–G base pairs were both induced during the DG/PLC interval.
It is during post-SG stages (primarily sperm and spermatids) that chemicals induce gross chromosomal damage that can result in dominant lethals and heritable translocations. MNU has been found to be more effective than ENU in inducing dominant lethals (Table 6); in sensitive mid and late spermatid stages, equivalent frequencies are produced by 250 mg ENU/kg and 75 mg MNU/kg [22]. The differential becomes even greater for heritable translocations, which, at these relative doses, are induced seven times more frequently by MNU than by ENU [22,41]. Generoso has suggested that alkylations located primarily at the N7-guanine position are characteristic of the group of chemicals (including MNU) that are effective translocation inducers [22]. N7-alkyl guanine adducts are not stable, and their loss via hydrolysis results in apurinic sites. Generoso et al. reported that the ability of the fertilized egg to repair premutational lesions introduced by the sperm is greater for ENU- than for MNU-induced lesions, and they suggested that it is the more stable alkylation products, involving base oxygens, that are repaired in the egg [42]. Repair occurring in male germ cells has been detected by unscheduled DNA synthesis (UDS). Following exposures to ENU or MNU, the UDS response was found to be greater for MNU for all exposure stages studied [43]. Unfortunately, the histological criteria used were unable to distinguish between SG (As) and early DG (types A1–A3); it is at this juncture that the present experiments have indicated a drastic change in mutation yield following MNU treatment.
In the present experiments, both ENU and MNU treatments of post-SG stages yielded significant numbers of mutants that were recovered as mosaics. The proportion was higher for ENU than for MNU, namely, 27% (4/15) versus 15% (7/48), respectively, if unproven mosaics are excluded (P = 0.3); 58% (15/26) versus 18% (9/50), respectively, if they are included (P = 0.0004). Although the MNU frequency of mosaics is lower than the ENU frequency, it is significantly higher than the historical spontaneous rate [23]: P = 0.001 or 0.002 if unproven mosaics are excluded or included, respectively. A higher proportion of ENU- than MNU-induced mosaics has also been reported from Neuherberg [14,15]. In zebrafish, specific-locus point mutations induced by ENU are readily recovered as mosaics [44]. ENU has also been found to yield mosaic recessive-lethal mutants in Drosophila melanogaster when postspermatogonial stages (specifically, sperm) are exposed, but not when spermatogonia are exposed, as expected (since several rounds of DNA replication occur following induction of the premutagenic lesion) [45]. Regrettably, germ-cell mutation information for ENU and MNU that is derived from transgenic mice [25] does not provide information on mosaicism.
The finding of a high proportion of mosaic mutants suggests that unfixed single-strand lesions persist unrepaired until the first postmeiotic division, namely the pronuclear DNA synthesis in the zygote. Indeed, ENU exposure of pre-synthesis zygotes yields primarily mosaic specific-locus mutants [46]. In the present experiment, several of the mosaics were recovered from exposures during the peak-sensitive period and some may, therefore, have resulted from premutagenic lesions induced prior to the last premeiotic DNA synthesis. If not, they would have had to have remained unrepaired for 5 or 6 weeks. The fact that the relative rate of mosaic recovery is clearly lower for MNU than for ENU may be due to formation of less stable adducts by MNU.
In the complex pattern of relative effectiveness of MNU and ENU summarized in Table 6, the most striking exceptions from the generally greater effectiveness of MNU pertain to SG, both for specific-locus mutagenesis and cell killing. That these two endpoints do not result from the same mechanism(s) is apparent from comparisons between radiation and ENU; thus, 6 Gy X-rays and 100 mg ENU/mg cause sterile periods of equivalent lengths [21], while three times as many mutations are recovered following the ENU treatment. In the present experiments, MNU killed few if any germ cells during an interval when it was producing a vast number of mutations; and the greater germ-cell-killing capability of ENU pertained to post-SG stages, as well as to spermatogonia. With regard to mutagenesis in post-SG stages, ENU and MNU may share certain basic action properties that cause both chemicals (unlike over a dozen others) to produce peak yields from exposure of DG (and PLC). But in SG, certain differences in basic actions cause the mutation frequency induced by ENU to be 23 times that induced by a roughly equimolar dose of MNU. Another way of looking at it may be that ENU yields similarly high mutation frequencies from DG and SG, whereas the differential for MNU is huge (the SG rate being only 3% of the DG rate) (Table 3 and Fig. 2). Perhaps the answer may be sought in the different properties of SG and DG; SG are slow cycling, with consequently long interphases between mitotic divisions, while DG are in a rapid state of differentiation followed by the premeiotic DNA synthesis.
From the point of view of human mutagenic risk, stem-cell spermatogonia (SG), in which mutations persist throughout the entire reproductive lifespan, are almost infinitely more significant than are differentiating spermatogonia (DG) and subsequent stages, all of which are of relatively short duration. This consideration makes ENU a potentially much more hazardous mutagen than MNU, despite the super-mutagenicity of the latter in DG/PLC. Mosaic mutants that frequently result from certain ENU treatments may be expected to cause less phenotypic damage (and lower transmission rates) than do whole-body mutants; however, mosaics are recovered only from treatments received in post-SG stages, thus not alleviating the general mutagenic hazard from ENU.
Acknowledgments
We are grateful to the following who ably assisted in carrying out the experiments here described: J.W. Bangham, D.A. Carpenter, S.C. Maddux, K.F. Stelzner, C.S. Montgomery, E.L. Phipps, L.B. Cunningham, and S. Hitotsumachi. We thank Dr. Dabney K. Johnson for support and advice during the writing of this paper, and Drs. D.K. Johnson and E.J. Michaud III for their critical reading of the manuscript. The research herein described was supported by the US Department of Energy under contract W-7405-eng-26 with the Union Carbide Corporation, and by the National Institute of Environmental Health Sciences under Interagency Agreement DOE No. 40-1128-80, NIEHS No. 222Y01-ES-10067. Analysis of data and writing was supported by the Office of Biological and Environmental Research, US Department of Energy, at the Oak Ridge National Laboratory operated by UT-Battelle, LLC, under contract DE-AC05-00OR22725.
Footnotes
This paper is dedicated to Tony Carrano, a fine scientist with whom we had numerous productive interactions at meetings over the years. Because Bill – now dead 3 years – as well as I, greatly admired Tony, I thought it appropriate to base this paper on research that was truly Bill’s. Thus, this dedication comes from him as well as from me.
References
- 1.Russell WL, Kelly EM, Hunsicker PR, Bangham JW, Maddux SC, Phipps EL. Specific-locus test shows ethylnitrosourea to be the most potent mutagen in the mouse. Proc Natl Acad Sci USA. 1979;76:5818–5819. doi: 10.1073/pnas.76.11.5818. [DOI] [PMC free article] [PubMed] [Google Scholar]
- 2.Russell WL, Hunsicker PR, Raymer GD, Steele MH, Stelzner KF, Thompson HM. Dose–response curve for ethylnitrosourea-induced specific-locus mutations in mouse spermatogonia. Proc Natl Acad Sci USA. 1982;79:3589–3591. doi: 10.1073/pnas.79.11.3589. [DOI] [PMC free article] [PubMed] [Google Scholar]
- 3.Hitotsumachi S, Carpenter DA, Russell WL. Dose-repetition increases the mutagenic effectiveness of N-ethyl-N-nitrosourea in mouse spermatogonia. Proc Natl Acad Sci USA. 1985;82:6619–6621. doi: 10.1073/pnas.82.19.6619. [DOI] [PMC free article] [PubMed] [Google Scholar]
- 4.Marker PC, Seung K, Bland AE, Russell LB, Kingsley DM. Spectrum of Bmp5 mutations from germ-line mutagenesis experiments in mice. Genetics. 1997;145:435–443. doi: 10.1093/genetics/145.2.435. [DOI] [PMC free article] [PubMed] [Google Scholar]
- 5.Favor J. Mechanisms of mutation induction in germ cells of the mouse as assessed by the specific locus test. Mutat Res. 1999;428:227–236. doi: 10.1016/s1383-5742(99)00050-2. [DOI] [PubMed] [Google Scholar]
- 6.Huang JD, Cope MJTV, Mermall V, Strobel MC, Kendrick-Jones J, Russell LB, Mooseker MS, Copeland NG, Jenkins NA. Molecular genetic dissection of unconventional myosin-VA: head region mutations. Genetics. 1998;148:1951–1961. doi: 10.1093/genetics/148.4.1951. [DOI] [PMC free article] [PubMed] [Google Scholar]
- 7.Huang JD, Mermall V, Strobel MC, Russell LB, Mooseker MS, Copeland NG, Jenkins NA. Molecular genetic dissection of unconventional myosin-VA: tail region mutations. Genetics. 1998;148:1963–1972. doi: 10.1093/genetics/148.4.1963. [DOI] [PMC free article] [PubMed] [Google Scholar]
- 8.Miltenberger RJ, Wakamatsu K, Ito S, Woychik RP, Russell LB, Michaud EJ. Molecular and phenotypic analysis of 25 recessive, homozygous-viable alleles at the mouse agouti locus. Genetics. 2002;160:659–674. doi: 10.1093/genetics/160.2.659. [DOI] [PMC free article] [PubMed] [Google Scholar]
- 9.Justice M. From the atomic age to the genome project. Genetica. 2004;122:3–7. doi: 10.1007/s10709-004-1440-x. [DOI] [PubMed] [Google Scholar]
- 10.Russell WL, Hunsicker PR. Extreme sensitivity of one particular germ-cell stage in male mice to induction of specific-locus mutations by methylnitrosourea. Environ Mutagen. 1983;5:498. [Google Scholar]
- 11.Russell WL. Factors affecting mutagenicity of ethylnitrosourea in the mouse specific-locus test and their bearing on risk estimation. In: Sugimura T, Kondo S, Takebe K, editors. Environmental Mutagens and Carcinogens. University Tokyo Press/Alan R. Liss Inc; Tokyo, New York: 1982. pp. 59–70. [Google Scholar]
- 12.Russell WL, Hunsicker PR. Mutagenic effect of ethylnitrosourea (ENU) on poststem-cell stages in male mice. Environ Mutagen. 1984;6:390. [Google Scholar]
- 13.Favor J, Sund M, Neuhäuser-Klaus A, Ehling UH. A dose–response analysis of ethylnitrosourea-induced recessive specific-locus mutations in treated spermatogonia of the mouse. Mutat Res. 1990;231:47–54. doi: 10.1016/0027-5107(90)90175-4. [DOI] [PubMed] [Google Scholar]
- 14.Favor J, Neuhäuser-Klaus A, Ehling UH. The frequency of dominant ctaract and recessive specific-locus mutation mosaics in F1 mice derived from port-spermatogonial treatment with ethyl-nitrosourea. Mutat Res. 1990;229:105–114. doi: 10.1016/0027-5107(90)90084-h. [DOI] [PubMed] [Google Scholar]
- 15.Ehling UH, Neuhäuser-Klaus A. Induction of specific-locus and dominant lethal mutations in male mice by 1-methyl-1-nitrosourea (MNU) Mutat Res. 1991;250:447–456. doi: 10.1016/0027-5107(91)90201-x. [DOI] [PubMed] [Google Scholar]
- 16.Russell WL, Hunsicker PR, Carpenter DA, Cornett CV, Guinn GM. Effect of dose fractionation on the ethylnitrosourea induction of specific-locus mutations in mouse spermatogonia. Proc Natl Acad Sci USA. 1982;79:3592–3593. doi: 10.1073/pnas.79.11.3592. [DOI] [PMC free article] [PubMed] [Google Scholar]
- 17.Russell WL. X-ray-induced mutations in mice. Cold Spring Harbor Symp Quant Biol. 1951;16:327–336. doi: 10.1101/sqb.1951.016.01.024. [DOI] [PubMed] [Google Scholar]
- 18.Crow EL, Gardner RS. Confidence intervals for the expectation of a Poisson variable. Biometrika. 1959;46:441–453. [Google Scholar]
- 19.Oakberg EF. Germ cell toxicity: significance in genetic and fertility effects of radiation and chemicals. Environ Sci Res. 1984;31:549–590. [Google Scholar]
- 20.Douglas GR, Jiao J, Gingerich JD, Gossen JA, Soper LM. Temporal and molecular characteristics of mutations induced by ethylnitrosourea in germ cells isolated from seminiferous tubules and in spermatozoa of lacZ transgenic mice. Proc Natl Acad Sci USA. 1995;92:7485–7489. doi: 10.1073/pnas.92.16.7485. [DOI] [PMC free article] [PubMed] [Google Scholar]
- 21.Oakberg EF, Crosthwait CD. The effect of ethyl-, methyl-, and hydroxyethyl-nitrosourea on the mouse testis. Mutat Res. 1983;108:337–344. doi: 10.1016/0027-5107(83)90130-6. [DOI] [PubMed] [Google Scholar]
- 22.Generoso WM, Cain KT, Cornett CC, Cacheiro NLA. DNA target sites associated with chemical induction of dominant-lethal mutations and heritable translocations in mice. In: Chopra VL, Joshi BC, Sharma RP, Bansal HC, editors. Frontiers in Genetics. Vol. 1. Oxford and IBH Publishing Co; New Delhi: 1984. pp. 347–356. [Google Scholar]
- 23.Russell LB, Russell WL. Spontaneous mutations recovered as mosaics in the mouse specific-locus test. Proc Natl Acad Sci USA. 1996;93:13072–13077. doi: 10.1073/pnas.93.23.13072. brief correction added in Proc. Natl. Acad. Sci. U.S.A. 94 (1997) 4233. [DOI] [PMC free article] [PubMed] [Google Scholar]
- 24.Russell LB. Significance of the perigametic interval as a major source of spontaneous mutations that result in mosaics. Environ Mol Mutagen. 1999;34:16–23. doi: 10.1002/(sici)1098-2280(1999)34:1<16::aid-em3>3.0.co;2-x. [DOI] [PubMed] [Google Scholar]
- 25.van Delft JHM, Bergmans A, Baan RA. Germ-cell mutagenesis in llacZ transgenic mice treated with ethylating and methylating agents: comparison with specific-locus test. Mutat Res. 1997;388:165–173. doi: 10.1016/s1383-5718(96)00113-1. [DOI] [PubMed] [Google Scholar]
- 26.Nagao T. Frequency of congenital defects and dominant lethals in the offspring of mice treated with methylnitrosourea. Mutat Res. 1987;177:171–178. doi: 10.1016/0027-5107(87)90032-7. [DOI] [PubMed] [Google Scholar]
- 27.Russell LB. Effects of male germ-cell stage on the frequency, nature, and spectrum of induced specific-locus mutations in the mouse. Genetica. 2004;122:25–36. doi: 10.1007/s10709-004-1443-7. [DOI] [PubMed] [Google Scholar]
- 28.Bultman S, Russell LB, Gutierrez-Espeleta GA, Woychik RP. Molecular characterization of a region of DNA associated with mutations at the agouti locus in the mouse. Proc Natl Acad Sci USA. 1991;88:8062–8066. doi: 10.1073/pnas.88.18.8062. [DOI] [PMC free article] [PubMed] [Google Scholar]
- 29.Smyth IM, Wilming L, et al. Genomic anatomy of the Tyrp1 (brown) deletion complex. Proc Natl Acad Sci USA. 2006;103:3704–3709. doi: 10.1073/pnas.0600199103. [DOI] [PMC free article] [PubMed] [Google Scholar]
- 30.Rinchik EM, Stoye JP, Frankel WN, Coffin J, Kwon BS, Russell LB. Molecular analysis of viable spontaneous and radiation-induced albino (c)-locus mutations in the mouse. Mutat Res. 1993;286:199–207. doi: 10.1016/0027-5107(93)90184-h. [DOI] [PubMed] [Google Scholar]
- 31.Johnson DK, Stubbs LJ, Culiat CT, Montgomery CS, Russell LB, Rinchik EM. Molecular analysis of 36 mutations at the mouse pink-eyed dilution (p) locus. Genetics. 1995;141:1563–1571. doi: 10.1093/genetics/141.4.1563. [DOI] [PMC free article] [PubMed] [Google Scholar]
- 32.Roix JJ, Hagge-Greenberg A, Bissonnette DM, Rodick S, Russell LB, O’Brien TP. Molecular and functional mapping of the piebald deletion complex on mouse chromosome 14. Genetics. 2001;157:803–815. doi: 10.1093/genetics/157.2.803. [DOI] [PMC free article] [PubMed] [Google Scholar]
- 33.DiLeone RJ, Russell LB, Kingsley DM. An extensive 3′ regulatory region controls expression of Bmp5 in specific anatomical structures of the mouse embryo. Genetics. 1998;148:401–408. doi: 10.1093/genetics/148.1.401. [DOI] [PMC free article] [PubMed] [Google Scholar]
- 34.Russell LB, Montgomery CS. Supermutagenicity of ethylnitrosourea in the mouse spot test; comparisons with methyl-nitrosourea and ethylnitrosourethane. Mutat Res. 1982;92:193–204. doi: 10.1016/0027-5107(82)90223-8. [DOI] [PubMed] [Google Scholar]
- 35.Russell LB, Russell WL, Rinchik EM, Hunsicker PR. Factors affecting the nature of induced mutations. In: Allen JW, Bridges BA, Lyon MF, Moses MJ, Russell LB, editors. Banbury Report 34: Biology of Mammalian Germ Cell Mutagenesis. Cold Spring Harbor Laboratory Press; Cold Spring Harbor, NY: 1990. pp. 271–289. [Google Scholar]
- 36.Russell LB, Rinchik EM. Structural differences between specific-locus mutations induced by different exposure regimes in mouse spermatogonial stem cells. Mutat Res. 1993;288:187–195. doi: 10.1016/0027-5107(93)90084-s. [DOI] [PubMed] [Google Scholar]
- 37.Singer B. Mutagenesis from a chemical perspective: nucleic acid reactions, repair, translation, and transcription. In: Lemontt JF, Generoso WM, editors. Basic Life Sciences, Molecular and Cellular Mechanisms of Mutagenesis. Vol. 20. Plenum Press; New York: 1982. pp. 1–42. [DOI] [PubMed] [Google Scholar]
- 38.Yarosh DB. The role of O6-methylguanine–DNA methyltransferase in cell survival, mutagenesis and carcinogenesis (review) Mutat Res. 1985;145:1–16. doi: 10.1016/0167-8817(85)90034-3. [DOI] [PubMed] [Google Scholar]
- 39.Provost GC, Short JM. Characterization of mutations induced by ethylnitrososurea in seminiferous tubule germ cells of transgenic B6C3FI mice. Proc Natl Acad Sci USA. 1994;91:6564–6568. doi: 10.1073/pnas.91.14.6564. [DOI] [PMC free article] [PubMed] [Google Scholar]
- 40.Nivard MJ, Pastink A, Vogel EW. Mutational spectra induced under distinct excision repair conditions by the three methylating agents N-methyl-N-nitrosourea, N-methyl-N′-nitro-N-nitrosoguanidine, and N-nitrosodimethylamine in postmeiotic male germ cells of Drosophila. Mutat Res. 1996;10:97–115. doi: 10.1016/0027-5107(96)00011-5. [DOI] [PubMed] [Google Scholar]
- 41.Generoso WM. Relationship between alkylation sites and induction of dominant lethals and heritable translocations in mice. In: Ramel C, Lambert B, Magnusson J, editors. Genetic Toxicology of Environmental Chemicals, Part B. Genetic Effects and Applied Mutagenesis. Alan R. Liss Inc; New York: 1986. pp. 493–500. [PubMed] [Google Scholar]
- 42.Generoso WM, Cain KT, Krishna M, Huff SW. Genetic lesions induced by chemicals in spermatozoa and spermatids of mice are repaired in the egg. Proc Natl Acad Sci USA. 1979;76:435–437. doi: 10.1073/pnas.76.1.435. [DOI] [PMC free article] [PubMed] [Google Scholar]
- 43.Sotomayor RE, Ehling UH, Sega GA. Differential sensitivities of spermatogonial and postspermatogonial cell stages of the mouse to induction of unscheduled DNA synthesis by ethyl- and methyl-nitrosourea. Tertogen Carcinogen Mutagen. 1999;19:339–351. [PubMed] [Google Scholar]
- 44.Riley BB, Grunwald DJ. Efficient induction of point mutations allowing recovery of specific locus mutations in zebrafish. Proc Natl Acad Sci USA. 1995;92:5997–6001. doi: 10.1073/pnas.92.13.5997. [DOI] [PMC free article] [PubMed] [Google Scholar]
- 45.Yoshikawa I, Avaki T, Ohshima K. Comparative studies of dose–response curves for recessive lethal mutations induced by ethylnitrosourea in spermatogonia and spermatozoa of Drosophila melanogaster. Environ Mutagen. 1984;6:489–496. doi: 10.1002/em.2860060403. [DOI] [PubMed] [Google Scholar]
- 46.Russell LB, Bangham JW, Stelzner KF, Hunsicker PR. High frequency of mosaic mutants produced by N-ethyl-N-nitrosourea exposure of mouse zygotes. Proc Natl Acad Sci USA. 1988;85:9167–9170. doi: 10.1073/pnas.85.23.9167. [DOI] [PMC free article] [PubMed] [Google Scholar]