Abstract
It is generally believed that increase in adult contractile cardiac mass can be accomplished only by hypertrophy of existing myocytes. Documentation of myocardial regeneration in acute stress has challenged this dogma and led to the proposition that myocyte renewal is fundamental to cardiac homeostasis. Here we report that in human aortic stenosis, increased cardiac mass results from a combination of myocyte hypertrophy and hyperplasia. Intense new myocyte formation results from the differentiation of stem-like cells committed to the myocyte lineage. These cells express stem cell markers and telomerase. Their number increased >13-fold in aortic stenosis. The finding of cell clusters with stem cells making the transition to cardiogenic and myocyte precursors, as well as very primitive myocytes that turn into terminally differentiated myocytes, provides a link between cardiac stem cells and myocyte differentiation. Growth and differentiation of these primitive cells was markedly enhanced in hypertrophy, consistent with activation of a restricted number of stem cells that, through symmetrical cell division, generate asynchronously differentiating progeny. These clusters strongly support the existence of cardiac stem cells that amplify and commit to the myocyte lineage in response to increased workload. Their presence is consistent with the notion that myocyte hyperplasia significantly contributes to cardiac hypertrophy and accounts for the subpopulation of cycling myocytes.
Myocyte turnover occurs in the human heart, and myocyte replication is markedly enhanced in acute pathologic states (1, 2). However, new myocyte generation is attenuated with prolonged ventricular decompensation and end-stage cardiac failure (1, 3). Although myocyte proliferation has been interpreted as the ultimate reserve of the stressed myocardium (4), these observations indicate an opposite phenomenon: myocyte multiplication is higher acutely than chronically. The decrease in myocyte replication with time suggests that these cells undergo a limited number of doublings, perhaps behaving as amplifying cells that concurrently divide and differentiate until they reach growth arrest and the adult phenotype (5). The recognition that myocytes and vascular structures can be formed from primitive cells resident in or homed to the myocardium from the circulation (6, 7) is consistent with this possibility and identifies a plausible origin of these cycling myocytes (8). This outlook has raised the question as to whether the regenerative capacity of the myocardium in acute overload also participates in the hypertrophic response to chronic stimuli with modest ventricular dysfunction, such as in patients with aortic stenosis (9).
Because the majority of myocytes in the adult heart are terminally differentiated and do not reenter the cell cycle, replicating myocytes originate either from the activation of primitive stem or progenitor cardiac cells or by the residual growth of a subgroup of nonterminally differentiated myocytes. In the first case, undifferentiated and early committed cells should be present in the heart. These cells would be expected to express stem cell markers (5, 7) and telomerase (10, 11), divide rapidly upon stimulation (11, 12), and give rise to myocytes at various stages of maturation. In the second case, myocyte regeneration should be self-limiting and restricted to the acute phase.
The results presented here document that human aortic stenosis promotes intense myocyte formation through the differentiation of cardiac stem cells committed to the myocyte lineage. Thus, the increased cardiac mass results from a combination of myocyte hypertrophy and hyperplasia.
Materials and Methods
Patients. Patients with aortic stenosis (n = 36) had valve replacement for rheumatic disease or degenerative calcification. Hypertension was present in 21 cases and coronary disease in 7. Treatment included angiotensin-converting enzyme (ACE) inhibitors, calcium blockers, and diuretics. Heart size and function were measured by echocardiography and catheterization (13). Specimens were obtained by myectomy of the outflow tract and fixed in formalin (n = 36). Twelve biopsies were frozen (n = 12). Control hearts were collected, within 24 h after death, from patients, 71 ± 8 years old, with no cardiac diseases (n = 12; 7 males and 5 females). Samples of three normal hearts were frozen for biochemistry (14).
Cell Markers and Mitotic Index. Several Abs were used alone or in combination to identify putative cardiac stem cells and committed progenies. Colabeling with stem cell antigens and markers of cell differentiation was required to establish whether maturing cells originated from primitive cells. Distinct markers of cell differentiation were also used because they appear at various stages of cell development.
Stem cell markers included mAb against c-kit (DAKO), the receptor of stem cell factor, MDR1 (Chemicon), a protein extruding toxic substances and Hoechst dye, and Sca-1-reactive protein (Cedarlane, Hornby, ON, Canada), which is involved in self-renewal of hemopoietic stem cells. Myocyte markers were as follows: cardiac myosin, α-sarcomeric actin, desmin, connexin-43, N-cadherin, GATA-4, GATA-5, MEF2, and nestin. Smooth muscle cells markers: α-smooth-muscle-actin and transforming growth factor β1 receptor. Fibroblast marker: vimentin. Endothelial markers: von Willebrand factor, Flk1, and CD31. Skeletal muscle nuclear proteins (MyoD, myogenin, and Myf5), neural proteins (microtubule-associated protein 1b, neurofilament 200 and glial fibrillar acidic protein), and hemopoietic cell markers (glycophorin-A, CD45, CD45RO, and CD8) were examined. For each staining, 50-100 and 600-1,200 mm2 of tissue was sampled from hypertrophied and control heart, respectively (1, 2, 7). Cdc6, MCM5, Ki67, and cyclin B1 Ab labeled cycling cells; 500-9,000 and 5,000-27,000 myocyte nuclei were counted in each hypertrophied and control heart. Corresponding sampling for mitotic indices was 4,000-14,000 and 50,000-170,000 nuclei. In each heart, myocyte diameter was measured across the nucleus in 100-200 cells cut transversely and the cross-sectional area was computed (4).
Western Blotting. Protein lysates were precipitated with a Sca-1 mouse mAb (PharMingen). After PAGE, proteins were transferred and exposed to the same mAb (11). A Sca-1 epitope was seen at 18.4 kDa.
Telomeric Repeat Amplification Protocol. Samples were homogenized in 3-[(3-cholamidopropyl)dimethylammonio]-1-propanesulfonate buffer and were centrifuged. Untreated and RNase-treated extracts, 0.5 and 1 μg, were incubated with [γ-32P]ATP-end-labeled telomerase substrate (5′-AATCCGTCGAGCAGAGTT-3′), Taq DNA polymerase, and anchored reverse primer [5′-GCGCGC-(CTTACC)3CTAACC-3′]. PCR products were separated by PAGE. Telomerase reaction generated a 6-bp ladder (11).
Telomeric Restriction Fragment (TRF) Analysis. Electrophoresed genomic DNA, digested with RsaI and HinfI and transferred to a nylon membrane, was hybridized with 32P-end-labeled (C3TA2)3 probe. TRF length was determined by densitometry (11, 15).
Statistics. Results are means ± SD, and P < 0.05 was determined by Student's t test.
Results
Patients. Table 1, which is published as supporting information of the PNAS web site, www.pnas.org, lists echocardiographic (n = 36) and hemodynamic (n = 20) data, and the duration of the disease from echocardiographic diagnosis to surgery (3 ± 5 years). Ventricular pressures and aortic gradient were increased. Ejection fraction and fractional shortening were not altered.
Putative Primitive Cells, Progenitors, and Precursors. Primitive cells positive for c-kit, MDR1, or Sca-1-reactive protein only, i.e., putative cardiac stem cells, were 6 ± 2 μm in diameter (Fig. 1 A-C). These cells were negative for antigens of hemopoietic lineages (Fig. 7, which is published as supporting information on the PNAS web site), transcription factors of cardiac and skeletal muscle cells (Fig. 8, which is published as supporting information on the PNAS web site), and cytoplasmic markers of myocytes, fibroblasts, and endothelial, smooth muscle, and neural cells (Figs. 9 and 10, which are published as supporting information on the PNAS web site). A Sca-1-like epitope was confirmed biochemically in myocardial samples. Sca-1 Ab-reactive protein increased with aortic stenosis (Fig. 11A, which is published as supporting information on the PNAS web site). Cells positive for this protein alone or with c-kit were also found in human bone marrow (Fig. 11B).
Fig. 1.
Putative cardiac stem cells. Shown are detection of c-kit (A, green), MDR1 (B, purple), and Sca-1-reactive protein (C, yellow) in primitive cells (arrows) of hypertrophied hearts. Nuclei are stained by propidium iodide (PI; blue) and myocytes by cardiac myosin (red). (Bars = 10 μm.)
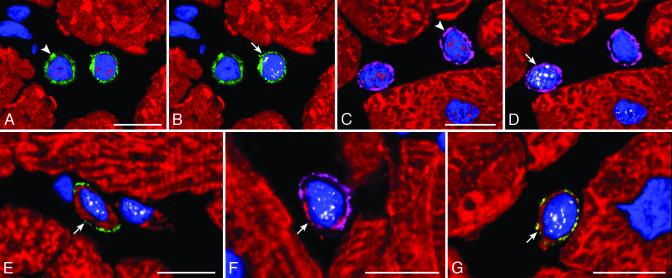
Extrapolating from cardiac ontogeny (16, 17), the presence of stem cell antigens and the exclusive expression of the cardiac transcription factor GATA-4 (16) or GATA-4 and the myocyte transcription factor MEF2 (17) identified putative cardiac and myocyte progenitors, respectively. Putative myocyte precursors differed from progenitors by the expression of cytoplasmic proteins, such as cardiac myosin (Fig. 2). The presence of stem cell antigens, GATA-4, MEF2, and myosin, established a sequential lineage commitment of primitive cells into cardiac progenitors, myocyte progenitors, and myocyte precursors. Surface antigens were no longer detectable in myosin-positive cells, i.e., amplifying myocytes, that were larger than myocyte precursors but much smaller than adult myocytes (Fig. 12 A and B, which is published as supporting information on the PNAS web site). With respect to controls (n = 12), aortic stenosis (n = 36) led to an 8- to 19-fold increase in the number of lineage negative c-kit, lineage negative MDR1, or lineage negative Sca-1-like positive cells and to a 10- to 26-fold increase in cardiac progenitors and myocyte progenitors and precursors (Fig. 12C).
Fig. 2.
Commitment of primitive cells with cardiac hypertrophy. (A and B; the same field) A cardiac progenitor (A, arrowhead) shows c-kit on the surface membrane (green) and GATA-4 (A, red) in the nucleus, and the myocyte progenitor (B, arrow) exhibits in its nucleus GATA-4 (A, red) and MEF2 (B, white). (C and D; the same field) A cardiac progenitor (C, arrowhead) shows MDR1 on the surface membrane (purple) and GATA-4 (C, red) in the nucleus, and a myocyte progenitor (D, arrow) exhibits in its nucleus GATA-4 (C, red) and MEF2 (D, white). (E, F, and G) Myocyte precursors (arrows) show on the surface membrane c-kit (E, green), MDR1 (F, purple), or Sca-1-like (G, yellow). A thin cytoplasmic layer is positive for cardiac myosin (E-G, red) and nuclei express MEF2 (E-G, white). (Bars = 10 μm.)
Cycling Primitive and Early Committed Cells. Two markers of cell proliferation were used to determine the dynamic state of primitive and committed cells (Fig. 13 A-E, which is published as supporting information on the PNAS web site). Ki67 is a nuclear protein expressed in late G1,S,G2, prophase and metaphase, decreasing in anaphase and telophase (18). MCM5 is expressed throughout G1 and S, becomes undetectable in G2 and early mitosis, and is present again in anaphase and telophase (19, 20). With respect to controls (n = 12), aortic stenosis (n = 36) led to a 70- to 140-fold increase in Ki67-labeled c-kit, MDR1, and Sca-1-like primitive cells. Ki67-positive cardiac progenitors and myocyte progenitors-precursors combined increased 65- to 240-fold. The analysis of MCM5 was restricted to primitive cells (controls, n = 8; patients, n = 16), which markedly increased with aortic stenosis (Fig. 13F). The values were higher than Ki67, and this difference, most likely, reflected a larger fraction of cycling cells in G1.
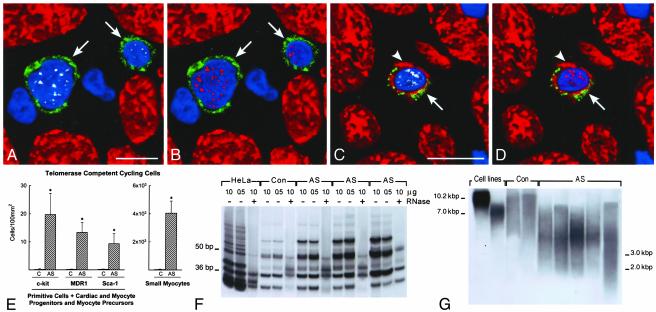
Telomerase and Cycling Cells. Telomerase is expressed in stem cells of self-renewing organs, such as bone marrow, skin, brain, and intestine (12, 21). Telomerase is a reverse transcriptase that during the cell cycle synthesizes telomeric repeats at the end of chromosomes, preventing loss of DNA (10, 11, 21). Telomerase is present in dividing cells and is absent from resting and terminally differentiated cells (10). Telomerase and MCM5 were detected in cycling cells expressing stem cell antigens alone or transcription factors and cardiac myosin (Fig. 3 A-D). In comparison with controls (n = 8), aortic stenosis (n = 16) resulted in a 90- to 120-fold increase in all cell categories positive for telomerase and MCM5 (Fig. 3E; P < 0.001). Together with primitive cells, telomerase and MCM5 were detected in myocytes (Fig. 14, which is published as supporting information on the PNAS web site) that did not express stem cell antigens and had a 131 ± 15 μm2 cross-sectional area. These amplifying myocytes increased 190-fold with aortic stenosis (Fig. 3E; P < 0.001).
Fig. 3.
Telomerase and telomeric length. (A-D) c-kit-positive cells (green, arrows) expressing telomerase (A and C, white) in nuclei. Nuclei are also positive for MCM5 (B and D, red). The c-kit-positive cell (C and D) has a thin myocyte cytoplasmic layer (cardiac myosin, red; arrowheads). (E) Number of primitive, early committed cells and small amplifying myocytes expressing telomerase and MCM5. Results are mean ± SD. *, P < 0.001 between hypertrophied (aortic stenosis, AS) and control (C) hearts. (F) Telomerase activity in control (Con) and hypertrophied (AS) hearts; products of telomerase activity start at 50 bp and display 6-bp periodicity. Lysates treated with RNase (+) were used as negative control and HeLa cells as positive control. (G) Telomeric restriction fragment lengths in control (Con) and hypertrophied (AS) hearts; immortal cell lines of known mean telomeric length, 10.2 and 7.0 kbp, were used as baseline.
On this basis, telomerase activity was measured. The optical density of the 6-bp ladder reflected the number of telomerase substrate oligonucleotides extended by telomerase (Fig. 3F). Aortic stenosis increased enzyme activity from a 25 ± 3 (n = 3) control value to 88 ± 29 (n = 12; P < 0.001). However, telomeric length decreased (Fig. 3G: controls = 9 ± 1 kbp, n = 3; patients = 3.3 ±
0.5 kbp, n = 6; P < 0.001), indicating that telomerase activity did not prevent telomeric shortening.
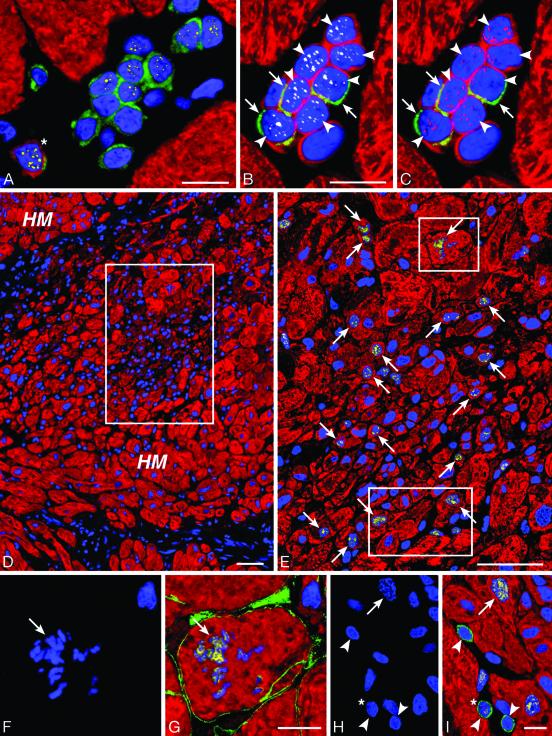
Cell Clusters. Myocyte commitment of putative cardiac stem cells and their amplification and differentiation predicted that clusters of primitive cells, progenitors, precursors and small developing myocytes had to be present in the hypertrophied myocardium. This organization would reflect intense expansion and maturation of stem or progenitor cells. Clusters of undifferentiated and early differentiating cells positive for stem cell antigens were a consistent finding of aortic stenosis (Fig. 4 A-C). Aggregates of small mostly cycling and telomerase competent myocyte precursors and amplifying myocytes were common (Fig. 4 B-I). The majority of these clusters contained 6-12 cells at different stages of differentiation and myocyte commitment (Fig. 4 A-C). This arrangement was strongly suggestive of clonal expansion starting from a stem or amplifying cell that through a process of cell division generated a large progeny that differentiated asynchronously (Fig. 4 D and E; Fig. 15 A-H, which is published as supporting information on the PNAS web site). These clusters leave little doubt about the existence of stem cells in the heart that are stimulated to amplify and commit to the myogenic pathway in response to the increased work load produced by aortic stenosis (Fig. 15 I-J).
Fig. 4.
Intense growth in the hypertrophied heart. (A) Group of 12 c-kit-positive cells (green) surrounded by myocytes (red). Several nuclei express GATA-4 (yellow). One cell has a thin layer of myocyte cytoplasm (myosin, red, asterisk). (B and C) A second group of nine small cells with a ring of myocyte cytoplasm (myosin, red). Three of these cells exhibit c-kit (green; arrows) and seven (arrowheads) express both telomerase (B, white) and MCM5 (C, purple). (D) Low-power field of a cluster (rectangle) of small poorly differentiated myocytes within the hypertrophied myocardium (HM). Myocytes are labeled by cardiac myosin (red) and nuclei by propidium iodide (blue). The area in the rectangle is illustrated at higher magnification in E, in which Ki67 (yellow) labels a large number of myocyte nuclei (arrows). The two small rectangles delimit areas shown at higher magnification in F-I. A mitotic nucleus with metaphase chromosomes (F and G; arrows) is positive for Ki67 (G, yellow) and the boundary of the cell is defined by laminin (G, green). Another mitotic nucleus (H; arrow) is labeled by Ki67 (I, yellow; arrow). c-kit-positive cells (I, green; arrowheads) are near the mitotic myocyte. One shows Ki67 (I, yellow; asterisk). (Bars = 10 μmin A-C and F-I; bars = 50 μmin D and E).
Amplifying and Terminally Differentiated Myocytes. Ki67, MCM5, Cdc6, and cyclin B1 are nuclear proteins involved in the cell cycle. Conversely, p16 induces growth arrest and cellular senescence. These markers were measured together with myocyte diameter to identify replicating and nonreplicating cells and their size. Ki67 and MCM5 were introduced above. Cdc6 establishes the prereplication complex by recruiting MCM proteins at the site of initiation of DNA synthesis (22). Cyclin B1 accumulates in the nucleus just before mitosis, corresponding to the onset of karyokinesis (23). p16 maintains the retinoblastoma protein Rb in its hypophosphorylated form (24), blocking the cell cycle (Fig. 16, which is published as supporting information on the PNAS web site).
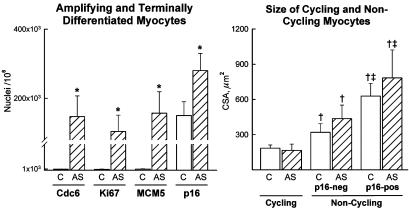
Aortic stenosis led to 150- to 180-fold increase in the number of Cdc6-, Ki67-, and MCM5-positive myocyte nuclei (Fig. 5; P < 0.001). Cyclin B1 was detected in 28 ± 15/106 and in 4,300 ± 1,500/106 myocyte nuclei of control and hypertrophied hearts, respectively. The transverse area of cycling myocytes was 60% and 80% smaller than noncycling p16-negative and p16-positive cells (Fig. 5). Thus, small amplifying myocytes regenerate and bigger cells may enlarge or do not respond to growth stimuli.
Fig. 5.
Number and size of cycling and noncycling myocytes. Results are mean + SD. *, P < 0.001 between hypertrophied (AS) and control (C) hearts; †, P < 0.001 between cycling and noncycling p16-negative (p16-neg) and p16-positive (p16-pos) myocytes; ‡, P < 0.001 between noncycling p-16-neg and noncycling p16-pos myocytes.
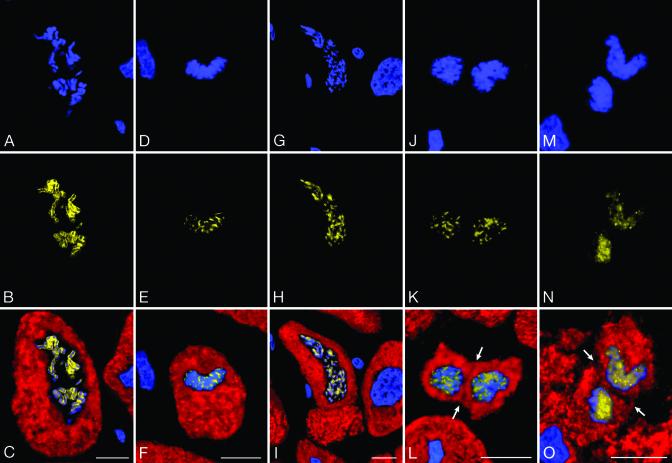
Myocytes in mitosis, including karyokinesis, or nuclear division, and cytokinesis, or cell division, were identified in the hypertrophied hearts (Fig. 6). Mitotic myocytes increased 140-fold with aortic stenosis, from 15 ± 5/106 in control to 2,100 ± 740/106 in hypertrophied hearts (P < 0.001). Thus, 2 of every 1,000 myocytes were in mitosis. The ratio of myocytes traversing the cell cycle to those in mitosis allowed us to estimate the duration of the cell cycle. On the assumption that mitosis lasts 30 min, this parameter was nearly 25 h when Ki67 was considered or 40 h when MCM5 was used (1). Importantly, the number of cycling myocytes (Ki67, MCM5, Cdc6, cyclin B1, mitotic index) was inversely correlated with the duration of the disease from 1 year or longer (P < 0.002-0.0004).
Fig. 6.
Mitosis, karyokinesis, and cytokinesis in myocytes. A, D, G, J, and M illustrate chromosomes [propidium iodide (PI), blue]. B, E, H, K, and N show Ki67 in chromosomes (yellow). C, F, I, L, and O depict the combination of cardiac myosin (red) in myocytes with PI and Ki67 staining of mitotic nuclei (bright yellow). Arrows point to cytokinesis. (Bars = 10 μm.)
Discussion
The most significant result of this study is that the heart possesses primitive cells, which express surface antigens commonly detected on hemopoietic stem cells (5). No other markers of cardiac, hemopoietic, skeletal muscle, and neural cell commitment have been found. Cardiac progenitors, myocyte progenitors, and precursors positive for c-kit, MDR1, and Sca-1-reactive protein were detected, demonstrating a link between putative cardiac stem cells and myocyte differentiation. This lineage commitment ultimately gave rise to small developing myocytes that further evolved into the adult phenotype. The growth and differentiation of cardiac stem cells in mature myocytes was markedly enhanced in the hypertrophied myocardium of patients with chronic aortic stenosis. In the pressure-overloaded heart, the number of primitive and early committed cells was only a fraction of that represented by dividing telomerase-competent amplifying myocytes. This pattern of growth is consistent with the activation of a restricted number of stem cells, which have the ability to generate a large number of highly proliferating parenchymal cells (5). The modest impairment of ventricular function before correction of the valvular disease suggests that the process of cell regeneration led to functionally competent myocytes that contributed to limit the alterations in hemodynamics. Patients with aortic stenosis have good ventricular function for many years before decompensation becomes apparent (9).
Although mechanical factors may play a role in the growth response of the stressed heart, the local activation of genes promoting cell replication and the down-regulation of genes interfering with cell cycle entry and progression may be importantly implicated in the growth of primitive and committed cells. For example, inhibition of angiotensin-converting enzyme interferes with Ac-Ser-Asp-Lys-Pro function, attenuating stem cell growth (25). This is an interesting possibility that requires further investigation.
The recognition that the heart may belong to organs with self-renewing property suggests that the theme of the controversy on myocyte regeneration must be reexamined. We have proposed that a subpopulation of myocytes in the adult heart is capable of reentering the cell cycle and undergoing cytokinesis despite their developed state (26). This notion was opposed by negative results obtained after the in vivo injection of proteins interfering with p53 or other cell cycle inhibitors (27). Myocyte division was not detected and the attempts of the cells to replicate resulted in apoptotic cell death (27). Either position had valid points but could not provide a logical understanding of myocyte growth or its developmental block. These opposing views have exacerbated the debate among laboratories, leading to two distinct paradigms of cardiac hypertrophy. In one, both myocyte hypertrophy and proliferation were considered to be involved in the response of the stressed heart whereas, in the other, only cellular hypertrophy was claimed to contribute to cardiac enlargement (28). At present, the discrepancy no longer exists. Dividing myocytes are amplifying cells that can experience a finite number of divisions before reaching terminal differentiation and growth arrest. Similarly, forced recall of differentiated myocytes into the cell cycle fails to trigger DNA synthesis and activates the endogenous cell death program.
The high degree of myocyte replication that was found here was unexpected and surprising. For this reason, the unusual level of myocyte regeneration was proven with several markers of the cell cycle, Cdc6, Ki67, and MCM5 (18-20, 22) that provided comparable data. Similarly, cyclin B1 labeling (23) of myocyte nuclei and the mitotic index were consistent. However, the number of mitotic myocytes was 4-fold and 15-fold greater than that previously reported with acute and chronic cardiac failure (1, 3). Difficult is the identification of the variables responsible for the difference in myocyte division between heart failure of ischemic and nonischemic origin (1, 3), and moderate ventricular dysfunction and aortic stenosis. One critical factor could be the degree and duration of the overload. Multiplication and differentiation of primitive and committed cells may be limited, and large stresses, acute or chronic, may produce a progressive decline of myocardial growth. This may not be the case with aortic stenosis and modest ventricular dysfunction. However, telomeric shortening occurred in the presence of enhanced telomerase activity. The ribonucleoprotein attenuated the process but could not prevent telomere attrition. A similar condition develops in the bone marrow with rapid cellular growth (29). Intense cell division after bone marrow transplantation is characterized by elevated telomerase activity and telomere erosion (29). Ultimately, telomerase cannot prevent loss of DNA and growth arrest in both systems (10).
The magnitude of stem cell-dependent myocyte regeneration with aortic stenosis, ≈15%, is similar to that observed in cardiac chimerism after transplantation of female hearts into male recipients (7). Cardiac chimerism offered the unique opportunity to recognize the formation of myocytes and vascular structures from primitive cells resident in the heart or homed to the heart from the circulation. The detection of the Y chromosome allowed us to document that myocyte replication accounted for nearly 18% of the entire cell population. This work has generated enthusiasm and opposition in the scientific community. A series of quickly published reports and an editorial (30) have challenged myocyte proliferation once more. However, these studies used methodologies inadequate for magnitude of tissue sampling and level of microscopic resolution (31). The findings with aortic stenosis strengthen the data on cardiac chimerism, and we hope that they will stimulate more interest in the area of myocardial regeneration.
Supplementary Material
Acknowledgments
We are grateful to Dr. Maria Blasco for suggestions and guidance. This work was supported by National Institutes of Health Grants HL-38132, AG-15756, HL-66923, AG-17042, and PO1AG-023071 (to P.A.), HL-65577 (to A.L.), and HL-65573 (to J.K.).
This paper was submitted directly (Track II) to the PNAS office.
References
- 1.Beltrami, A. P., Urbanek, K., Kajstura, J., Finato, N., Bussani, R., Nadal-Ginard, B., Beltrami, C. A. & Anversa, P. (2001) N. Engl. J. Med. 344, 1750-1757. [DOI] [PubMed] [Google Scholar]
- 2.Anversa, P. & Nadal-Ginard, B. (2002) Nature 415, 240-243. [DOI] [PubMed] [Google Scholar]
- 3.Kajstura, J., Leri, A., Finato, N., Di Loreto, C., Beltrami, C. A. & Anversa, P. (1998) Proc. Natl. Acad. Sci. USA 95, 8801-8805. [DOI] [PMC free article] [PubMed] [Google Scholar]
- 4.Anversa, P. & Olivetti, G. (2002) in The Heart, Handbook of Physiology, Section 2: The Cardiovascular System, eds. Page, E., Fozzard, H. & Solaro, J. (Oxford Univ. Press, New York), Vol. 1, pp. 75-144. [Google Scholar]
- 5.Wagers, A. J., Christensen, J. L. & Weissman, I. L. (2002) Gene Ther. 9, 606-612. [DOI] [PubMed] [Google Scholar]
- 6.Schwartz, R. S. & Curfman, G. D. (2002) N. Engl. J. Med. 346, 2-4. [DOI] [PubMed] [Google Scholar]
- 7.Quaini, F., Urbanek, K., Beltrami, A. P., Finato, N., Beltrami, C. A., Nadal-Ginard, B., Kajstura, J., Leri, A. & Anversa, P. (2002) N. Engl. J. Med. 346, 5-15. [DOI] [PubMed] [Google Scholar]
- 8.Nadal-Ginard, B., Kajstura, J., Leri, A. & Anversa, P. (2003) Circ. Res. 92, 139-150. [DOI] [PubMed] [Google Scholar]
- 9.Carabello, B. A. & Crawford, F. A. (1997) N. Engl. J. Med. 337, 32-41. [DOI] [PubMed] [Google Scholar]
- 10.Greider, C. W. (1998) Proc. Natl. Acad. Sci. USA 95, 90-92. [DOI] [PMC free article] [PubMed] [Google Scholar]
- 11.Leri, A., Barlucchi, L., Limana, F., Deptala, A., Darzynkiewicz, Z., Hintze, T. H., Kajstura, J., Nadal-Ginard, B. & Anversa, P. (2001) Proc. Natl. Acad. Sci. USA 98, 8626-8631. [DOI] [PMC free article] [PubMed] [Google Scholar]
- 12.Yui, J., Chiu, C. P. & Lansdorp, P. M. (1998) Blood 91, 3255-3262. [PubMed] [Google Scholar]
- 13.Devereux, R. B. & Reichek, N. (1977) Circulation 55, 613-618. [DOI] [PubMed] [Google Scholar]
- 14.Guerra, S., Leri, A., Wang, X., Finato, N., Di Loreto, C., Beltrami, C. A., Kajstura, J. & Anversa, P. (1999) Circ. Res. 85, 856-866. [DOI] [PubMed] [Google Scholar]
- 15.Blasco, M. A., Lee, H. W., Hande, M. P., Samper, E., Lansdorp, P. M., DePinho, R. A. & Greider, C. W. (1997) Cell 91, 25-34. [DOI] [PubMed] [Google Scholar]
- 16.Durocher, D., Charron, F., Warren, R., Schwartz, R. J. & Nemer, M. (1997) EMBO J. 16, 5687-5696. [DOI] [PMC free article] [PubMed] [Google Scholar]
- 17.Morin, S., Charron, F., Robitaille, L. & Nemer, M. (2000) EMBO J. 19, 2046-2055. [DOI] [PMC free article] [PubMed] [Google Scholar]
- 18.Scholzen, T. & Gerdes, J. (2000) J. Cell. Physiol. 182, 311-322. [DOI] [PubMed] [Google Scholar]
- 19.Tanaka, T., Knapp, D. & Nasmyth, K. (1997) Cell 90, 649-660. [DOI] [PubMed] [Google Scholar]
- 20.Dutta, A. & Bell, S. P. (1997) Annu. Rev. Cell. Dev. Biol. 13, 293-332. [DOI] [PubMed] [Google Scholar]
- 21.Martin-Rivera, L., Herrera, E., Albar, J. P. & Blasco, M. A. (1998) Proc. Natl. Acad. Sci. USA 95, 10471-10476. [DOI] [PMC free article] [PubMed] [Google Scholar]
- 22.Cook, J. G., Park, C. H., Burke, T. W., Leone, G., DeGregori, J., Engel, A. & Nevins, J. R. (2002) Proc. Natl. Acad. Sci. USA 99, 1347-1352. [DOI] [PMC free article] [PubMed] [Google Scholar]
- 23.Ohashi, A., Minami, N. & Imai, H. (2001) Biol. Reprod. 65, 1195-1200. [DOI] [PubMed] [Google Scholar]
- 24.McConnell, B. B., Starborg, M., Brooks, S. & Peters, G. (1998) Curr. Biol. 8, 351-354. [DOI] [PubMed] [Google Scholar]
- 25.Azizi, M., Rousseau, A., Ezan, E., Guyene, T., Michelet, S., Grognet, J., Lenfant, M., Corvol, C. & Menard, J. (1996) J. Clin. Invest. 97, 839-844. [DOI] [PMC free article] [PubMed] [Google Scholar]
- 26.Anversa, P. & Kajstura, J. (1998) Circ. Res. 83, 1-14. [DOI] [PubMed] [Google Scholar]
- 27.Agah, R., Kirshenbaum, L. A., Abdellatif, M., Truong, L. D., Chakraborty, S., Michael, L. H. & Schneider, M. D. (1997) J. Clin. Invest. 100, 2722-2728. [DOI] [PMC free article] [PubMed] [Google Scholar]
- 28.MacLellan, W. R. & Schneider, M. D. (2000) Annu. Rev. Physiol. 62, 289-319. [DOI] [PubMed] [Google Scholar]
- 29.Allsopp, R. C., Cheshier, S. & Weissman, I. L. (2001) J. Exp. Med. 193, 917-924. [DOI] [PMC free article] [PubMed] [Google Scholar]
- 30.Taylor, D. A., Hruban, R., Rodriguez, E. R. & Goldschmidt-Clermont, P. J. (2002) Circulation 106, 2-4. [DOI] [PubMed] [Google Scholar]
- 31.Anversa, P. & Nadal-Ginard, B. (2002) Circulation 106, e129-e131. [DOI] [PubMed] [Google Scholar]
Associated Data
This section collects any data citations, data availability statements, or supplementary materials included in this article.


