

Abstract
The spectra of equilibrium chain conformation fluctuations of apomyoglobin (apoMb) as a function of folding, from the acid-denatured state at pH 2.6 through the stable molten globule state pH ≈ 4.1 to the folded state at pH 6.3, are reported, as measured by fluorescence correlation spectroscopy. The conformational fluctuations, which are detected by quenching of an N-terminal fluorescent label by contact with various amino acids, can be represented by superpositions of decaying exponentials with time scales ranging from ≈3 to ≈200 μs. Both the time scales and amplitudes of the fluctuations increase with the degree of acid denaturation, with principal shifts associated with the transition across the molten globule state. Measurements of the diffusion of apoMb confirm theoretical values showing a ≈40% increase in the hydrodynamic radius upon acid denaturation. This study uses the model protein apoMb to illustrate the complex scope of folding associated structural dynamics.
A major challenge of structural biology is elucidation of the complex pathways by which proteins attain their folded, functional structures, or in the case of many proteins, misfolded structures. Understanding requires not only characterization of the structures populated during folding, but also the dynamics of the polypeptide chain as its motions become restricted to progressively narrower ranges as folding reaches toward completion. Of particular interest are the intrachain contacts formed in unfolded or partially folded molten globule states, which may limit the conformational space sampled by the chain, directing it toward its final structure. However, because the relevant chain motions in structural fluctuations can span time scales from picoseconds to seconds, they may be elusive to traditional techniques (such as NMR) or lost in the dead time of stopped-flow measurements, and thus have been difficult to characterize.
Extensive characterization of both the thermodynamics and kinetics of the sperm whale apomyoglobin (apoMb) structure by numerous techniques has made it a paradigm for protein folding studies (1). ApoMb is generated by removing the noncovalently bound heme group from myoglobin (Fig. 1). ApoMb has provided a unique insight into the folding reaction because it undergoes a three-state pH-induced unfolding transition via stable molten globule intermediates.
Fig. 1.

Ribbon representation of apoMb. Helices A–H are labeled. The amino-terminal label and potential side-chain quenching groups are colored as follows: Alexa 488 (green), Tyr (red), Trp (purple), Met (cyan), and His (blue).
It has been reported that apoMb can be induced to transition from its native all-helical structure to an aggregated β-sheet form that is characteristic of amyloid deposits, which are associated with a broad range of diseases (2, 3). This observation, which motivates the research presented here, implies the potential for insight into protein misfolding by studying the structural fluctuations associated with folding pathways (2).
With the ability to access time scales from nanoseconds to seconds, fluorescence correlation spectroscopy (FCS) has emerged as a powerful technique for characterizing dynamics of molecules of biochemical and biophysical interest (4–8). Although commonly used to measure the diffusion-associated properties of biomolecules, FCS can also characterize fluctuations in fluorescence intensity caused by chemical kinetics or photophysics (4–7, 9–11). A number of studies have demonstrated the utility of FCS in monitoring folding or function-related conformational fluctuations in RNA (12, 13), DNA (14–18), polypeptides (19), and, of particular interest to this study, proteins (20–24). Chattopadhyay et al. (20, 21) followed a pH-induced unfolding transition in a small fatty acid binding protein, finding that the decrease of the amplitude of a ≈35-μs fluctuation mirrored the unfolding of the protein and later demonstrating that their observed motions were diffusive in nature. Similarly, Rischel et al. (22) were able to put an upper bound of ≈4 μs on the time scale of fluctuations in denatured cytochrome c. Here, our use of FCS to measure equilibrium structural fluctuations of apoMb challenges current instrumental capabilities and tests the limits of FCS autocorrelation methods.
ApoMb can be denatured conveniently by the addition of acid. The native state (N state) of apoMb is formed above pH 6. Its structure is similar to that of the heme-bound protein except for enhanced flexibility and partial unfolding of the F-helix (25). At pH 4.2, apoMb exists as a mixture of two partially folded forms, Ia and Ib (26), which are classic molten globules in that they contain extensive secondary structure but loosely packed cores (27, 28). Structure in Ia is limited to helices A–G–H, and to a lesser extent, helix B; Ib is similar except that helix B is more structured (29). Ia and Ib equilibrate on the 1- to 10-ms time scale at pH ≈4.2; however, the equilibrium constant has not been measured (30), thus “I” refers to the equilibrium mixture of Ia and Ib. At pH 2.5, apoMb exists in an unfolded state (U state) that nonetheless contains some helical secondary structure (31–33).
In this study, we apply FCS to measure the equilibrium chain dynamics of apoMb as a function of pH. The V1C mutation at the amino terminus of the protein allows for specific labeling with the fluorophore Alexa 488 (apoMb V1C-AL488). The fluorescence emission of Alexa 488 is sensitive to specific interactions with quenching groups in the protein chain, thereby reporting on the contact dynamics of the N terminus of the protein. We find that the correlation curves for these effects can be best represented by two exponential relaxation times above pH ≈4.1, whereas the low pH curves require three relaxation times, allowing us to resolve fluctuations on timescales ranging from ≈3 to ≈200 μs. Although the relaxation times of the motions are relatively insensitive to pH, the amplitude of the correlation signal at each pH can be attributed to increase in fluctuations as the protein unfolds. In addition, we extract the diffusion time of apoMb at each pH as a measure of the relative hydrodynamic compactness of the structures populated.
Results
To determine the extent to which the Alexa 488 label perturbs equilibrium folding of apoMb, we monitored acid-induced unfolding of WT and V1C-AL488 by using CD and the accompanying dependence of the fluorescence of V1C-AL488 (Fig. 2). ApoMb WT unfolds in the well documented three-state manner. The N/I transition occurs with a midpoint (pK1) near pH 4.7. The characteristic molten globule state (I) is maximally populated at pH 4.1. I unfolds to U with a midpoint (pK2) near pH 3.4. Introduction of the V1C mutation and the dye group does not change pK1, pK2, or the molar ellipticities of N, I, or U. This finding indicates that the Alexa 488 label does not perturb the structures or stabilities of the species populated throughout the acid-induced unfolding reaction. We characterized the acid-induced unfolding reaction of apoMb V1C-AL488 by Alexa 488 bulk fluorescence. The fluorescence intensity (corrected for the changes in Alexa 488 absorption caused by pH) decreases as the protein unfolds from N to I, and decreases further as I unfolds to U [supporting information (SI) Fig. 5], showing its suitability for reporting variations of the unfolding of apoMb.
Fig. 2.

Calibrations of fluorescence-labeled apoMb VIC-AL488 show that mutation and labeling do not perturb stability. Acid denaturation of apoMb (●) and apoMb V1C-AL488 (○), monitored by CD at 222 nm at 20°C (left y axis) and fluorescence emission of apoMb V1C-AL488 (gray circles) (right y axis).
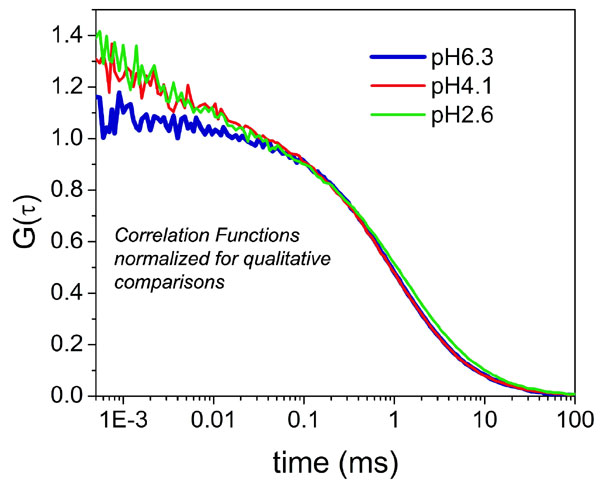
FCS measurements were made of apoMb V1C-AL488 in solutions ranging from pH 6.3 to 2.6. Data were fitted with five models seeking optimum representations: diffusion only with one or two diffusing components (1D and 2D) and with diffusion plus up to three kinetic components (1D + 1F, 1D + 2F, and 1D + 3F) (see Materials and Methods and SI Text for a complete discussion of models and an illustrative FCS data representation in SI Fig. 6). The best fits from the five models for measurements at pH 2.6 and 6.3 are shown in Fig. 3 a and c, with expanded axes in Fig. 3 b and d, respectively. Only the 1D + 2F and 1D + 3F models return reasonable diffusion times and fit the data with flat residuals (see SI Text). To differentiate between the fits, the χ2 values of the 1D + 3F fit were subtracted from the χ2 values of the 1D + 2F fit for each pH. Between pH 6.3 and 4.35, this difference is negligible. However, between pH 4.1 and 2.6, the χ2 values jumped abruptly, indicating that the addition of a third exponent considerably improved the fit. We therefore used the parameters extracted from 1D + 2F for pH ≥ 4.35 and those from 1D + 3F for pH ≤ 4.1 to interpret our results.
Fig. 3.

Fluctuations of apoMb structure increase with denaturation. (a and b) Correlation curves at pH 2.6 (a) and pH 6.3 (b), showing fits from the five different models considered: 1D (cyan), 1D + 1F (red), 1D + 2F (blue), 1D + 3F (orange), and 2D (green), where D designates a diffusion component and F designates a relaxation time component in the fits. (c and d) Enlargements of a and b, respectively, to better illustrate deviations of each model at short time scales.
Although the amplitudes (Ai for pH ≥ 4.35; Bi for pH ≤ 4.1) of the correlation signals that can be attributed to structural fluctuations change as a function of pH (Fig. 4a), the relaxation times themselves are relatively constant (Fig. 4b). In the pH ≥ 4.35 samples the amplitudes of the two relaxation times exhibit similar behavior: A1, associated with the ≈100-μs fluctuation, grows from ≈3% to ≈10% as the pH decreases from 6.3 to 4.35, whereas A2 reflects a ≈8-μs fluctuation that grows from ≈7% to ≈12%. In the pH ≤ 4.1 samples, B1 is associated with a ≈200-μs relaxation time and remains constant at ≈10%. The amplitudes of the two faster components in these samples are larger than B1, and both increase in value as the pH decreases; B2 (≈30-μs fluctuation) increases only a small amount, from ≈11% at pH 4.1 to ≈13% at pH 2.6, whereas B3 (≈3-μs fluctuation) increases from ≈11% to ≈17% over the same pH range.
Fig. 4.

Best-fit values of structural fluctuation fractional amplitudes and relaxation times. (a) pH dependence of the amplitudes extracted from 1D + 2F (A1 and A2) and 1D + 3F (B1, B2, and B3) fits at pH ≥ 4.35 and pH ≤ 4.1, respectively; A1 and B1 (●), A2 and B2 (□), and B3 (○). Each amplitude represents the prefactor of its associated exponential relaxation time to the overall correlation curve. (b) Corresponding relaxation times as a function of pH: τ1A and τ1B (●), τ2A and τ2B (□), and τ3B (○). Assuming that each τ does not change significantly across a relevant pH range, the dotted lines represent the average value of each τ across that range.
In choosing the number of exponential time decay components appropriate for each pH, we aimed to use the simplest model possible that accurately fit the data within the experimental uncertainties. We observed approximately an order of magnitude difference between each of the relaxation times we are able to assign. However, we cannot exclude the possibility that there are additional relaxation times that we do not observe, either because they are faster than the resolution of our measurements, or because they are not spectrally separable from the dominant time scales that we do observe.
These measurements also provide diffusion times (τD) of the protein, which are directly proportional to the hydrodynamic radii (rH) and represent an average over all fluctuating structures at each pH. τD can be extracted accurately from the correlation function fits; these values are plotted as a function of pH in SI Fig. 7a. The fitted diffusion time for the folded state at pH 6.3 is 1 ± 0.015 ms, which corresponds to a hydrodynamic radius rH ≅ 2.0 ± 0.1 nm. The rH at pH 2.6 can be scaled from SI Fig. 7a and compared with previous literature reports on published apoMb hydrodynamic radii (34); ApoMb V1C-AL488 maintains a native-like conformation between pH 6.3 and 4.35, but shows a continuous increase in rH beginning at pH ≈4.1. This increase is consistent with the I to U unfolding transition observed by CD (Fig. 2). τD is relatively insensitive to the model used to fit the correlation function, and similar values for τD were found by using 1D + 1F, 1D + 2F, and 1D + 3F. Thus, τD begins to increase between pH 4.35 and 4.1, regardless of the fitting model. This observation suggests that the conformational fluctuations of the molecule that result in the kinetics we observe are also changing between pH 4.35 and 4.1, providing a physical basis for our finding that two exponential components are sufficient to fit the data above pH 4.35, whereas three are necessary at lower pHs. Furthermore, we do not expect to find the same dynamics in pH ≤ 4.1 solutions, where the protein explores the U and I conformations, as we do in the pH ≥ 4.35 solutions, where the protein samples the more structurally similar I and N.
Discussion
Our results present clear evidence for structural fluctuations of apoMb across several distinguishable characteristic time scales: <10 μs (at all pH values), ≈30 μs (pH ≤ 4.1), ≈100 μs (pH ≥ 4.35), and ≈200 μs (pH ≤ 4.1). We will first consider how the amplitudes and relaxation times from the fit functions relate to dynamics of the protein chain, and then explore the origins of the quenching mechanism enabling observation of the protein dynamics.
Conformational Dynamics of ApoMb Folding.
What physical processes are responsible for the fluorescence fluctuations observed by FCS? There are two general scenarios. First, the fluctuations may correspond to a two-state interconversion between folded and U conformations. In this case, the observed relaxation time would be predicted to exhibit a chevron-like pH dependence, with a maximum near the apparent pKa of the transition, because the folding rate (which dominates at pH > pKa) typically increases as pH increases, and the unfolding rate (which dominates at pH < pKa) usually increases as pH decreases. Alternatively, the fluorescence changes may not arise only from the folding reaction itself, but also from localized dynamic quenching processes because of fluctuations within the partly folded or U states. Here, the relaxation time might be expected to remain relatively constant with pH, unless the motions that give rise to quenching are themselves constrained by pH-dependent structure.
Because a three-component model was favored to fit the FCS data below pH 4.1 and a two-component model above pH 4.35, we consider the two pH regimes separately. ApoMb V1C-AL488 undergoes the I to N folding transition between pH 4.35 and 6.0. The N state is formed with a relaxation time (300–400 ms at pH 6) (26) that is much slower than the diffusion time of the protein, ≈1 ms (SI Fig. 7a). Therefore, FCS measurements in this pH range can be assigned primarily to fluctuations within I and/or within N, and less to their interconversion. Superposition of the spectra of two relaxation times (τA1 = 100 μs and τA2 = 8 μs) adequately describes the fluctuations in this pH range. The amplitudes of both components decrease as the pH increases, suggesting that they primarily reflect conformational dynamics present in the I. Nevertheless, they persist in the N state, suggesting that the “folded” protein is sampling conformations associated with the intermediate state.
Our observations of conformational fluctuations in native apoMb are consistent with numerous reports in the literature that have characterized equilibrium dynamics. NMR studies have shown that at pH 6, a ≈20-aa stretch from the E–F loop to the beginning of the G-helix (residues 82–101) fluctuates between the folded state and unstructured or partially structured states (25). An earlier investigation (35) that examined the effect of mutations on the native and acid denatured states of apoMb concluded that native apoMb fluctuates between several conformations. A third study (36) confirmed that finding by using energy transfer between the C-terminal Tyr and the A-helix Trps in horse apoMb (which has similar stability as sperm whale apoMb studied here) to show that a surprisingly large fraction of N state molecules sampled extended conformations.
The U to I transition occurs between pH 2.6 and 4.1. The fluctuations observed in apoMbV1C-AL488 in this pH range can be described by a superposition of the broad spectra of three relaxation times: τB1 = 200 μs, τB2 = 30 μs, and τB3 = 3 μs. Jamin and coworkers (30) estimated the relaxation time of U/I folding to be 250 μs at 4°C and pH 4.2 (30). The same study reported that the rate increases by a factor of 10 at 20°C, the temperature used in our experiments. These times are consistent with our measurements. However, the relaxation times monitored by FCS are relatively constant from pH 2.6 to 4.2. They do not exhibit a maximum near pK2 (pH 3.4) that would be expected for a pH-dependent conversion between folded and U states. This finding suggests that the observed fluorescence fluctuations are caused by dynamic quenching by fluctuations within conformational states U and I, rather than to interconversion between them. The amplitudes of the two faster fluctuations (B2 and B3) decrease as pH is raised from 2.6 to 4.1, indicating that they reflect motions primarily within U. In contrast, the amplitude of the slowest phase (B1) remains constant over this pH range, signifying that it represents a motion present in both U and I.
It is not surprising that the U state of the protein shows dynamic fluctuations of larger amplitude than the intermediate or N states. Indeed, broadening in NMR spectra of the acid-denatured state of apoMb specifically predicts μs–ms contacts between the N-terminal portion of the protein, where Alexa 488 is located, and a stretch of amino acids that makes up the G-helix in the folded protein (33). More specifically, a second NMR study found native-like interactions between the N-terminal A-helix region and the C-terminal G–H-helix region of acid-unfolded apoMb, indicating the transient formation of compact states in the denatured protein (37).
Contact rates for unstructured polypeptides have been successfully measured by using triplet–triplet energy transfer between exogenous probes (38) or naturally occurring amino acids (39, 40). Two different studies observed that in longer polypeptide chains (>20–30 aa) the contact rates approached those predicted by polymer theory (41, 42). We can thus consider the fluctuations seen in the U state of the protein in the context of their findings. Using the data from these two studies (39, 43), we extrapolated the rates measured for model polypeptides to the most extreme case for apoMb, where the probe and quencher are separated by the entire length of the protein chain, to calculate contact times ranging from 400 ns to 6 μs, depending on the sequence of the model polypeptide. The upper end of these estimates is of the same time scale as the fastest of the fluctuations, τB3 ≈3 μs, that we observe in the U state, and may represent the first contact time between distant parts of the protein chain (38). However, we also observe relaxation times nearly two orders of magnitude slower than τB3. Thus, it is unlikely that the freely jointed Gaussian chain model, even when it takes into account excluded volumes and intrachain interactions, can account for the relatively slow (≤200 μs) relaxation times that we measure. Rather, our findings of slow dynamics emphasize the importance of concerted motions of the protein chain, even in the U states, where secondary and tertiary contacts are thought to be transitory.
Other recent reports in the literature also report a range of time scales for chain dynamics of denatured proteins. In one, single-molecule fluorescence was used to measure a chain reconfiguration time of ≈20 μs for ribonuclease H1, a value in good agreement with at least one of the time scales we observe (44). However, a second single-molecule study reports a reconfiguration time of ≈50 ns for a small cold shock protein (CSP), that becomes slower as the protein folds (45). Although observations of relaxation times this rapid are not within the time resolution of our measurements, CSP is also considerable smaller (66 aa) than apoMb and is known to fold by a two-state mechanism, which may account for its simpler, more rapid chain dynamics.
Quenching Mechanism.
The physico-chemical origins of the fluctuations in the fluorescence signal of apoMb V1C-AL488 are attributed to interactions of the N-terminal Alexa 488 label with amino acids at various parts of the protein chain that quench the fluorescence emission of the dye. Because quenching is a short-range interaction (<2 Å) (46), we assume that quenching events occur via van der Waal's contact between the dye and quencher on a time scale faster than is resolved in these measurements (19). Although the specific quenching mechanisms are not the focus of this study, we did determine which amino acids are most likely to be involved. Trp, Tyr, His, and Met were identified as potential collisional quenchers of Alexa 488 by fluorescence quenching studies of the dye in solutions containing individual amino acids (data not shown). Trp and Tyr are the most efficient quenchers. ApoMb contains two Trp residues (in the A-helix), and three Tyr residues [in the G-helix and near the C terminus (Fig. 1)]. The proximity of the Alexa 488 probe to the two Trp residues in the N state raises the possibility that it is the “flopping” of the dye (which has a long linker) to contact the A-helix that leads to some of the dynamics we observe. However, fluctuations of this type are expected to be on the order of nanoseconds or even shorter (38), significantly faster than detectable in our measurements. Although Met and His are less efficient quenchers than Trp and Tyr, the large number of His residues, (12 His in the first 120 aa of apoMb; Fig. 1) implies additional weak quenching. Because multiple fluctuating components are observed on a broad range of time scales, it is most probable that multiple Alexa 488–residue interactions are responsible for the complexity.
Although our data do not specifically identify which contacts give rise to the observed fluctuations, we may reason from NMR data to consider some of them. The fastest fluctuations (pH ≥ 4.35, τA2 ≈ 8 μs; pH ≤ 4.1, τB3 ≈ 3 μs) may represent contact between Alexa 488 and a proximal amino acid. In the acid-U state (pH 2.6), the A-helix is known to form compact structures (25). The A-helix contains the two Trps in close proximity to the fluorophore, and it is likely that contact made with these quenchers is reflecting the dynamics of the A-helix as it fluctuates between a random and a partially ordered structure. The decreasing amplitudes associated with τA3 and τB3 as the pH increases may be caused by increased stability of the A-helix in the I and N states or decreased access of the Alexa 488 to the Trp quenchers in these more compact structures. The remaining fluctuations are significantly slower (pH ≥ 4.35, τA1 ≈ 100 μs; pH ≤ 4.1, τB1 ≈ 200 μs and τB2 ≈ 30 μs), perhaps slow enough that they may reflect concerted chain motions. In the I state, the A-, G-, and H-helices are present and packed in a native-like core, with restricted flexibility as compared with the remainder of the protein (33). The slow fluctuation found in solutions pH ≥ 4.35 (τA1) is probably motion of the chains outside of this stable core region. As the protein folds, and the remainder of the protein forms a more stable conformation, the amplitude (A1) of this fluctuation decreases to only 3%. Likewise, the 200-μs (τB1) fluctuation is also likely to reflect a motion outside of the A-G-H core region (although not necessarily the same motion); its amplitude is constant across the pH ≤ 4.1 range, indicating it is not affected by the formation of the core as the pH increases from 2.6 to 4.1. Both fluctuations (τA1 and τB1) could be caused by contact of the N terminus with one or more of the His residues, the majority of which are located in the B–F-helices.
A number of studies using FCS characterize protein fluctuations; however, each of those studies has shown relatively simple, single exponential kinetics (20–22, 24). In the case of cytochrome c, the quenching mechanism is between the fluorophore and the heme group of the protein, and thus single exponential kinetics might be expected (22, 24). In a study by Chattopadhyay et al. (21), a protein was labeled with two fluorophores and monitored for self-quenching of these fluorophores, again anticipating a single mechanism that may be expected to give rise to a single relaxation time. In their earlier study, a single fluorophore was used, as in this study; nevertheless, only a single fluctuating component was observed. The more complex kinetics that we observe are undoubtedly caused by multiple interactions from complex chain motions that result in quenching of Alexa 488.
The correlation function we used to fit the data assumes a model with some number of independent quenching events. It is possible that choosing a different model will result in a different analytical form of the correlation function. Here, we have cautiously used the simplest models appropriate to interpret our data. Because the differences in time scales between each of the relaxation times we observe at each pH are roughly an order of magnitude, we have confidence in the broad kinetics we observe and resolve with our multivariate quenching mechanism. We have also enabled measurement of more complicated kinetics than have been previously accessible by our use of an expanded focal volume geometry for longer diffusion times (≈1 ms) of the protein, thus extending our sensitivity to longer time scales of structural fluctuations. In a smaller focal volume, the structural fluctuations τA1 and τB1 (≈100–200 μs) approach the protein diffusion time (≈150–250 μs) and thus are not separable from diffusion. The faster fluctuations we measure (τA2, τB2, and τB3) are similar in time scale to those measured in the above studies. It is appropriate to repeat the caveat that our choice of fitting the observed fluctuation correlation data with the smallest number of exponential decay times sufficient to fit the data represents a distribution of fluctuations consisting of a superposition of fluorescence quenching events. Because fluctuation correlations are frequently represented in frequency domain, rather than in the temporal domain that we have used for our measurements, Fourier transforms of fluctuation time scales as yielded from our fits are presented in SI Fig. 8 at pH-distinguished conformations: U, I, and N.
Conclusions
Remarkably complex, dynamic information about the broadband conformational fluctuations of the archetypal protein apoMb has been extracted without perturbing the system equilibria. As expected from other studies, the measured diffusion times τD and corresponding hydrodynamic radii of apoMb are found to expand by ≈40% in the acid denatured state from the folded state. Of greater importance, we have found and have been able to characterize structural fluctuations of apoMb over approximately two orders of magnitude in time scale, as they vary with the folded, molten globule, and denatured states. Four distinguishable exponential relaxation times represent the broad conformational fluctuation spectra, revealing a general trend in slowing of the fluctuations concurrent with an increase in their associated amplitudes upon denaturation of the protein. This research has demonstrated that FCS can be a powerful tool for the study of protein folding-associated conformational fluctuations. Future directions aim to distinguish the complex behavior observed here. These studies may benefit from use of double-labeled protein with a specific quenching mechanism, as well as mutations of amino acids thought to be responsible for quenching. It may be particularly interesting to monitor by FCS the fluctuations associated with the known transitions of apoMb from an assembly of α-helices to reported β-ribbon structures and aggregates that have been observed under aggressive conditions (2, 3).
Materials and Methods
Protein Expression and Labeling.
ApoMb V1C was cloned, expressed, and purified as described (29). In all subsequent experiments, the buffers used were 5 mM citrate, 20 mM NaCl, with pH adjusted from 2.6 to 6.3. For details of labeling, purification, and characterization see SI Text.
FCS Measurements.
FCS measurements were made on an instrument assembled in our laboratory, similar to one described in ref. 9. Data analysis was done in Origin 7.0 (OriginLab, Northampton, MA). Sufficiently low laser intensity (≈6 μW before the objective) was used to ensure the molecules did not photobleach nor display triplet-state photophysics (see SI Text).
Modeling of FCS Data.
The autocorrelation function G(t) is defined as:
where F(Δt) is the fluorescence measured at delay time Δt and δF(t) = F(t) − <F(t)〉. For solutions that contain only a single species diffusing in three dimensions, the correlation curves can be fitted with:
 |
where N is the mean number of molecules in the focal volume, τD is their diffusion time, and ω is the experimentally determined ratio of the axial to radial dimensions of the observation volume. If the species of interest is undergoing conformational fluctuations among multiple states that can be distinguished by their relative fluorescence quantum yields, and assuming no detectable change in τD between the two states,‖ then the correlation function can be written as (6, 47, 48):
where GF(t) represents the contribution of the fluctuations to the correlation function. In our optical set-up, the back aperture of the objective was underfilled to create an enlarged focal volume resulting in an increase in the diffusion time of the protein (τD). A longer τD allows for better separation of the contributions to the correlation function caused by diffusion (GD) from those caused by the conformational fluctuations (GF), thereby accommodating accurate determination of the time scales of the fluctuations. In its most general form (47, 49):
where λi and Ai are the eigenvalues and eigenvectors of the matrix that describes the time evolution caused by kinetics of the species of interest.
In modeling the simplest case, a species fluctuating between two states, the equation used is generally in one of these two forms shown:
 |
where τA is the relaxation time of the isomerization, A is the fraction of molecules in the isomerized state,** and Aeq = A/(1 − A) can be explicitly written out as a function of the equilibrium rate constants and the various quantum yields of the states (6, 47).
For more complex systems, where there are multiple fluorescent states of essentially equal diffusivities‖ with multiple characteristic time scales that describe the transitions between these states, Eq. 4 can be expanded in a straightforward manner:
 |
Supplementary Material
Acknowledgments
We thank David Eliezer for careful reading of the manuscript and Mark Williams for help in formatting the manuscript. H.C., E.R., and W.W.W. were supported by National Cancer Institute Grant R01-CA116583-01, National Institute of Biomedical Imaging and Bioengineering Grant 9 P41 EB001976, and National Institute on Aging Grant 1-R21-AG026650. J.S.B. and S.N.L. were supported by a National Institute of General Medical Sciences grant.
Abbreviations
- apoMb
apomyoglobin
- FCS
fluorescence correlation spectroscopy
- U state
unfolded state
- N state
native state
- I
equilibrium mixture of Ia and Ib.
Footnotes
The authors declare no conflict of interest.
This article contains supporting information online at www.pnas.org/cgi/content/full/0704073104/DC1.
Simulations and experiments have shown that for FCS to distinguish two molecular species from each other in a mixture based on diffusing size alone their τDs must differ by at least a factor of 1.6. Although we find that τD increases as the protein unfolds, the maximum ratio is that of τD (pH 2.6 = unfolded) to τD (pH 6.3 = folded), which is ≈1.4. Thus, we assume that even if the protein is sampling the entire range of conformations at a given pH, we can model its diffusion with a single τD.
A is frequently referred to as an amplitude, as it reflects the amount of the correlation signal that can be attributed to conformational fluctuations.
References
- 1.Parak FG, Nienhaus GU. Chemphyschem. 2002;3:249–254. doi: 10.1002/1439-7641(20020315)3:3<249::AID-CPHC249>3.0.CO;2-A. [DOI] [PubMed] [Google Scholar]
- 2.Fandrich M, Fletcher MA, Dobson CM. Nature. 2001;410:165–166. doi: 10.1038/35065514. [DOI] [PubMed] [Google Scholar]
- 3.Chiti F, Dobson CM. Annu Rev Biochem. 2006;75:333–366. doi: 10.1146/annurev.biochem.75.101304.123901. [DOI] [PubMed] [Google Scholar]
- 4.Magde D, Elson E, Webb WW. Phys Rev Lett. 1972;29:705–708. [Google Scholar]
- 5.Elson EL, Magde D. Biopolymers. 1974;13:1–27. doi: 10.1002/bip.1974.360130103. [DOI] [PubMed] [Google Scholar]
- 6.Magde D, Elson EL, Webb WW. Biopolymers. 1974;13:29–61. doi: 10.1002/bip.1974.360130103. [DOI] [PubMed] [Google Scholar]
- 7.Eigen M, Rigler R. Proc Natl Acad Sci USA. 1994;91:5740–5747. doi: 10.1073/pnas.91.13.5740. [DOI] [PMC free article] [PubMed] [Google Scholar]
- 8.Rigler R, Elson ES. In: Chem Phys. Schafer FP, Toennies JP, Zinth W, editors. Berlin: Springer; 2001. p. 487. [Google Scholar]
- 9.Haupts U, Maiti S, Schwille P, Webb WW. Proc Natl Acad Sci USA. 1998;95:13573–13578. doi: 10.1073/pnas.95.23.13573. [DOI] [PMC free article] [PubMed] [Google Scholar]
- 10.Petersen NO, Elson EL. Methods Enzymol. 1986;130:454–484. doi: 10.1016/0076-6879(86)30021-1. [DOI] [PubMed] [Google Scholar]
- 11.Widengren J, Mets U, Rigler R. J Phys Chem. 1995;99:13368–13379. [Google Scholar]
- 12.Kim HD, Nienhaus GU, Ha T, Orr JW, Williamson JR, Chu S. Proc Natl Acad Sci USA. 2002;99:4284–4289. doi: 10.1073/pnas.032077799. [DOI] [PMC free article] [PubMed] [Google Scholar]
- 13.Kim J, Doose S, Neuweiler H, Sauer M. Nucleic Acids Res. 2006;34:2516–2527. doi: 10.1093/nar/gkl221. [DOI] [PMC free article] [PubMed] [Google Scholar]
- 14.Li HT, Ren XJ, Ying LM, Balasubramanian S, Klenerman D. Proc Natl Acad Sci USA. 2004;101:14425–14430. doi: 10.1073/pnas.0404295101. [DOI] [PMC free article] [PubMed] [Google Scholar]
- 15.Wallace MI, Ying LM, Balasubramanian S, Klenerman D. J Phys Chem B. 2000;104:11551–11555. [Google Scholar]
- 16.Edman L, Mets U, Rigler R. Proc Natl Acad Sci USA. 1996;93:6710–6715. doi: 10.1073/pnas.93.13.6710. [DOI] [PMC free article] [PubMed] [Google Scholar]
- 17.Jung JY, Van Orden A. J Am Chem Soc. 2006;128:1240–1249. doi: 10.1021/ja0560736. [DOI] [PubMed] [Google Scholar]
- 18.Jung JM, Van Orden A. J Phys Chem B. 2005;109:3648–3657. doi: 10.1021/jp0453515. [DOI] [PubMed] [Google Scholar]
- 19.Neuweiler H, Doose S, Sauer M. Proc Natl Acad Sci USA. 2005;102:16650–16655. doi: 10.1073/pnas.0507351102. [DOI] [PMC free article] [PubMed] [Google Scholar]
- 20.Chattopadhyay K, Saffarian S, Elson EL, Frieden C. Proc Natl Acad Sci USA. 2002;99:14171–14176. doi: 10.1073/pnas.172524899. [DOI] [PMC free article] [PubMed] [Google Scholar]
- 21.Chattopadhyay K, Elson EL, Frieden C. Proc Natl Acad Sci USA. 2005;102:2385–2389. doi: 10.1073/pnas.0500127102. [DOI] [PMC free article] [PubMed] [Google Scholar]
- 22.Rischel C, Jorgensen LE, Foldes-Papp Z. J Phys Condens Matter. 2003;15:S1725–S1735. [Google Scholar]
- 23.Margittai M, Widengren J, Schweinberger E, Schroder GF, Felekyan S, Haustein E, Konig M, Fasshauer D, Grubmuller H, Jahn R, Seidel CAM. Proc Natl Acad Sci USA. 2003;100:15516–15521. doi: 10.1073/pnas.2331232100. [DOI] [PMC free article] [PubMed] [Google Scholar]
- 24.Werner JH, Joggerst R, Dyer RB, Goodwin PM. Proc Natl Acad Sci USA. 2006;103:11130–11135. doi: 10.1073/pnas.0604712103. [DOI] [PMC free article] [PubMed] [Google Scholar]
- 25.Eliezer D, Wright PE. J Mol Biol. 1996;263:531–538. doi: 10.1006/jmbi.1996.0596. [DOI] [PubMed] [Google Scholar]
- 26.Jamin M, Baldwin RL. J Mol Biol. 1998;276:491–504. doi: 10.1006/jmbi.1997.1543. [DOI] [PubMed] [Google Scholar]
- 27.Kay MS, Baldwin RL. Nat Struct Biol. 1996;3:439–445. doi: 10.1038/nsb0596-439. [DOI] [PubMed] [Google Scholar]
- 28.Hughson FM, Barrick D, Baldwin RL. Biochemistry. 1991;30:4113–4118. doi: 10.1021/bi00231a001. [DOI] [PubMed] [Google Scholar]
- 29.Ha JH, Loh SN. Nat Struct Biol. 1998;5:730–737. doi: 10.1038/1436. [DOI] [PubMed] [Google Scholar]
- 30.Weisbuch S, Gerard F, Pasdeloup M, Cappadoro J, Dupont Y, Jamin M. Biochemistry. 2005;44:7013–7023. doi: 10.1021/bi047372v. [DOI] [PubMed] [Google Scholar]
- 31.Hughson FM, Wright PE, Baldwin RL. Science. 1990;249:1544–1548. doi: 10.1126/science.2218495. [DOI] [PubMed] [Google Scholar]
- 32.Yao J, Chung J, Eliezer D, Wright PE, Dyson HJ. Biochemistry. 2001;40:3561–3571. doi: 10.1021/bi002776i. [DOI] [PubMed] [Google Scholar]
- 33.Eliezer D, Yao J, Dyson HJ, Wright PE. Nat Struct Biol. 1998;5:148–155. doi: 10.1038/nsb0298-148. [DOI] [PubMed] [Google Scholar]
- 34.Tcherkasskaya O, Uversky VN. Protein Struct Funct Genet. 2001;44:244–254. doi: 10.1002/prot.1089. [DOI] [PubMed] [Google Scholar]
- 35.Lin L, Pinker RJ, Forde K, Rose GD, Kallenbach NR. Nat Struct Biol. 1994;1:447–452. doi: 10.1038/nsb0794-447. [DOI] [PubMed] [Google Scholar]
- 36.Rischel C, Thyberg P, Rigler R, Poulsen FM. J Mol Biol. 1996;257:877–885. doi: 10.1006/jmbi.1996.0208. [DOI] [PubMed] [Google Scholar]
- 37.Lietzow MA, Jamin M, Dyson HJ, Wright PE. J Mol Biol. 2002;322:655–662. doi: 10.1016/s0022-2836(02)00847-1. [DOI] [PubMed] [Google Scholar]
- 38.Bieri O, Wirz J, Hellrung B, Schutkowski M, Drewello M, Kiefhaber T. Proc Natl Acad Sci USA. 1999;96:9597–9601. doi: 10.1073/pnas.96.17.9597. [DOI] [PMC free article] [PubMed] [Google Scholar]
- 39.Lapidus LJ, Eaton WA, Hofrichter J. Proc Natl Acad Sci USA. 2000;97:7220–7225. doi: 10.1073/pnas.97.13.7220. [DOI] [PMC free article] [PubMed] [Google Scholar]
- 40.Lapidus LJ, Steinbach PJ, Eaton WA, Szabo A, Hofrichter J. J Phys Chem B. 2002;106:11628–11640. [Google Scholar]
- 41.Flory PJ. Principles of Polymer Chemistry. Ithaca, NY: Cornell Univ Press; 1953. [Google Scholar]
- 42.Szabo A, Schulten K, Schulten Z. J Chem Phys. 1980;72:4350–4357. [Google Scholar]
- 43.Krieger F, Fierz B, Bieri O, Drewello M, Kiefhaber T. J Mol Biol. 2003;332:265–274. doi: 10.1016/s0022-2836(03)00892-1. [DOI] [PubMed] [Google Scholar]
- 44.Kuzmenkina EV, Heyes CD, Nienhaus GU. Proc Natl Acad Sci USA. 2005;102:15471–15476. doi: 10.1073/pnas.0507728102. [DOI] [PMC free article] [PubMed] [Google Scholar]
- 45.Nettels D, Gopich IV, Hoffmann A, Schuler B. Proc Natl Acad Sci USA. 2007;104:2655–2660. doi: 10.1073/pnas.0611093104. [DOI] [PMC free article] [PubMed] [Google Scholar]
- 46.Lakowicz JR. Principles of Fluorescence Spectroscopy. New York: Springer; 2006. [Google Scholar]
- 47.Palmer AG, Thompson NL. Biophys J. 1987;51:339–343. doi: 10.1016/S0006-3495(87)83340-4. [DOI] [PMC free article] [PubMed] [Google Scholar]
- 48.Meseth U, Wohland T, Rigler R, Vogel H. Biophys J. 1999;76:1619–1631. doi: 10.1016/S0006-3495(99)77321-2. [DOI] [PMC free article] [PubMed] [Google Scholar]
- 49.Widengren J, Rigler R, Mets U. J Fluorescence. 1994;4:255–258. doi: 10.1007/BF01878460. [DOI] [PubMed] [Google Scholar]
Associated Data
This section collects any data citations, data availability statements, or supplementary materials included in this article.