

Abstract
Gaining a detailed understanding of the energetics of the proton pumping process in cytochrome c oxidase (CcO) is one of the challenges of modern biophysics. Although there are several current mechanistic proposals, most of these ideas have not been subjected to consistent structure-function considerations. In particular most works have not related the activation barriers for different mechanistic proposals to the protein structure. The present work describes a general approach for exploring the energetics of different feasible models of the action of CcO, using the observed protein structure, established simulation methods and a modified Marcus’ formulation. We start by reviewing our methods for evaluation of the energy diagrams for different proton translocation paths and then present a systematic analysis of various constraints that should be imposed on any energy diagram for the pumping process. After the general analysis we turn to the actual computational study, where we construct energy diagrams for forward and backward paths, using the estimated calculated reduction potentials and pKa values of all the relevant sites (including internal water molecules). We then explore the relationship between the calculated energy diagrams and key experimental constraints. This comparison allows us to identify some barriers that are not fully consistent with the overall requirement for an efficient pumping. In particular we identify back leakage channels, which are hard to block without stopping the forward channels. This helps to identify open problems that will require further experimental and theoretical studies. We also consider reasonable adjustments of the calculated barriers that may lead to a working pump. Although the present analysis does not establish a unique and workable model for the mechanism of CcO, it presents what is probably the most consistent current analysis of the barriers for different feasible pathways. Perhaps more importantly, the framework developed here should provide a general way for examining any proposal for the action of CcO as well as for the analysis of further experimental findings about the action of this fascinating system.
Keywords: Cytochrome c Oxidase, Coupled electron transfer-proton transfer, Proton pumps, Dielectric of proteins, Computer simulations, Electrostatic effects
1 Introduction
Cytochrome c oxidase (CcO) couples the four electron reduction of O2 to water and transmembrane proton transfer, e.g. [1–3], which results in an electrochemical proton gradient that drives ATP synthesis. The elucidation of the structure of CcO [4, 5] and mutational studies (e.g. [3, 6–8]) as well as other important studies (for recent reviews see references [9, 10]) provided the opportunity to analyze on a molecular level coupled electron transfer/proton transfer (ET/PT) in one of the most intriguing molecular machinery, which has presented longstanding conceptual challenge in the field of bioenergetics.
In trying to obtain a detailed structure-function correlation for CcO it is important to understand the energetics and the time dependence of the pumping process. This challenge can be addressed by computer modeling approaches and some elements of the CcO reaction have already been examined by simulation methods[11–15]. However, the relationship between the protein structure and the proton translocation (PTR) energetics and directionality has not been established. For example, the calculations of Olkhova et al [12] have provided important insight about the electrostatic coupling but did not address the energetics of the pumping process. The chemical steps were recently studied by detailed quantum mechanical calculations[16], but this instructive study did not explore the energetics of pumping the protons across the membrane. The studies of Stuchebrukhov et al [17] and Wikström et al [11] considered the possibility of PTR through water molecules in the hydrophobic region between heme a and heme a3, and the study of Wikström et al [11] provided an insightful attempt to establish a gating mechanism by considering the orientation of these water molecules. Although this study did not explore the actual PTR process, it nevertheless raised a crucial question about the identity of the gates that controls the uphill PTR. The nature of the pumping process was considered by Mills and Ferguson-Miller [18] who assessed the evidences for direct and indirect coupling mechanisms, where the indirect mechanism involves conformational and pKa changes. The details of a conformational mechanism have been considered by Brzezinski and coworkers [10, 19]. Although this proposal has appealing aspects, it cannot be verified without specific tools of converting structures to pKa values.
It seems to us that further advances in obtaining a detailed mechanism of CcO requires a molecular modeling approach that can convert the structure of CcO to an effective potential with well defined activation barriers and to a time-dependant description of the coupled ET/PT process. In order to move in this direction we start by presenting a systematic analysis of the experimental constraints on the energetics of CcO. We then review our general approach for obtaining general energy diagrams for coupled electron transfer/proton transfer processes [20, 21]. Next we use this approach to explore the energetics for different feasible pathways and use the discrepancy between the calculated diagrams and the experimental and conceptual constraints to identify key open questions. Finally, we provide a discussion of the open problems in the field and the likelihood of different alternative mechanisms.
2 Introductory considerations of energy diagrams
The functional parts of CcO are described in Fig 1. This system reduces one molecule of oxygen to two water molecules, using four electrons and four protons in the cycle described schematically in Fig 2. The electrons are supplied by cytochrome c located on the P-side of the membrane, and the protons are taken up from the bulk solution at the N-side of the membrane. Cytochrome c oxidase has four redox active metal centers, of which two, heme a3 and CuB, constitute a binuclear center (BNC) where the reduction of molecular oxygen to water takes place (see Fig 1). The electrons from cytochrome c enter the enzyme via a di-copper complex, CuA, and is then transferred to the BNC via a low-spin heme, heme a, located close to the BNC. In addition, a tyrosine residue, which is covalently cross-linked to one of the histidine ligands on CuB, is believed to be redox active[5, 22]. The protons enter the enzyme from the N-side of the membrane, via two well characterized proton channels, the D- and the K-channel, both ending in the vicinity of the BNC. All translocated protons and two or three of the chemical protons use the D-channel[23]. The exit path for the translocated protons has not been identified. Molecular oxygen reacts with the two-electron reduced state R (Fe(II) and Cu(I)), releasing the two water molecules formed in the previous cycle, and forming the spectroscopically characterized oxy-heme intermediate, labeled compound A, see Fig. 2. In the next step the O-O bond is cleaved with no further supply of electrons or protons from outside the membrane, yielding the intermediate PM with Fe(IV)=O, Cu(II)-OH and a neutral tyrosyl radical [22, 24, 25]. From this point the rest of the catalytic cycle occurs in four steps, where in each step one electron and one proton is transferred to the BNC for the chemistry, and one proton is translocated from the N-side to the P-side of the membrane [26]. The first electron goes to the tyrosyl radical, while the following three electrons stepwise reduce the two metal centers. The intermediates are usually labeled as F (Fe(IV) and Cu(II)), O (Fe(III) and Cu(II), E (Fe(III) and Cu(I) and R (Fe(II) and Cu(I)) (see Fig. 2). It should be noted that the exact protonation state of the different intermediates has not been determined experimentally, and different possibilities have been tested in calculations [27, 28].
Figure 1.

Showing a schematic description of the key elements in the CcO system. The figure considers the pumping elements and the electron (red arrows) and proton (yellow arrows) pathways through the trans-membrane region of the enzyme, i.e. the CuA, the heme a, and the heme a3-CuB binuclear reaction center for the ET; and the conserved E286 residue, the O2 in the binuclear reaction center, intervening water molecules, and the D-propionic and R481 pair where the pumped H+ are believed to leave the mechanistic pumping region.
Figure 2.
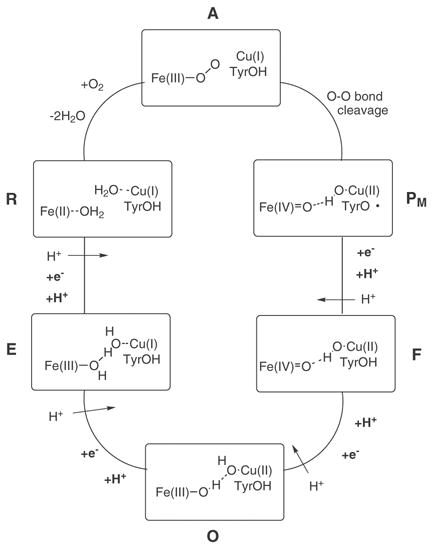
Showing schematically the overall cycle of CcO. The enzymatic CcO reaction goes through a 4-step cyclic reaction where in each step the reaction center is reduced and one of the O atoms is protonated, and the energy is at each step used to pump an H+ across the membrane. Other studies suggest that the pumping actually occurs concomitantly with enzyme reduction.
From the redox potentials of cytocrome c and molecular oxygen it can be concluded that the reduction of one O2 molecule is exergonic by about 2 eV (46 kcal/mol) if there is no electrochemical gradient present across the membrane. Since the redox chemistry and the proton translocation together correspond to the motion of 8 charges across the membrane per O2 molecule reduced, a gradient is built up when the reaction proceeds. From experiments it is known that for the working enzyme the gradient across the membrane is about 200 mV. This gradient can be established by a pH difference or by electrostatic gradient. Thus, with full gradient the exergonicity of the overall reaction is reduced to 2.0 − 8×0.2 =0.4 eV (9 kcal/mol). The R to PM step has to be exergonic, since the compound PM has been observed in experiments on the mixed valence form of the enzyme. Calculations indicate that a reasonable value for this exergonicity is 5 kcal/mol. This leaves 41 kcal/mol for the four steps from PM to R without gradient, and 4 kcal/mol with full gradient. It is normally assumed that the pumping mechanism is the same in all four steps, and the most reasonable assumption for the energetics is that the exergonicity is equally partitioned between the steps. Thus, it is assumed here that each of the pumping steps is exergonic by 10.2 kcal/mol with no gradient across the membrane, and by only 1 kcal/mol with full gradient.
In this work we will try to explore the detailed mechanism of CcO focusing on one quarter of the overall cycle, namely, on the O→R step.
In order to analyze the details of the pumping of the steps considered in Fig. 2, it is essential to have reasonable estimates of the rate constants of the individual elementary steps that lead from the initial to final configurations. Obviously this is an extremely challenging task since there are many feasible ways of moving the protons and the electrons. Thus it is important to start by labeling the feasible configurations of the system using a clear notation. Here it may be convenient to use the notation demonstrated in Fig 3, which was used in our earlier studies [20, 21]. However, in the present work we found it is useful to have a simpler shorthand notation for the purpose of dealing with more complex analysis and more general discussions. Thus we also introduce here a simplified state description of the type shown in white in Fig 3.
Figure 3.

Illustrating the notation used in our state diagrams. The figure depicts the groups included in the present study and the label used for each group. The joint boxes in the lower part illustrate our shorthand notation where we arrange our diagram according to the order of each element and designate each state by its charged state. The upper row depicts the electron population on the redox centers (heme a, heme a3 and CuB centers), the middle row shows the protonation state of the vectorial pKa groups from the N-side to the P-side, and the lower row shows the protonation state of the pKa groups to the bound oxygen.
This energetics of the system will be evaluated by the method described below, considering explicitly different barriers that correspond to different elementary PTR and ET steps. The resulting diagrams (see below) can be overwhelming by the complexity of the options presented. However, theses diagrams can serve as an introduction for the challenge posed by a complete energy based analysis of CcO. The real challenge is of course, to verify the heights of the different barriers and to reach a consensus diagram. Some necessary steps in this direction will be described below.
3 Estimating the free energy profiles
In order to quantify the energy profiles discussed in the previous section it is important to have a way to evaluate the energetic of the different configurations and the barriers between theses configurations. Our strategy for accomplishing this task is based on using Marcus’ type state diagrams in the quantitative framework of the empirical valence bond (EVB) approach[29]. In this description we start by combining our early picture of ET [30] and PT[31, 32] and obtain a general expression for the free energy of each feasible state of the system by
| (1) |
where m designates the vector of the charged states of the given configuration i.e. . “i” runs over the site of proton donors and acceptors, “k” over the sites of electron donor and acceptors and “j” runs over both the “i” and “k” series. Here is the actual charge of the ith group at the mth configuration. This can be 0 or −1 for acids and 0 or 1 for bases (where we for simplicity restrict our formulation to mono ions). ΔIk,qw is the free energy of taking the kth group in solution, and changing its charge from zero to the actual value when this group is ionized (this free energy is obtained from the corresponding reduction potential). The Wijqiqj term represents the charge-charge interaction effect. The intrinsic pKa (pKint) is the pKa that the given ionizable group would have if all other ionizable groups were kept at their neutral state (the evaluation of this term is described in ref. [33]). The u(m)-term represents the interaction of the membrane potential with the transferred charges. The ΔN(m) is the number of protons transferred from the N-side of the membrane to the P-side. The actual effect of the membrane potential can be complex and thus we focus on cases where the membrane potential is zero and the gradient is established by a pH gradient. In this case the electrostatic potential from the H+ ions at a concentration of 10−4 M is negligible especially considering counter ions. In other words, our main point is to provide estimates for the pumping times and a basis for simulations. Now as shown in our study of ion channels, e.g. ref [34] we can simulate cases with both concentrations and potential gradients, but the case with concentration gradient is more straightforward.
Eq (1) can also be expressed in terms of the energy of forming the given configuration in a reference state (in this case in aqueous solution) at infinite separation of the ions and then transforming it into the protein. This gives, see e.g. refs. [30, 31].
| (2) |
Where represents formally the energy of moving qi from water to its actual protein site when all other ionizable groups are neutral and ΔVQQ is the charge-charge interaction term. In the actual calculation we also include in ΔΔGsol the solvation of the neutral form of the given group [33].
The activation free energy for a transfer from state m to state m′ can now be evaluated by the EVB concepts and Eq (2). This allows us to describe any system and its dependence on the general solvent coordinate.
In principle we can evaluate the free energy functions for each transfer by the EVB microscopic simulations and run time-dependent simulations by using a simplified EVB/LD model[35]. Here, however, we are mainly interested in the energetics and thus we can use a semi quantitative estimate for each step. For example, when the transfer from m to m′ involves only one PT or one ET the activation energy is given by [21]:
| (3) |
where ΔGmm′ is the free energy change for transfer between state m and m′, and λmm′ is the corresponding reorganization energy (that can be evaluated as described elsewhere [29]). Hmm′ is the off-diagonal element that mixes the states m and m′. This term is taken as the EVB coupling term for PT between a donor and acceptor and the relevant coupling term (the tunneling matrix element) for an ET step. The proper coupling can also be evaluated for a concerted PT and for an ET/PT process (for a related treatment see ref [36]).
The rate constant for each step is obtained by using transition state theory (see e.g. reference[29]) for adiabatic PT steps and the semi classical treatment of diabatic ET theory (see e.g. reference [37]) for the ET steps. That is, we use for the PT steps the relationship and for ET steps the relationship
| (4) |
and for ET steps the relationship
| (5) |
With the above picture in mind we can focus on the ΔGmm′, which determine the trend in the corresponding Δgmm′‡ term. The evaluation of this term depends, as is clear from Eq 2, on the relevant reduction potentials and pKa values as well as on the ΔΔGsolv and the Wjj′ terms. The most crucial term is the ΔΔGsolv solvation term. This term is evaluated by the linear response approximation (LRA) version of the semi macroscopic protein dipoles Langevin dipole model (PDLD/S). Since this approach, the PDLD/S-LRA, has been used in studies of pKa values and reduction potentials in proteins and discussed extensively elsewhere, e.g. references [33, 38, 39], it will not be addressed here. The Wjj′ interaction term is evaluated using
| (6) |
where is given in kcal/mol, rjj′ is the distance between the groups i and j, while εjj′ (rjj′) is an effective dielectric function for charge-charge interaction given by
| (7) |
where we use ε′ values between 40 and 10 and a value of (we used these values to establish the upper and lower limits of our conclusions), while we used μ=0.18 Å−1. The physical justification of Eq 6 and the reliability of our εij are discussed in previous extensive studies, e.g. [33, 40].
The pKa values and reduction potentials of the ionizable groups in Eq 2 were obtained (see Table 1) with the PDLD/S-LRA approach according to standard protocol using the MOLARIS program [41, 42] (see also ref [43]and references therein). Starting from the X-ray structure of CcO (pdb entry 1M56 in the Brookhaven protein database [44]), the pKa values and reduction potentials were averaged over 50 protein configurations that were obtained at each 1 ps from a 50 ps molecular dynamics simulation. The simulations used the ENZYMIX force-field [42] and a step-size of 0.5 fs. The effect of the low dielectric of the membrane was not considered since the distance of the membranes region from most of the groups studied is relatively large (a more systematic study will be used in the future).
Table 1.
Relative energies for different states(a).
| State | expression | ΔG(m) ε′=60 | |
|---|---|---|---|
| 0 | HHaP−B−a3H | ΔG(6)(I) | −0.55 |
| I | HHa−P−B−a3H | 0 | 0.00 |
| II | Ha−P−B−a3HH | ΔG(1) | 2.76 |
| II′ | Ha−PHB−a3H | ΔG(2)(II′) | 9.70 |
| III | Ha−P−BHa3H | ΔG(3)(III) | 0.64 |
| IV′ | HHa−PHB− a3 | ΔG(2)(II′) | 6.94 |
| V′ | HHaPHB−a3− | ΔG(2)(II)+ΔG(4)(V)−ΔG(1) | 4.02 |
| VI | HaP−B−a3−HH | ΔG(4)(V)+ΔG(1) | 0.05 |
| VII | HaP−BHa3−H | ΔGX − ΔG(1) | −4.72 |
| VIII | a−P−BHa3HH | ΔGIII+ΔG(1) | 3.40 |
| IX | aPHBHa3−H | ΔGX+ΔG(2)(X) | 5.55 |
| X | aP−BHa3−HH | ΔG(3)(I)+ΔG(4)(III)+2·ΔG(1) | −1.96 |
| XI | HHaP−B−a3−H | ΔG(4)(I) | −2.71 |
| XII | HHHaP−B−a3 | −ΔG(1) −ΔG(6)(I) | −3.31 |
Energies in kcal/mol. P designates Prd, B− designates the iron bound OH− and BH designates the iron bound water. The various ΔG(i) are given by ΔG(1) =−1.38(pHP – pHN)), where we used here values of 6 and 4 for pHN and pHP, respectively, ΔG(2)(α)=1.38(pHN – pKa(PH))(α); ΔG(3)(α) =1.38(pHN – pKa(BH))(α); ΔG(4)(α) = ΔI(a−a3 → a a3−)α; ΔG(5)(α)=1.38(pKa(PH) – pKa(BH))(α) and ΔG(6)(α) = ΔI(D−a – Da−), where D is Cua. The occupancy of two of the electron sites, heme a and heme a3 here denoted by ‘a’ and ‘a3’, are indicated by the negative charge, whereas the occupancy of key proton sites, the α-propionic group on heme a3 and the water bound to Fe on heme a3 here denoted by ‘P’ and ‘B’, are indicated by ‘H’. In the initial state we have 2 protons on the N side of the membrane and 1 on the P side (the ‘H’s to the left of ‘a’ and right of ‘a3’), whereas the two proton acceptors are unoccupied as indicated by the ‘−’ charge.
While the classical electrostatic simulations provide probably the most effective current way for studying the energetics of different states in the protein, it is also essential to establish the chemical energy of the different cofactors in their different state. This is done by quantum mechanical (QM) calculations. The general strategy for these calculations has been to use the smallest possible, but still reasonably adequate, model of the active site. This means keeping first sphere ligands but avoiding outer sphere ligands that do not form strong hydrogen bonds to a group involved in the reaction. Second sphere charged ligands should in general be kept. The peptide chains and parts connecting the peptide to the functional groups can in general be avoided. These important reductions of the models have been tested in a number of studies [45]. Still, the models are not always small by conventional standards, but each extension of the model has been carefully motivated. The largest model contains about 155 atoms, all described quantum mechanically.
The QM models were chosen to give as reliable relative electron and proton affinities as possible for the different redox and protonatable sites in the BNC, and therefore a fully substituted heme was used in the model of the heme a3 part of the BNC. Furthermore, the immediate surrounding of the heme propionates were included, i.e. Arg438 saltbridging to Prd and Asp364 which is hydrogen bonding to the α-propionate, and also a few water molecules surrounding the heme. The CuB part of the BNC was described as a copper complex with three imidazoles modeling the three histidine ligands and a phenol modeling Tyr244, which is covalently linked to one of the histidine ligands, and which is thought to be redox active.
The quantum chemical models of the BNC were built starting from the crystal structure in ref[5]. One aspect of the modeling procedure is to freeze a few atoms from the crystal structure to mimic the strain from the surrounding protein. Essentially one atom in each amino acid model, the one closest to the backbone, was frozen. Apart from the frozen atoms the geometries of the models were fully optimized using Becke’s [46–48] three parameter hybrid exchange functional combined with the Lee-Yang-Parr [49] correlation functional (B3LYP). The calculations were performed with the JAGUAR program [50]. The optimizations were performed with the lacvp double-zeta quality basis set using an effective core potential (ECP) on iron and copper. The open shell systems were treated using unrestricted B3LYP.
The final energies for the optimized geometries were evaluated using the B3LYP functional and the lacv3p* basis set of JAGUAR, which is a triple-zeta basis set with an ECP on the metals, and which includes one polarization function on the heavy atoms. The dielectric effects from the surrounding environment were obtained for all stationary points using the Jaguar self-consistent reaction field method [51, 52], using the lacvp basis set and with the dielectric constant set equal to 4. The probe radius of the solvent was set to 2.5 Å. Obviously this dielectric treatment does not provide a realistic description of the effect of the protein/solvent environment and its screening effect (e.g. see ref [33, 40]). Thus we will leave case that requires an accurate description of the effect of the protein environment to the PDLD/S-LRA treatment. However, for states that do not involve a major charge separation we will consider the QM results as reasonable estimates.
The accuracy of the B3LYP functional has been tested in the extended G3 benchmark set [53], which consists of enthalpies of formation, ionization potentials, electron affinities and proton affinities for molecules containing first- and second-row atoms. The B3LYP functional gives an average error of 4.3 kcal/mol [53] for 376 different molecules. Due to the lack of accurate experimental data for transition metals there are no benchmark tests. Normal metal-ligand bond strengths indicate that the errors are in the 3–5 kcal/mol range [54], and this is the expected accuracy of the present calculations for cases where the dielectric effect of the environment does not play a major role.
Considering the difficulties of obtaining absolute redox energies and pKa’s by QM calculations we only considered the redox potentials relative to the electron donor, cytochrome c, with E0=0.3 V, and the pKa values relative to a proton donor in solution with pH=7. The parameters that determine the redox of cytochrome c and the proton affinity of the reference donor in pH =7, where chosen so that they will reproduce the experimentally known overall reaction energy discussed in section 2 (−10.2 kcal/mol for each step of the cycle). As will be discussed below, we also used independent experimental estimates to actually establish the limits on the pKas and redox values that were estimated by the QM considerations.
4 General constraints
While the above approaches can in principle provide the correct energetic for the PT and ET paths in CcO, it is essential to base any reasonable analysis on as many as possible experimental constraints. Thus we will start to examine and compile key experimental constraints.
4.1 Energies of states
In considering the energetics of CcO it is useful to start with the constraints imposed by Table 1. For simplicity we designate the Prd (the Δ-propionic) group by P (P− for the deprotonated form and PH for the protonated form) and the iron-bound oxygen molecule in the BNC by B (B− for the deprotonated Fe-OH and BH for the protonated Fe-H2O). Some specific examples are given in Eq (8). Obviously the different energy requirements should be related to the effective pKa values and redox potentials of the relevant groups. Thus we have the relationships
| (8a) |
| (8b) |
where VQQ(α) designates the charge – charge interaction of the given state and the designated pKa values are the intrinsic pKa values of Eq (1) (which include the effect of those ionizable groups that are not involved directly in the ET or PT processes. As discussed in section 3 we will focus on cases where Δu=0 and where the gradient is due to the pH difference. We also try to satisfy the constraint that the overall pumping process will go downhill and satisfy (see section 2)
| (9) |
The values of the energies of the states considered in Table 1 depend of course on the pKa values of PH and BH in the different redox states. In estimating these pKa values we considered the estimates summarized in Table 2. In doing so we rely on the pKa values for PH evaluated by the PDLD/S-LRA approach taking into account the effect of Arg 481. That is, we performed two sets of calculations. The first include Arg481 explicitly in the PDLD/S region I and treated the different ionization states of the Prd Arg ion pair. This treatment gave pKa(PH)=−1. The other treatment included Arg481 implicitly through Eqs (6–7). This gave pKa(PH)=2. The charges on the heme and binuclear groups were handled by Eq (6). The evaluation of pKa(BH) (the pKa value of the water bound to Fe) presented a more challenging task. Here we recognize that the quantum calculations of this pKa value miss the screening by the environment in the case when Prd is ionized and perhaps overestimate the interaction with CuB as is evidence from calculated changes from −2 to 7.6 upon deprotonation of Prd, ref[16]. Here it is useful to note that the typical pKas of water bound to oxidized irons in proteins is 10-7 units [14]. In addition, it was estimated in ref[55] that this pKa is around 9. Thus, it would be very useful perform reliable QM/MM calculations of the type reported before[43], which will provide a reliable estimate of both the effect of CuB and the overall protein environment, but this is left to a subsequent study. Here we took a compromise and assumed that the pKa of BH in state I is around 6. We also assumed that the interaction between the bound hydroxide and the heme iron system changes by about 3 kcal/mol upon oxidation of heme a3, based in part on experimental studies [56]. Here again it would be very useful to perform reliable QM/MM calculations. The pKa values and reduction potentials considered are summarized in Table 2.
Table 2.
Key parameters and their origin (a)
| Parameter | Previous estimates (b) | Intrinsic (c) | apparent(d) |
|---|---|---|---|
| pKa(BH)I | (−2; 7) (e), (7 to 10) (l), 9 (m) | 5.00 | 5.54 |
| pKa(BH)X | 7.20 | 7.47 | |
| pKa(PH)I | −1 (f), 2 (g) | −1.00 | −1.03 |
| pKa(PH)III | −1.00 | −1.59 | |
| pKa(PH)X | −4 (f), 0 (g) | −1.00 | −1.44 |
| pKa(EH)I | 9.4 (h), 10 (i) | 9.00 | 9.42 |
| ΔI ([a− a3] → [a a3−])I | −2.50 (i) | −2.71 | |
| ΔI ([a− a3] → [a a3−])III | −1 (j), −4 (k) | −5.54 | −5.63 |
The pKa values are given in pKa units whereas the reduction potential is in kcal/mol
Previous estimates from the literature.
Evaluated by the PDLD/S-LRA method where the interactions with the protein ioniozable groups in the active space ( those included in the state diagrams ) are not included, except the Heme(Fe) ··· OH− interaction and the interaction between Arg 481 and Prd, which are included explicitly.
Includes VQQ interaction with other residues (excluding the interactions that were already considered in (c)). The calculations were done with ε′=60.
see text and ref[16].
The pKa value of Prd is evaluated by PDLD/S-LRA where the effect of Arg 481 is included explicitly.
Evaluated by the PDLD/S-LRA where the effect of Arg481 is included implicitly with Eq. 7 and ε′=60.
Taken from the most quoted experimental estimate (ref[10])
Obtained by PDLD/S-LRA calculations[20]
Taken from the estimate of ref[57]
Estimated by PDLD/S-LRA calculations
Based on an assumed effect of the iron bound to OH− and the reduction potential of the heme.
Taken from the estimate of ref[55]
4.2 Activation barriers
The constraints on the activation barriers can be separated roughly to constraint on ET and PT. Starting with the ET process we note that the rate of ET from heme a to heme a3 has been the subject of some controversy. The estimate varies from ~50 μs [58] to ~1 ns [59, 60]. More specifically, rewriting Eq 5 as
| (10) |
we may try to estimate A and λ. Now, while there is an agreement about the finding that A ≈ 109 – 108 s−1. The value of λ is quite unclear. Estimates vary from λ~17 kcal/mol, e.g. ref [60, 61], to λ<5 kcal/mol[59]. The first estimate means that we have a barrier of about 4 kcal/mol when ΔG°=0, and gradually smaller barrier for ΔG° < 0. On the other hand, the second estimate corresponds basically to a barrierless ET process as long as ΔG° ≤ 0.
Unfortunately, the estimates of λ are based on very tentative approach, e.g. temperature dependence [59]. Thus, it seems to us that resolution of the difference between both mechanisms require one to calculate λ by simulation approaches (see e.g. ref. [62]). Our preliminary exploration of this issue gave us λ~25 kcal/mol. However, the considerations of the results of Vos and coworkers[59] seem to be quite compelling for the system they studied. Thus, the proper value of A remain an open issue that will not be resolved unless one is able to reproduce the observed rates of ref[59] by microscopic simulations of the actual experiment, which might be different than the ET steps in the reaction of CcO (different A and λ). Exploring this crucial problem is left to subsequent studies. Regardless of the estimate used we will present the activation barrier for the ET steps in a way that allows us to use the same preexponential factor as for the PT reaction (see ref [21]). With this we have an effective activation barrier of about 4 kcal/mol when the Δg‡ of Eq. 10 is zero and when A=108 s−1.
The constraints on the PT barrier reflect the following considerations; First it is clear that the highest PT barrier cannot exceed 13 kcal/mol since the overall PT should be faster than ~1 ms[10, 63]. Thus,
| (11) |
We must also have constraints on the barriers regardless if they are due to PT or ET. Thus, for example we must have
| (12) |
That is, the PT from the N side to Prd must be faster than ET or ET/PT to the BNC, since otherwise the system will be trapped as BHa3− and could not pump anymore ( although, as will be discussed below, it is also important to consider path that start with the I→VII process)
Another fundamental requirement, that was introduced in ref [20], is the condition ‡‡
| (13) |
which means that after placing protons on P− and proton+electron on heme a3 we have to block back PTR from PH or the P-side to the D-channel.
4.3 pH considerations
The effect of the pH on the N side should also serve as a constraint on our energy considerations. Here, the simplest option is to start with a Michaelis-Menten type kinetics (see ref [64]for related consideration). In this model we can choose a given entrance site (e.g. Wx =W8) and consider kX⃗prdPT and KX⃗bulk(N)PT as the equivalent of kcat and KM and write
| (14) |
where pKa‡ is the pKa value of the H3O+ at the point with the highest ΔG on the profile for H+ transport (we neglect here the small difference between ΔG and Δg‡). In the common case, when [H+] < 10−pKa, X, we obtain
| (15) |
As will be shown below it is not simple to satisfy the above constraint.
5 Examining different options
With the above approach and constraints we may start to examine the implications of our energy considerations. This will be done in the subsequent sections
5.1 Illustrative example with a concerted path through E286
In the first step of our analysis we evaluated the energetics of a subset of the available paths, restricting ourselves to concerted PTR through E286, where this acidic residue is not allowed to become fully ionized, in view of its high pKa (pKa =9) (see ref [20] for more details). This restriction will be removed in the subsequent section. We also do not consider explicitly some states with protonated Prd since with the current estimate of pKa(PH) ~ −1.0 the system will be significantly more stable with the proton on the P side even with a reduced heme a3. The resulting set of state energies and barriers are depicted in Fig. 4 for two limiting dielectric models. The model of Fig, 4a (which gives much more reasonable barriers) will be used as a demonstration of our considerations. We would like to clarify at this point that Fig 4 (or related diagrams) can include pathways that are completely unacceptable as a way of establishing a pump. However, our point is to try to consider all the possible paths with the lowest barriers for the given assumed system (e.g. the current system with only concerted paths through E286). With this set of barriers one can follow the ‘deterministic’ kinetics of the system and see if it pumps or does not pump. It is important to note in this respect that some mutants of CcO do not pump so that evidently small changes in the energetics of some protonation sites can change the pumping. Thus, we cannot determine if a given model will pump without evaluating the corresponding energetics. Basically our aim is to go from structure to energetic and then to kinetics, without imposing the knowledge on forbidding paths on the model. In this way if the model does not pump it is because its energetics does not satisfy the experimental and conceptual constraints
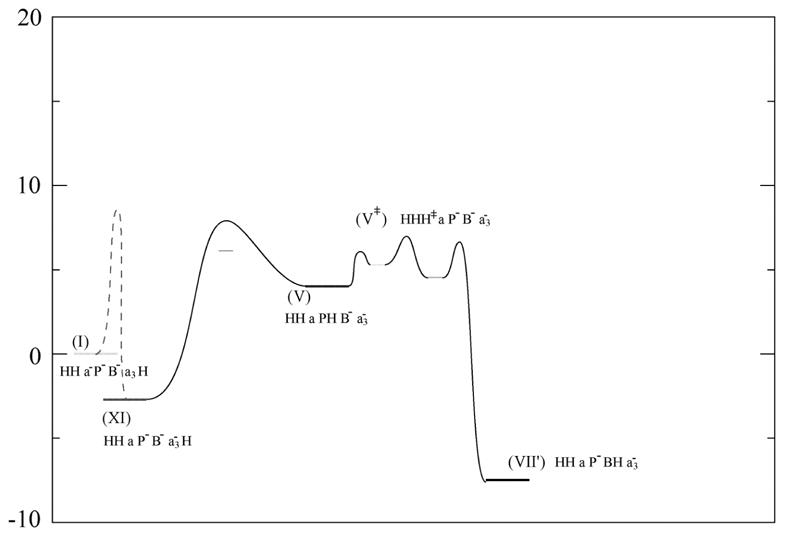
Fig 4.


Showing the energy diagram for some of the key states that may be involved in the overall CcO pumping mechanism. The notation HD and H‡ refers to having the proton on the least energy favorable water molecule in the D-channel and hydrophobic region, i.e. (H2O)6 and (H2O)10. Note also that the preexponential effect is included in the ET barriers. The figure considers two limiting case; (a) with εeff =13 for all the interactions with the protonated water molecules and the εeff of Eq 7 with ε′=60 for all other interactions, and (b) the εeff of Eq. 7 with ε′=60 for all interactions.
Obviously the Fig. 4 presents an overwhelming complexity and thus we start by highlighting the main features of the forward and backward reactions and the requirement of blocking some of the back PTR (Eq. 13). As can be seen from Fig. 5 and 6 there are two forward paths with reasonable forward barriers, namely (I→II→VI→X) and (I→XI→VI→X). The first forward path has a somewhat too high barrier unless we use pHN < 5; as discussed in section 4.3 we are limited by ΔgI→II ‡ ~1.38(pHN -pKa‡) where pKa‡ is the pKa value of a H3O+ in the hydrophobic region (i.e. W10 in Fig 3).
Fig. 5.

Highlighting the states and paths from Fig 4 that leads forward from N to P. The figure focuses on the process that accounts for pumping protons against the proton gradient.
Fig 6.
Illustrating some of the steps important in leading to “leakage” through back reactions.
Unfortunately, each of these paths suffers from major (and in hindsight clear) leakage problems that will be discussed below. However, as a demonstration of our approach we will first consider some specific problems. The first problem with the (I→II→VI→X) path is the trap at the BNC by the (VI→VII) step (PT from the P side to B−). The barrier for this step should be higher than the (VI→X) barrier. It is also crucial to block the (XI→VI′→VI→VII) path. Without blocking this path we have the problem that the (XI→VII) absolute barrier will always be lower than the (VI →X) barrier (XI and VI are identical systems except that in the first one the proton is at the N side and in the second the proton at the P side). Similar problems occur for other branching points where the system always ends at the traps.
Interestingly, the back reaction, which is considered in Fig 5, includes a PTR from the P side to Pro and to the D channel (X→VII), may be blocked reasonably well by the protonation of B− (since with a low εeff the (VI→X) barrier is smaller than the (X→VII) barrier(see ref [20, 21])). Unfortunately, the crucial problems that will be further discussed below cannot be resolved
Since ΔgI→II ‡ seem to be somewhat too high in the model of Fig. 4b (which corresponds to the high dielectric limit), it is important to consider some options to reduce this barrier. Apparently, using a lower dielectric (Fig. 4a) we find that the barrier becomes reasonable. However, if we restrict ourselves to ε′=60, then the contribution of pHN also poses a problem. That is, with pH =7 it is extremely hard to satisfy Eq 11. However, the observed pH dependence of the rate seems to stay constant between 7 and 5 [63] and this might mean that we have to modify Eq 15. One option is that we have an “antenna effect” [65–69] that increases somehow the effective pHN (note that changing the identity of the proton acceptor does not change Eq 15). This issue will have to be examined in the future by explicit simulations with stochastic boundary condition of the external concentration (as was done in ref [34] for ion channels).
At this stage it is crucial to examine some backward channels that should be blocked for an effective pumping. Such an examination can be done even with the help of Fig 4 where we start by pointing out that the back PT from the P side to Prd and then to the D-channel should be blocked before the reduction of heme a. This condition could be satisfied by the 0 to XII barrier, which reflect the fact that the pKa of a proton on W10 is quite negative unless heme a or heme a3 is reduced (the negative charge on the heme stabilizes the transferred proton). Unfortunately, because of the pH gradient we find it hard to produce a higher backward barrier than the corresponding forward barrier. That is, a working pump requires that the (XI→VII′) barrier would be lower than the (I→X) barrier. However, the two barriers are determined by the energetics of V‡ and VID, and in view of the fact that the energy of H‡ is only slightly higher than the energy of HD, the main effect is that for V‡ we have two protons on the N side and in VID we have two protons on the P side. Thus, Δg‡(XI→VII′) < Δg‡(I→X). This point can also be seen by comparing the XI→VII″ profile in Fig. 4 to the I→X profile in Fig. 5.
Considering the complexity of the above considerations it is useful to represent them by a two-dimensional connectivity diagram of the type used in Fig. 7. This diagram simplifies the visualization of the back reactions and thus allow for a relatively clear discussion of the ability of the system to provide a reasonable pump. The best way to look at such a diagram is to consider the absolute energies of the top of the barriers and to look for paths with the lowest absolute heights, while considering carefully deflections and backward paths. Now, as seen from Fig. 7 (and the equivalent Fig. 4), while we have reasonable forward barriers and some useful gating, we still have here major problems since the back reactions do not have sufficiently high barriers. Thus it is almost impossible to resolve the problems presented in Fig. 7
Fig 7.
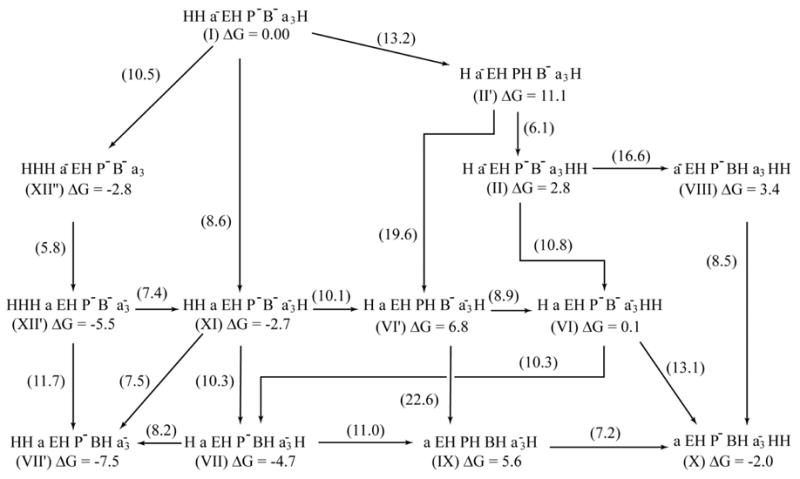
An alternative two dimensional representation of the energetic of Fig. 4a. This diagram makes it easy to see the problems with the back reactions. The figure gives in the middle of each arrow the absolute height of the top of the barrier relative to the energy of state I. The figure also gives the free energy of each state.
5.2 Stepwise paths through E286
In view of the problems associated with the paths considered in Figs. 4–7, and in particularly the difficulties in blocking the back reactions, it is important to consider other options. One of the promising options is provided by moving from the concerted PTR through E286 to a stepwise PTR that involves a full deprotonation of this residue. The stepwise option was found to be problematic in our previous study, ref [20], where we explored the possibility of moving a proton to W8 and then deprotonation of E286. This path was found to have a very high barrier and was not considered any further. However, it appears that if we first deprotonate E286, without moving a proton to the D-channel, and if we use a relatively low εeff (e.g. εeff=13) for the interaction of E286 and other key residues with the protonated water molecules, we can have a reasonable barrier for the E− W10H+ configuration. Thus, we examine in Fig 8 the energetics of paths that involve deprotonation of E286 and exclude the concerted paths that move through E286. Now, it appears that with this stepwise mechanism we can also have a promising gating mechanism that does not suffer from the early leakage problem of fig 7. That is, the low barrier for the back PTR, where the (XI → VII′) barrier is lower than that for the forward PTR (see below).
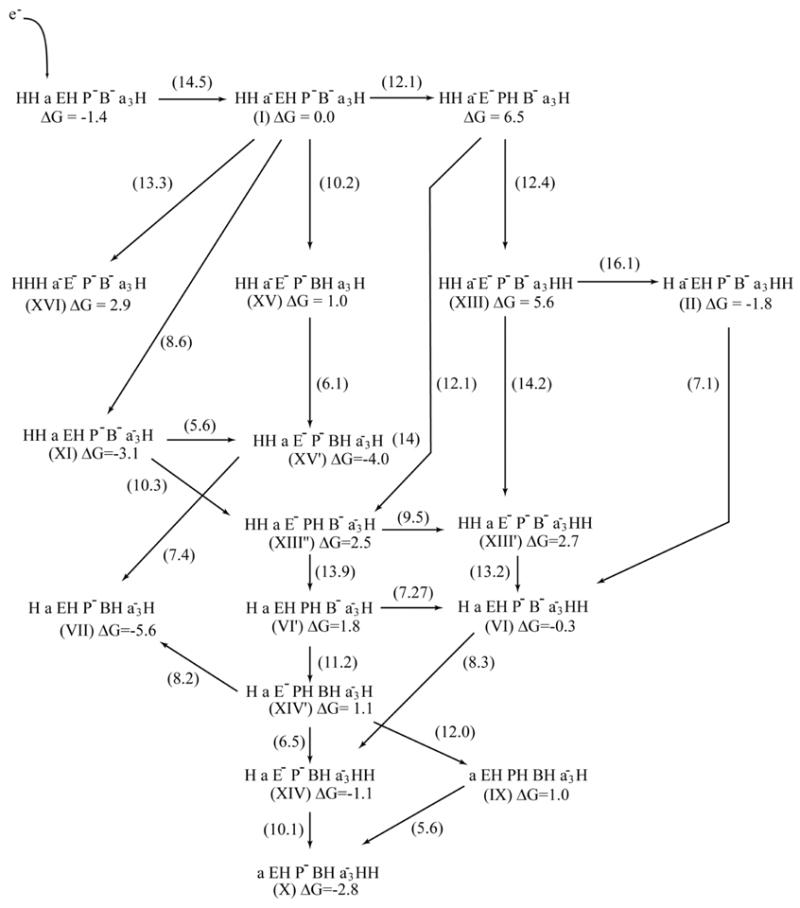
Fig 8.

A two dimensional representation of the energetics of the PT/ET in CcO with actual deprotonation of E286 and without concerted PTR through this residue. The energies reported were obtained with ε′=60 for all interactions, except for protonated water molecules in the D channel and the paths between E 286 to Prd and B for which we used εeff=13 (see text). The figure gives the absolute height of the top of the barrier relative to the energy of state I. The barrier for the ET to heme a is estimated from experimental studies.
To see the above point we have to relate the diagram of Fig. 8 to the kinetics of the system. Of course, this requires one to describe the overall time dependence of the system by say the Monte Carlo approach developed in ref [21], or at least to solve the rate problem with the given barriers. However, a significant insight can be obtained by looking at the absolute height of the main barriers along each path and to do so also for possible back reactions.
Now with the above consideration in mind and with Fig. 8 we can examine some instructive paths (which are however, not without problems). One option is the (I→XIII→XIII′ →VI→XIV→X) path, that involves a PTR from E286 to Prd and then to the P side (EP), followed by an ET from heme a to heme a3, a PTR from the N side to E286 (NE) and from E286 to B− (EB) and then PTR from the N side to E286 (NE). Apparently, this path is problematic because of the height of the (XIII→XIII′) barrier and some leakage problems that will be considered in the next section. The second option involves the (I→XI→XIII″→VI′→XIV′→XIV→X) path. This path can become reasonable only with the lowest limit of the dielectric function for the interaction between heme a3 and Prd and also suffers from some leakage problems (see below). Other possible paths appear to present major problems.
At any rate, although in the case of the landscape of Fig 8 we have problems with back reactions, they are less serious than with the landscape of Fig. 4 (or Fig. 7), where we could not block the initial back reaction. The limitations and possible improvements of this landscape will be discussed in the next section.
5.3 Possible refinements and open problems
As should be clear from the above discussion, in order to have of a working pump it is essential that the forward barrier will be lower than those for the back reactions. The fulfillment of this requirement is far from trivial and has not been accomplished yet by any explicit energy-based model. Thus it is important to explore what are the hints that have been provided by our calculations. As is obvious from the previous section it is very hard to obtain a workable pump from the model of Fig 4 (or Fig 7); unless perhaps we have a very strong interaction between the reduced a3 and Prd so that state VI′ is drastically stabilized. But even in this case the back reactions still present a major problem. Fortunately, the landscape of Fig 8 seems to have more promising (but still problematic) options than in Fig. 7. Here we will consider some of these options.
The option of using the (I→XIII→XIII′ →VI→XIV→X) path is problematic because of the relatively high absolute energy of the (XIII→XIII′) barrier and some leakage paths. This path can still provide a reasonable pump if we can satisfy the following requirements: (i) the effective ET barrier for the (I →XI) step should be increased to its upper limit of say 13 kcal/mol (ii) the top of the (XIII→XIII′) and the (XIII′→VI) forward barriers should decreases to about 13 kcal/mol and (iii) the (XIII′→XIII″→ XI) and (XIV→XIV′→VII) (PE) barriers should increase. (iv) The (I→XV) (EB) barrier should be increased. The requirement of reduction of the forward barriers can be satisfied if the pKa of E286 in state I would be around 8 (instead of around 9.5). In this case the energy of state XIII and state XIII′ will be reduced by about 3 kcal/mol. This is not impossible, since the experimental estimate of the pKa of E286 was obtained based on titration conditions when the pH in the bulk solution is around 10 and different protein groups (that are not ionized at pH=7) become negatively charged. The requirement that the ET rate will be quite different in state XIII and state I is feasible if the preexponential factor (A in Eq. 10), which is included in our effective barrier, changes upon ionization of E286 and leads to some change in the relative orientation of heme a and a3. The requirement that the (PE) back reaction in state XIII′ is blocked implies that the energy for the proton on the site with the lowest pKa (e.g. W11 or Prd) is very different in the case when the electron is on heme a and heme a3. The last requirement of a higher (PE) back reaction at state XIV is, in fact, easy to satisfy since now we have a protonated BH that increases the energy of a protonated W11. This ‘gating’ mechanism already existed in our earlier papers and it also exists here since the barrier for the (XIII→I) (PE) step is about 7 kcal/mol, while the barrier for the (XIV′→VII) (PE)step is about 9 kcal/mol, even with the current dielectric constants and will increase with a lower dielectric constant. This illustrates the possible importance of the electrostatic coupling between BH and W11 or Prd. Finally, having a higher (I→XV) than (I→XIII) barrier is feasible with the water penetration effect that will be discussed below.
The interesting option of the (I→XI→XIII″→VI′→XIV′→XIV→X) path depends strongly on the dielectric used. With sufficiently low εeff for the interaction between the reduced heme a3 and prd, as well as the interaction between E286 and prd, the pKa of Prd can change from about zero to about 6 in moving, for example, from state I to state XIII″. In this limit we will have significantly lower energy for states with protonated Prd and open the (I→XI→XIII″→VI′→XIV′→XIV→X) path as well as the (I→XI→XIII″→VI′→XIV′→IX→X) path. To demonstrate the above considerations we present in Fig 9 the energetics of the system with the changes of the pKa of Prd in state I to 2 and the change of the pKa of E286 to 7.5 (see the discussion above) as well as the changes of εeff specified in the caption of Fig 9. Now the system facilitates the transfer through the paths with early ET and protonated Prd but suffers from some of the back reactions considered in the discussion of the first option, and these leakage problems may be reduced in the ways mentioned above.
Fig 9.
A modification of the landscaper of Fig 8, using ε′=20 for all interactions, except for protonated water molecules in the D channel and the paths between E 286 to Prd and B, for which we used εeff=13. In addition, the apparent pKa of E286 and Prd in state I where changed to 7.5 and 2.0 respectively (see text).
Some of the changes considered above may look as arbitrary changes of key parameters (that can be presumably used to get any desire result). However, the competition between different paths depends clearly on the effective interactions between the relevant charged groups and since this study was restricted to reasonable values of low εeff, the options considered here are still feasible. It is also possible that the water penetration effect (see below) will change the estimated results by a few kcal/mol and help to change the energetic in a way that will lead to reasonable pumping. Finally, as discussed in section 4.2 the ET barriers still present an open issue. At any rate, at present we need to apply adjustments of as much as 3 kcal/mol in a few barriers to generate a reasonable pumping system.
In view of the difficulties of obtaining consistent pumping by the mechanisms considered above, it may be useful to have a significant barrier for PT from the P side to Prd and to the N-side. The main reason for the need of such a barrier is the fact that the early ET barrier (e.g. I→XI) is not likely to be sufficiently high to make the forward rate slower than the backward rate. Thus it is important to try to explore the nature of the exit channel and to examine whether a higher (IX →V) barrier is supported by the structural constraints.
It is also important to examine the energetics of placing the neutral water molecules in the nonpolar region. In particular, it is necessary to consider the possibility that this energy is different for the W9→W11 chain than the W12→W14. That is, our calculations ignored the energetics of placing water molecules in the interior and assumed implicitly that the water chains are already in reasonable positions. Although in general the energy of orienting and displacing water molecules is much smaller than the energetics associated with protonating these molecules in nonpolar sites (e.g. see ref [70]). It is important to examine the energetics of bringing water molecules to the branches that connect W8 with Prd and with B−. This challenging study is left for a future work.
In addition to the options considered here one must be open to other possibility. It is possible that some of the pathways considered here are not those used by CcO. For example, A recent careful study of bacterial RC by Okamura and coworkers[64] demonstrated quite conclusively that the PTR in this system involves groups with relatively high pKa (rather than protonated water molecules) and thus is not limited by the pKa of H3O+ ion (in this case the equivalent of the pKa‡ in Eq 15 is relatively high). As is obvious from a comparison of Fig. 4a and Fig. 4b, the results of our modeling depend to some extent on the assumed value of εeff. Although the range of 8–40 covers the most feasible range it is important to attempt to explore by microscopic simulations and other approaches the actual dielectric effect. For example the εeff for interactions between groups at the beginning and end of the D-channel (see ref [21]) may be even as small as 8, due to the possibility of a transfer of orientational polarization across the channel without sufficient compensation by the change in solvation effect by the surrounding environment (see Fig 2 in ref[71]). Similarly, although εeff usually reflects correctly the effect of possible charged induced conformational changes; it is still possible that configurational change during different steps of the cycle would bring us out of the range of current εeff. Here, of course, it would be very useful to have some experimental information about structural changes.
In considering other options it would be useful to examine the possibility that the proton moves first to the BNC[72]. Unfortunately this (I→XI→VII) early path can serve as a trap unless we have some special slow relaxation mechanism where the initial pKa of BH is relatively slow and it eventually increases due to some conformational relaxation. At present it is hard to rationalize such a mechanism.
Another potentially promising option is to have a proton acceptor site on the P side, which somehow interacts more strongly with the BNC than Prd does. Such a site might have a stronger coupling to the “chemistry“ and help in obtaining an effective pump. As should be obvious at this point we have not “solved” the pumping problem in CcO, but instead pointed out what is the kinetics expected from the reasonable energy considerations.
6 Concluding Remarks
The elucidation of the mechanism of CcO on a molecular level presents a major challenge in view of the complexity of this system and the availability of several different mechanistic options for the coupled PT/ET processes. Although experimental studies have provide major insights on the nature of different steps, we deal here with a problem that seems to require a tight connection between experimental and theoretical studies. Not only that the bookkeeping of the different options can be considered to be a theoretical endeavor but, more importantly, the conversion of structural information to energetics and pathways require some type of computer based molecular modeling. This is also applied to systematic studies of mutation effects.
This work has been built on our early theoretical studies[16, 20, 21, 27], but it focuses more on the attempt to provide a systematic analysis of the theoretical and experimental constraints on the possible pathways and intermediates in the action of CcO. While other theoretical studies, e.g. ref[12], have made significant contributions to the elucidation of possible PTR and ET pathways in CcO, the present study puts much more effort in exploring the detailed barriers and the attempt to quantify the energetics of different mechanistic proposals. In fact, we believe that a clear idea about the heights of specific barriers is essential for testable models of the pumping process. That is, there is a major difference between discussing different pumping options in terms of somewhat arbitrary assumptions about the rates of different processes and the use of an actual formulation of the given model in terms of well defined and thus verifiable barriers. For example, instructive mechanistic proposals that involve a transient state with unprotonated E286 (e.g. ref [10]) or suggestions that some steps are faster than other [73] cannot be examined theoretically without defining or estimating the relevant barriers. Obviously the actual evaluation of the barriers in our specific analysis might turn out to provide only a part of the story (e.g. it is possible that other paths play a crucial role). However, the energy based method introduced here is arguably the first attempt to subject the mechanistic proposal for the action of CcO to consistent energy based analysis.
The present analysis provides a semi quantitative analysis of different possible pathways and highlights the difficulties of obtaining a workable pump and the corresponding challenge of having higher barriers for the backward than for the backward reactions. It also analyzed the conditions that can convert the set of activation barriers to an effective pump. However, the uncertainties associated with the estimated energetics leave several major open questions. In some respects it seems that the connectivity diagrams of the type presented in Figs. 7–9 should be best treated as a problem in system biology, where the accumulation of enough experimental information about the effect of different input and output, as well as the effects of different mutations, should hopefully allow us to estimate all the key barriers in the network of reaction paths.
In view of the large energy changes associated with the lower and upper limits of our dielectric models, it may be assumed that it is easy to obtain a workable pump from any assumed set of paths. However, the actual situation is quite different. First, it was shown in section 5.1 that some models cannot work regardless of the dielectric used. Second, even at the lower limit of the allowed dielectric they still present major problems. Obviously an approach that involves arbitrary barrier adjustment can easily provide a pump for basically any system, but this is not the situation with barriers that follow consistently the trend in the electrostatic coupling within the system.
Despite the above problems it seems to us that we can draw several interesting and potentially useful conclusions from the present study. First, it appears that the electrostatic interactions between the conducted protons and the different charge groups plus redox centers provide the major control on the pumping process. The change in theses electrostatic interactions as a result of the transfer between different redox and protonation states has been probably evolved to provide the functional CcO system. This view is supported by the following observations; i) the relative height of the EP and the EB barriers seem to change significantly between the different redox states, where the EB barrier is reduced upon ET to a3. ii) The protonation of B− provides (with a reasonable dielectric constant) a “gate” for the back PTR as was already pointed out in our early studies[20]. (iii) The use of E286 as the initial proton donor can be controlled by the electrostatic potential from heme a (which can modulate the energy of the transfer proton in the hydrophobic channel). (iv) A model where the proton passes through E286 in a stepwise mechanism provides a simple way of blocking the early back PTR. (v) It is possible to design a system where the barrier for the (EP) PTR is higher than the (NE) PTR. Unfortunately, at present we cannot be sure about the actual situation, nor can we generate with the current simple set of dielectric constants a set of barriers that will reproduce reasonable forward barriers without having competing backward pathways with lower barriers. This issue will be addressed in subsequent studies, which will be guided nevertheless by the present analysis.
The elucidation of the mechanism of CcO should, of course, benefit greatly from mutational studies, as is already clear from the available findings (e.g. refs [3, 6–8]). However, even the mutational studies might not provide unique models. In this respect it is useful to point out that both paths considered in section 5.2 are consistent with the effect of the N139D mutation which blocks the N to P PTR and opens an early ET to a3 and a PTR to B− [6, 21]. Here the presence of a negative charge at the beginning of the D-channel is expected to stabilize the transferred proton in the D channel (see ref. ref [21]) and to reduce the (NE) barrier, while increasing the (EP) barrier (due to some moderate increase in the pKa of E286). It is also expected to leave the EB barrier relatively unchanged (the change in energy at E286 and W12 is expected to be similar). Now, if the native CcO satisfies the conditions for using the (I→XIII →XIII′ →VI→XIV→X) path then the above changes in the mutant may allow the system to start with the (I→XV′) (EB+ET) step. instead of the (I→XIII;) (EP+ET) step. Similarly, the if CcO uses the (I→XI→XIII″→VI′→XIV′→XIV→X) path then the mutant may open the (I→XV) cannel and slow the EP cannel. Unfortunately, the mutational effects are also consistent with very different mechanisms (e.g. ref [21]).
As stated in section 5.3 we have not considered all the options and all possible PTR paths.
For example, a barrier between Prd and the P side may help in blocking the back reactions (a possible relevant region is discussed in ref [74]). However the exploration of this and other issues is left to subsequent works. In fact, we would like to view the present work as a systematic review of the energetics of the most obvious paths and as a demonstration of the need for clear energy considerations for defining and examining different mechanistic proposals. We hope that the present analysis can be used as a springboard for subsequent studies following more specific experimental findings and also more theoretical studies.
Acknowledgments
We are grateful to professors P. Brzezinski, M. Wikstrom and R. Gennis for many stimulating discussions. This work was supported by National Institutes of Health Grant R01 GM 40283 and by computer time from University of Southern High Performance Computing and Communication Center (HPCC). We thank Pankaz Sharma for his help with the revision of the manuscript.
Footnotes
Publisher's Disclaimer: This is a PDF file of an unedited manuscript that has been accepted for publication. As a service to our customers we are providing this early version of the manuscript. The manuscript will undergo copyediting, typesetting, and review of the resulting proof before it is published in its final citable form. Please note that during the production process errors may be discovered which could affect the content, and all legal disclaimers that apply to the journal pertain.
References
- 1.Wikstrom MKF. Proton Pump Coupled to Cytochrome-C Oxidase in Mitochondria. Nature. 1977;266:271–273. doi: 10.1038/266271a0. [DOI] [PubMed] [Google Scholar]
- 2.Michel H, Behr J, Harrenga A, Kannt A. Cytochrome c oxidase: structure and spectroscopy. Ann Rev Biophys Biomol Struct. 1998;27:329–56. doi: 10.1146/annurev.biophys.27.1.329. [DOI] [PubMed] [Google Scholar]
- 3.Mills DA, Ferguson-Miller S. Influence of structure, pH and membrane potential on proton movement in cytochrome oxidase. Biochim Biophys Acta. 2002;1555:96–100. doi: 10.1016/s0005-2728(02)00261-x. [DOI] [PubMed] [Google Scholar]
- 4.Ostermeier C, Harrenga A, Ermler U, Michel H. Structure at 2.7 A resolution of the Paracoccus denitrificans two-subunit cytochrome c oxidase complexed with an antibody FV fragment. Proc Natl Acad Sci USA. 1997;94:10547–10553. doi: 10.1073/pnas.94.20.10547. [DOI] [PMC free article] [PubMed] [Google Scholar]
- 5.Yoshikawa S, Shinzawa-Itoh K, Nakashima R, Yaono R, Yamashita E, Inoue N, Yao M, Fei MJ, Libeu CP, Mizushima T, Yamaguchi H, Tomizaki T, Tsukihara T. Redox-coupled crystal structural changes in bovine heart cytochrome c oxidase. Science. 1998;280:1723–1729. doi: 10.1126/science.280.5370.1723. [DOI] [PubMed] [Google Scholar]
- 6.Pawate AS, Morgan J, Namslauer A, Mills D, Brzezinski P, Ferguson-Miller S, Gennis RB. A mutation in subunit I of cytochrome oxidase from Rhodobacter sphaeroides results in an increase in steady-state activity but completely eliminates proton pumping. Biochemistry. 2002;41:13417–13423. doi: 10.1021/bi026582+. [DOI] [PubMed] [Google Scholar]
- 7.Pfitzner U, Hoffmeier K, Harrenga A, Kannt A, Michel H, Bamberg E, Richter OM, Ludwig B. Tracing the D-pathway in reconstituted site-directed mutants of cytochrome c oxidase from Paracoccus denitrificans. Biochemistry. 2000;39:6756–62. doi: 10.1021/bi992235x. [DOI] [PubMed] [Google Scholar]
- 8.Han D, Morgan JE, Gennis RB. G204D, a mutation that blocks the proton-conducting D-channel of the aa(3)-type cytochrome c oxidase from Rhodobacter sphaeroides. Biochemistry. 2005;44:12767–12774. doi: 10.1021/bi051141m. [DOI] [PubMed] [Google Scholar]
- 9.Ferguson-Miller S, Babcock GT. Heme/copper terminal oxidases. Chem Rev. 1996;96:2889–2907. doi: 10.1021/cr950051s. [DOI] [PubMed] [Google Scholar]
- 10.Brzezinski P, Larsson G. Redox-driven proton pumping by heme-copper oxidases. Biochim Biophys Acta. 2003;1605:1–13. doi: 10.1016/s0005-2728(03)00079-3. [DOI] [PubMed] [Google Scholar]
- 11.Wikstrom M, Verkhovsky MI, Hummer G. Water-gated mechanism of proton translocation by cytochrome c oxidase. Biochim Biophys Acta. 2003;1604:61–65. doi: 10.1016/s0005-2728(03)00041-0. [DOI] [PubMed] [Google Scholar]
- 12.Olkhova E, Hutter MC, Lill MA, Helms V, Michel H. Dynamic water networks in cytochrome c oxidase from Paracoccus denitrificans investigated by molecular dynamics simulations. Biophys J. 2004;86:1873–1889. doi: 10.1016/S0006-3495(04)74254-X. [DOI] [PMC free article] [PubMed] [Google Scholar]
- 13.Hofacker I, Schulten K. Oxygen and proton pathways in cytochrome c oxidase. Proteins: Struct Funct Bioinf. 1998;30:100–107. [PubMed] [Google Scholar]
- 14.Song YF, Mao JJ, Gunner MR. Electrostatic environment of hemes in proteins: pK(a)s of hydroxyl ligands. Biochemistry. 2006;45:7949–7958. doi: 10.1021/bi052182l. [DOI] [PMC free article] [PubMed] [Google Scholar]
- 15.Xu JC, Voth GA. Computer simulation of explicit proton translocation in cytochrome c oxidase: The D-pathway. Proc Natl Acad Sci USA. 2005;102:6795–6800. doi: 10.1073/pnas.0408117102. [DOI] [PMC free article] [PubMed] [Google Scholar]
- 16.Siegbahn PEM, Blomberg MRA, Blomberg ML. Theoretical study of the energetics of proton pumping and oxygen reduction in cytochrome oxidase. J Phys Chem B. 2003;107:10946–10955. [Google Scholar]
- 17.Zheng XH, Medvedev DM, Swanson J, Stuchebrukhov AA. Computer simulation of water in cytochrome c oxidase. Biochim Biophys Acta - Bioenergetics. 2003;1557:99–107. doi: 10.1016/s0005-2728(03)00002-1. [DOI] [PubMed] [Google Scholar]
- 18.Mills DA, Ferguson-Miller S. Understanding the mechanism of proton movement linked to oxygen reduction in cytochrome c oxidase: lessons from other proteins. FEBS Letters. 2003;545:47–51. doi: 10.1016/s0014-5793(03)00392-2. [DOI] [PubMed] [Google Scholar]
- 19.Namslauer A, Brzezinski P. Structural elements involved in electron-coupled proton transfer in cytochrome c oxidase. FEBS Letters. 2004;567:103–110. doi: 10.1016/j.febslet.2004.04.027. [DOI] [PubMed] [Google Scholar]
- 20.Olsson MHM, Sharma PK, Warshel A. Simulating redox coupled proton transfer in cytochrome c oxidase: Looking for the proton bottleneck. FEBS Letters. 2005;579:2026–2034. doi: 10.1016/j.febslet.2005.02.051. [DOI] [PubMed] [Google Scholar]
- 21.Olsson MHM, Warshel A. Monte Carlo simulations of proton pumps; On the working principles of the biological valve that controls proton pumping in cytochrome c oxidase. Proc Natl Acad Sci USA. 2006;103:6500–6505. doi: 10.1073/pnas.0510860103. [DOI] [PMC free article] [PubMed] [Google Scholar]
- 22.Proshlyakov DA, Pressler MA, Babcock GT. Dioxygen activation and bond cleavage by mixed-valence cytochrome c oxidase. Proc Natl Acad Sci USA. 1998;95:8020–8025. doi: 10.1073/pnas.95.14.8020. [DOI] [PMC free article] [PubMed] [Google Scholar]
- 23.Wikstrom M, Jasaitis A, Backgren C, Puustinen A, Verkhovsky MI. The role of the D- and K-pathways of proton transfer in the function of the haem-copper oxidases. Biochim Biophys Acta - Bioenergetics. 2000;1459:514–520. doi: 10.1016/s0005-2728(00)00191-2. [DOI] [PubMed] [Google Scholar]
- 24.Karpefors M, Adelroth P, Namslauer A, Zhen YJ, Brzezinski P. Formation of the “peroxy” intermediate in cytochrome c oxidase is associated with internal proton/hydrogen transfer. Biochemistry. 2000;39:14664–14669. doi: 10.1021/bi0013748. [DOI] [PubMed] [Google Scholar]
- 25.Proshlyakov DA, Pressler MA, DeMaso C, Leykam JF, DeWitt DL, Babcock GT. Oxygen activation and reduction in respiration: Involvement of redox-active tyrosine 244. Science. 2000;290:1588–1591. doi: 10.1126/science.290.5496.1588. [DOI] [PubMed] [Google Scholar]
- 26.Bloch D, Belevich I, Jasaitis A, Ribacka C, Puustinen A, Verkhovsky MI, Wikstrom M. The catalytic cycle of cytochrome c oxidase is not the sum of its two halves. Proc Natl Acad Sci USA. 2004;101:529–533. doi: 10.1073/pnas.0306036101. [DOI] [PMC free article] [PubMed] [Google Scholar]
- 27.Siegbahn PEM, Blomberg MRA. Important roles of tyrosines in Photosystem II and cytochrome oxidase. Biochim Biophys Acta - Bioenergetics. 2004;1655:45–50. doi: 10.1016/j.bbabio.2003.07.003. [DOI] [PubMed] [Google Scholar]
- 28.Siegbahn PEM, Blomberg MRA. J Comp Chem In press. [Google Scholar]
- 29.Warshel A. Computer Modeling of Chemical Reactions in Enzymes and Solutions. 1997. John Wiley & Sons; New York: 1991. [Google Scholar]
- 30.Warshel A, Schlosser DW. Electrostatic Control of the Efficiency of Light-Induced Electron Transfer Across Membranes. Proc Natl Acad Sci USA. 1981;78:5564–5568. doi: 10.1073/pnas.78.9.5564. [DOI] [PMC free article] [PubMed] [Google Scholar]
- 31.Warshel A. Conversion of Light Energy to Electrostatic Energy in the Proton Pump of Halobacterium halobium. Photochem Photobiol. 1979;30:285–290. doi: 10.1111/j.1751-1097.1979.tb07148.x. [DOI] [PubMed] [Google Scholar]
- 32.Sham Y, Muegge I, Warshel A. Simulating proton translocations in proteins: Probing proton transfer pathways in the Rhodobacter Sphaeroides Reaction Center. Proteins: Struct Funct Bioinf. 1999;36:484–500. [PubMed] [Google Scholar]
- 33.Schutz CN, Warshel A. What are the dielectric “constants” of proteins and how to validate electrostatic models. Proteins: Struct Funct Bioinf. 2001;44:400–417. doi: 10.1002/prot.1106. [DOI] [PubMed] [Google Scholar]
- 34.Burykin A, Kato M, Warshel A. Exploring The Origin Of The Ion Selectivity Of The KcsA Potassium Channel. Proteins: Struct Funct Bioinf. 2003;52:412–426. doi: 10.1002/prot.10455. [DOI] [PubMed] [Google Scholar]
- 35.Braun-Sand S, Strajbl M, Warshel A. Studies of Proton Transocations in Biological Systems: Simulating Proton Transport in Carbonic Anhydrase by EVB Based Models. Biophys J. 2004;87:2221–2239. doi: 10.1529/biophysj.104.043257. [DOI] [PMC free article] [PubMed] [Google Scholar]
- 36.Carra C, Iordanova N, Hammes-Schiffer S. Proton-coupled electron transfer in a model for tyrosine oxidation in photosystem II. J Am Chem Soc. 2003;125:10429–10436. doi: 10.1021/ja035588z. [DOI] [PubMed] [Google Scholar]
- 37.Warshel A, Hwang JK. Simulation of the Dynamics of Electron-Transfer Reactions in Polar-Solvents - Semiclassical Trajectories and Dispersed Polaron Approaches. J Chem Phys. 1986;84:4938–4957. [Google Scholar]
- 38.Churg AK, Warshel A. Control of Redox Potential of Cytochrome c and Microscopic Dielectric Effects in Proteins. Biochemistry. 1986;25:1675. doi: 10.1021/bi00355a035. [DOI] [PubMed] [Google Scholar]
- 39.Muegge I, Qi PX, Wand AJ, Chu ZT, Warshel A. The reorganization energy of cytochrome c revisited. J Phys Chem B. 1997;101:825–836. [Google Scholar]
- 40.Warshel A, Sharma PK, Kato M, Parson WW. Modeling electrostatic effects in proteins. Biochim Biophys Acta. 2006;1764:1647–1676. doi: 10.1016/j.bbapap.2006.08.007. [DOI] [PubMed] [Google Scholar]
- 41.Chu TZ, Villà J, Strajbl M, Schutz C, Shurki A, Warshel A. beta 9.05. Los Angeles: 2002. [Google Scholar]
- 42.Lee FS, Chu ZT, Warshel A. Microscopic and Semimicroscopic Calculations of Electrostatic Energies in Proteins by the Polaris and Enzymix Programs. Journal of Computational Chemistry. 1993;14:161–185. [Google Scholar]
- 43.Olsson MHM, Hong G, Warshel A. Frozen density functional free energy simulations of redox proteins: Computational studies of the reduction potential of plastocyanin and rusticyanin. J Am Chem Soc. 2003;125:5025–5039. doi: 10.1021/ja0212157. [DOI] [PubMed] [Google Scholar]
- 44.Svensson-Ek M, Abramson J, Larsson G, Tornroth S, Brzezinski P, Iwata S. The X-ray crystal structures of wild-type and EQ(I-286) mutant cytochrome c oxidases from Rhodobacter sphaeroides. J Mol Biol. 2002;321:329–339. doi: 10.1016/s0022-2836(02)00619-8. [DOI] [PubMed] [Google Scholar]
- 45.Siegbahn PEM. Modeling aspects of mechanisms for reactions catalyzed by metalloenzymes. Journal of Computational Chemistry. 2001;22:1634–1645. [Google Scholar]
- 46.Becke AD. Density-Functional Exchange-Energy Approximation with Correct Asymptotic-Behavior. Phys Rev A. 1988;38:3098–3100. doi: 10.1103/physreva.38.3098. [DOI] [PubMed] [Google Scholar]
- 47.Becke AD. A New Mixing of Hartree-Fock and Local Density-Functional Theories. J Chem Phys. 1993;98:1372–1377. [Google Scholar]
- 48.Becke AD. Density-Functional Thermochemistry.3. The Role of Exact Exchange. J Chem Phys. 1993;98:5648–5652. [Google Scholar]
- 49.Lee CT, Yang WT, Parr RG. Development of the Colle-Salvetti Correlation-Energy Formula into a Functional of the Electron-Density. Phys Rev B. 1988;37:785–789. doi: 10.1103/physrevb.37.785. [DOI] [PubMed] [Google Scholar]
- 50.Jaguar. 4.0. Schrodinger inc; Portland, OR: 1991–2000. [Google Scholar]
- 51.Marten B, Kim K, Cortis C, Friesner RA, Murphy RB, Ringnalda MN, Sitkoff D, Honig B. New Model for Calculation of Solvation Free Energies: Correction of Self-Consistent Reaction Field Continuum Dielectric Theory for Short-Range Hydrogen Bonding Effects. J Phys Chem. 1996;100:11775–11788. [Google Scholar]
- 52.Tannor DJ, Marten B, Murphy R, Friesner RA, Sitkoff D, Nicholls A, Ringnalda M, Goddard WA, Honig B. Accurate First Principles Calculation of Molecular Charge-Distributions and Solvation Energies from Ab-Initio Quantum-Mechanics and Continuum Dielectric Theory. J Am Chem Soc. 1994;116:11875–11882. [Google Scholar]
- 53.Curtiss LA, Raghavachari K, Redfern PC, Pople JA. Assessment of Gaussian-3 and density functional theories for a larger experimental test set. J Chem Phys. 2000;112:7374–7383. doi: 10.1063/1.2039080. [DOI] [PubMed] [Google Scholar]
- 54.Siegbahn PEM, Blomberg MRA. Density functional theory of biologically relevant metal centers. Ann Rev Phys Chem. 1999;50:221–249. doi: 10.1146/annurev.physchem.50.1.221. [DOI] [PubMed] [Google Scholar]
- 55.Branden M, Namslauer A, Hansson O, Aasa R, Brzezinski P. Water-hydroxide exchange reactions at the catalytic site of heme-copper oxidases. Biochemistry. 2003;42:13178–13184. doi: 10.1021/bi0347407. [DOI] [PubMed] [Google Scholar]
- 56.Marques HM, Cukrowski I, Vashi PR. Co-ordination of weak field ligands by N-acetylmicroperoxidase-8 (NAcMP8), a ferric haempeptide from cytochrome c, and the influence of the axial ligand on the reduction potential of complexes of NAcMP8. J Chem Soc Dalton Trans. 2000;8:1335–1342. [Google Scholar]
- 57.Brzezinski P. Internal electron-transfer reactions in cytochrome c oxidase. Biochemistry. 1996;35:5611–5615. doi: 10.1021/bi960260m. [DOI] [PubMed] [Google Scholar]
- 58.Salomonsson L, Faxen K, Adelroth P, Brzezinski P. The timing of proton migration in membrane constituted cytochrome c oxidase. Proc Natl Acad Sci USA. 2005;102:17624–17629. doi: 10.1073/pnas.0505431102. [DOI] [PMC free article] [PubMed] [Google Scholar]
- 59.Jasaitis A, Rappaport F, Pilet E, Liebl U, Vos MH. Activationless electron transfer through the hydrophobic core of cytochrome c oxidase. Proc Natl Acad Sci USA. 2005;102:10882–10886. doi: 10.1073/pnas.0503001102. [DOI] [PMC free article] [PubMed] [Google Scholar]
- 60.Tan ML, Balabin I, Onuchic JN. Dynamics of electron transfer pathways in cytochrome c oxidase. Biophys J. 2004;86:1813–1819. doi: 10.1016/S0006-3495(04)74248-4. [DOI] [PMC free article] [PubMed] [Google Scholar]
- 61.Regan JJ, Ramirez BE, Winkler JR, Gray HB, Malmstrom BG. Pathways for electron tunneling in cytochrome c oxidase. J Bioenerg Biomembr. 1998;30:35–39. doi: 10.1023/a:1020551326307. [DOI] [PubMed] [Google Scholar]
- 62.Warshel A, Parson WW. Computer-Simulations of Electron-Transfer Reactions in Solution and in Photosynthetic Reaction Centers. Ann Rev Phys Chem. 1991;42:279–309. doi: 10.1146/annurev.pc.42.100191.001431. [DOI] [PubMed] [Google Scholar]
- 63.Namslauer A, Pawatet AS, Gennis R, Brzezinski P. Redox-coupled proton translocation in biological systems: Proton shuttling in cytochrome c oxidase. Proc Natl Acad Sci USA. 2003;100:15543–15547. doi: 10.1073/pnas.2432106100. [DOI] [PMC free article] [PubMed] [Google Scholar]
- 64.Paddock M, Adelroot P, Feher G, Okamura M, Beatty J. Determination of Proton Transfer Rates by Chemical Rescue: Application to Bacterial Reaction Centers. Biochemistry. 2002;41:14716–14725. doi: 10.1021/bi020419x. [DOI] [PubMed] [Google Scholar]
- 65.Williams RJP. Multifarious Couplings of Energy Transduction. Biochim Biophys Acta. 1978;505:1–44. doi: 10.1016/0304-4173(78)90007-1. [DOI] [PubMed] [Google Scholar]
- 66.Mulkidjanian AY, Cherepanov DA, Heberle J, Junge W. Proton transfer dynamics at membrane/water interface and mechanism of biological energy conversion. Biochemistry-Moscow. 2005;70:251–256. doi: 10.1007/s10541-005-0108-1. [DOI] [PubMed] [Google Scholar]
- 67.Georgievskii Y, Medvedev ES, Stuchebrukhov AA. Proton transport via the membrane surface. Biophys J. 2002;82:2833–2846. doi: 10.1016/S0006-3495(02)75626-9. [DOI] [PMC free article] [PubMed] [Google Scholar]
- 68.Marantz Y, Nachliel E, Aagaard A, Brzezinski P, Gutman M. The proton collecting function of the inner surface of cytochrome c oxidase from Rhodobacter sphaeroides. Proc Nat Acad Sci USA. 1998;95:8590–8595. doi: 10.1073/pnas.95.15.8590. [DOI] [PMC free article] [PubMed] [Google Scholar]
- 69.Georgievskii Y, Medvedev ES, Stuchebrukhov AA. Proton transport via coupled surface and bulk diffusion. J Chem Phys. 2002;116:1692–1699. [Google Scholar]
- 70.Kato M, Pisliakov AV, Warshel A. The barrier for proton transport in aquaporins as a challenge for electrostatic models: The role of protein relaxation in mutational calculations. Proteins: Struct Funct Bioinf. 2006;64:829–844. doi: 10.1002/prot.21012. [DOI] [PubMed] [Google Scholar]
- 71.Warshel A, Weiss RM. Energetics of Heme-Protein Interactions in Hemoglobin. J Am Chem Soc. 1981;103:446–451. [Google Scholar]
- 72.Faxen K, Gilderson G, Adelroth P, Brzezinski P. A mechanistic principle for proton pumping by cytochrome c oxidase. Nature. 2005;437:286–289. doi: 10.1038/nature03921. [DOI] [PubMed] [Google Scholar]
- 73.Popovic DM, Stuchebrukhov AA. Proton pumping mechanism and catalytic cycle of cytochrome c oxidase: Coulomb pump model with kinetic gating. FEBS Lett. 2004;566:126–130. doi: 10.1016/j.febslet.2004.04.016. [DOI] [PubMed] [Google Scholar]
- 74.Busenlehner LS, Salomonsson L, Brzezinski P, Armstrong RN. Mapping protein dynamics in catalytic intermediates of the redox-driven proton pump cytochrome coxidase. Proc Nat Acad Sci USA. 2006;103:15398–15403. doi: 10.1073/pnas.0601451103. [DOI] [PMC free article] [PubMed] [Google Scholar]