Abstract
I describe a method for simulating samples from gene families of size two under a neutral coalescent process, for the case where the duplicate gene either has fixed recently in the population or is still segregating. When a duplicate locus has recently fixed by genetic drift, diversity in the new gene is expected to be reduced, and an excess of rare alleles is expected, relative to the predictions of the standard coalescent model. The expected patterns of polymorphism in segregating duplicates (“copy-number variants”) depend both on the frequency of the duplicate in the sample and on the rate of crossing over between the two loci. When the crossover rate between the ancestral gene and the copy-number variant is low, the expected pattern of variability in the ancestral gene will be similar to the predictions of models of either balancing or positive selection, if the frequency of the duplicate in the sample is intermediate or high, respectively. Simulations are used to investigate the effect of crossing over between loci, and gene conversion between the duplicate loci, on levels of variability and the site-frequency spectrum.
DUPLICATED genes are a ubiquitous feature of eukaryotic genomes. Comparative genome sequencing has revealed that distantly related organisms, such as flies, worms, yeast, and humans, have roughly similar gene numbers, but that the sizes of individual gene families vary across organisms (Rubin et al. 2000). This genome-scale observation implies that genes are gained and lost over time during the course of evolution. In the last decade, considerable attention has been placed on using comparative genomic and functional data to elucidate the evolutionary forces shaping gene families (e.g., Lynch and Conery 2000; Kondrashov et al. 2002; Gu et al. 2002a,b; Thornton and Long 2002; Gu et al. 2003; Gao and Innan 2004).
In parallel with the analysis of genomewide data, the systematic identification of recent duplication events in Drosophila species has identified several cases of lineage-specific genes, in an effort to understand the importance of natural selection in the early stages of the evolution of “new” genes (e.g., Long and Langley 1993; Wang et al. 2000, 2002, 2004; Betran et al. 2002; Betran and Long 2003; Jones et al. 2005; Loppin et al. 2005; Arguello et al. 2006; Levine et al. 2006; Fan and Long 2007). Examples of recent gene duplications have also been described in humans, mice, and plant species (reviewed in Long et al. 2003). In general, these studies consist of three parts: first, the identification of the recent duplicate; second, an investigation of patterns of polymorphism and/or divergence; and third, some assay of function, often at the level of gene expression, is performed to show that the new gene is functional.
The examples cited above all describe new genes that are fixed in population samples (the recent duplicate is found in all individuals sampled). There is currently much interest in identifying polymorphic duplications (so-called “copy-number variants,” or CNV), particularly in the human genome (Bailey et al. 2002, 2004; Cheung et al. 2003; Iafrate et al. 2004; Li et al. 2004; Sebat et al. 2004; Sharp et al. 2005, 2006; Conrad et al. 2006; Locke et al. 2006; Perry et al. 2006; Redon et al. 2006; Graubert et al. 2007), as it is believed that CNVs may be a significant contributor to the genetic basis of disease. While CNVs have been implicated in several diseases (Sharp et al. 2006; Sebat et al. 2007; reviewed in Kondrashov and Kondrashov 2006), they are also of significant evolutionary interest, as they will likely provide valuable insight into the earliest stages of the evolution of new genes.
Little is currently available in terms of a framework for analyzing polymorphism data from recent duplicates and CNVs. With regard to the analysis of single-nucleotide polymorphism data, the coalescent process (Hudson 1983; Tajima 1983) has been well studied for single-copy genes. For small gene families of size two, Innan (2003a) has described the neutral coalescent process for the case where the duplication event is ancient (i.e., the duplication fixed  generations ago), allowing for gene conversion between duplicates, which is commonly observed in polymorphism data from gene duplicates (Innan 2003b; Thornton and Long 2005; Lindsay et al. 2006; Raedt et al. 2006). In his model, the common ancestor of the two genes is reached via a gene conversion event. Here, I describe the coalescent process for the case of a recent duplication event, accounting for the fixation process of the duplication and tracing the history of both the ancestral gene, and of the recent duplicate, to the most recent common ancestor of both genes. I consider a neutral model where, at some point in the past, a randomly chosen allele of the ancestral locus was duplicated, and the duplication fixed in the population by genetic drift. Thus, the common ancestor of the gene family can be reached either via a gene conversion event or by proceeding back in time past the origination of the new gene, to the common ancestor of both genes.
When a duplicate gene has fixed recently in the population, diversity in the new gene is expected to be significantly reduced, and an excess of rare alleles is also expected. These expectations complicate the inference of positive selection on new genes using many standard population-genetic tests. Coalescent simulations are used to investigate both the effects of gene conversion between duplicates, which results in complex patterns of polymorphism, and the applicability of standard “tests of neutrality” when applied to young gene families. I find that commonly used tests of the site-frequency spectrum are not appropriate in this case, while the McDonald and Kreitman (1991) test appears to be quite conservative when gene conversion is occurring between duplicates. The simulation is easily extended to the case of copy-number variants, and I describe patterns of polymorphism in neutral CNVs using simulations.
THEORY
Here we consider the effect of a recent neutral substitution on patterns of variability. This is relevant to gene family evolution because, when no gene conversion occurs between duplicate loci, the genealogy of the recent duplicate can be studied by considering genealogies linked to recent neutral substitutions. Tajima (1990) has studied this case, showing that a reduction in diversity is expected immediately following a neutral substitution. Specifically, he derived the expectation of π, the average number of mutations between two chromosomes in a Moran model, for the case where a substitution occurs immediately before sampling. I extend Tajima's results to obtain the expectation of Tajima's (1989) D statistic, which is a summary of the site-frequency spectrum of mutations (a histogram of mutation frequencies). For a large, equilibrium population undergoing no selection, the expectation of D is 0. An excess of rare alleles results in D < 0, and D > 0 implies an excess of intermediate-frequency variants.
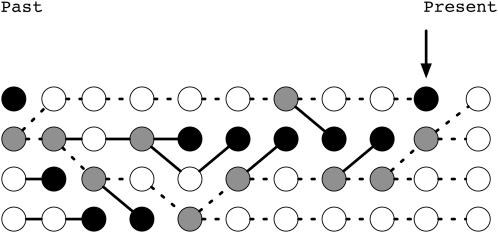
Tajima (1990) considered the gene genealogy for a Moran population of 2N chromosomes in which a neutral substitution has recently occurred. The Moran model is a simple model of overlapping populations where drift occurs in discrete time steps (Ewens 2004, p. 104). At each step, one individual is chosen to reproduce, and another is chosen to die, and it is possible that the same individual is chosen both to reproduce and to die. At some point in the process, all 2N chromosomes may be the descendant of a single ancestor, who necessarily reproduced (Figure 1). At any time step, 2N − 1 of the descendants of this ancestor may share a most recent common ancestor with each other in the more recent past than they do with the 2Nth chromosome. If any of the 2N − 1 chromosomes are chosen to reproduce, and the 2Nth is chosen to die, then a substitution occurs in the next step of the process, and all chromosomes are the descendants of a single individual in the next time step (Figure 1).
Figure 1.—
Substitution of an allele in a Moran model. Birth events are shown as gray circles and death events as black circles. The time step indicated with an arrow is immediately before a fixation event occurs. At this step, three of the chromosomes share a most recent common ancestor with each other before having a common ancestor with the fourth chromosome. One of these three chromosomes is chosen to reproduce, and the fourth is chosen to die, and a fixation event takes place (all individuals in the next step are descendants of a single reproduction event in the past). The genealogy of the substitution event is shown as dashed lines. This figure is adapted from Tajima (1990).
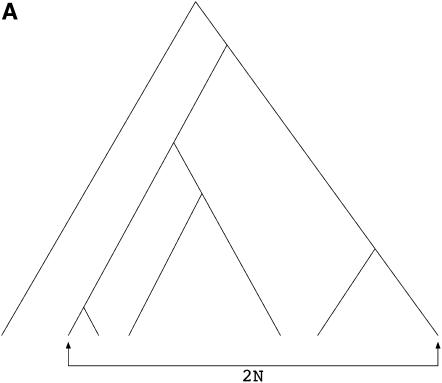
We can draw the types of genealogies where substitutions occur in the more-familiar top-down style (Figure 2A), and we see that the genealogy of the 2N chromosomes is a gene genealogy where the 2N chromosomes must reach their common ancestor before reaching the common ancestor with a (2N + 1)st chromosome. In this case, the rate of coalescence from i to i − 1 lineages in the sample is  instead of the standard
  in units of 2N generations (Tajima 1990). Using these considerations, Tajima showed that, for a genealogy completely linked to a fixation at time τ = 0 in the past (τ is in units of 4N generations),
 |
(1) |
where
 |
and θ = 4Nμ.
Figure 2.—
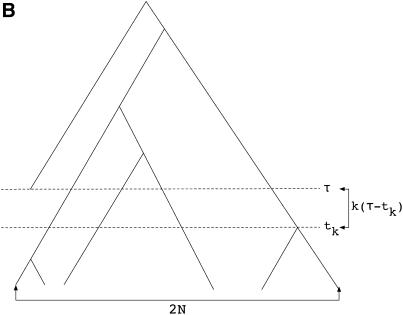
Example gene genealogies when a neutral substitution has occurred, following Tajima (1990). (A) Genealogy of 2N chromosomes linked to a fixation at time τ = 0. This is essentially a genealogy of 2N + 1 chromosomes with a (1, 2N) partition at the root of the tree. (B) Genealogy of 2N chromosomes linked to a fixation at time τ > 1/2N. This genealogy is a standard coalescent tree until τ, at which point k lineages remain in the population. From τ until the most recent common ancestor of the population, the genealogy comes from the same process as in A.
It is straightforward to extend Tajima's results to show that the expected number of segregating sites, conditional on τ = 0, is
 |
(2) |
It is possible to obtain the total time on the tree when  An example genealogy for this case is shown in Figure 2B. The ancestral process of the 2N chromosomes sampled at time t = 0 is described by the standard coalescent model, with coalescent events occurring at rate
  until time τ in the past. At time τ, the expected number of lineages remaining in the sample is
 |
which is found by rearranging the formula for the expected time to coalesce from 2N to k lineages,
 |
The total time on the tree during the time period from 0 to tk is  and if tk < τ, there are an additional k(τ − tk) units of total time to account for during the time period from 0 to τ (Figure 2B). Starting at time τ in the past, the genealogy of the k remaining lineages is described by Tajima's (1990) process, as the substitution event occurred at τ. Therefore, the rate of coalescence from k to 1 lineages is given by
  and the expectation of total time during this phase is
  Due to the Markov structure of the process, we can sum the expectations of the total times from 2N to k lineages, and from k to 1 lineage, which is the total time on the tree for fixations a time
 |
(3) |
where I(x) = 1 if the condition x is true and 0 otherwise.
Under the infinitely many-sites mutation model, the expected number of mutations given a recent neutral substitution is
 |
We can use Equations 1 and 2 to calculate the expectation of Tajima's (1989) D statistic, conditional on τ = 0. First, the expectation of Watterson's (1975)  is
is
 |
(4) |
And the expectation of D when τ = 0 is
 |
(5) |
The denominator of Equation 5 is an approximation of the variance of the numerator and is calculated using the standard equations from Tajima (1989). The expected sign of D is given by expectation of the numerator of Equation 5 and will be negative if
 |
which we can rewrite as
 |
by substituting Equations 4 and 1 into the left- and right-hand sides, respectively. The right-hand side can be simplified considerably by substituting it for Equation 13 from Tajima (1990):
 |
The θ term cancels, and the inequality is true for 2N > 15. We therefore expect D to be negative in large populations when a neutral substitution has recently occurred, and we therefore expect D to be negative for recent gene duplicates. For example, when 2N = 50, and θ = 10, E[D | τ = 0] = −0.538. Recently, McVean and Spencer (2006) used simulations to come to similar conclusions about Fu and Li's (1993) D statistic.
It is important to note that Tajima (1990) obtained Equation 1 by considering the branching patterns of genealogies under a Moran model, for which the coalescent process is exact for the entire population. Further, he considered the rate of coalescence at time t in the past to be a function of only the number of distinct lineages at time t and did not account for the frequency trajectory of the substituting allele. The alternative approach is to account for the frequency trajectory of the substituting allele, in which case the rate of coalescence is given by  where x(t) is the frequency of the allele at time t in the past. The discrepancy between these two approaches will be largest for small sample sizes. For example, when n = 5 and τ = 0 and following Tajima's arguments, the mean time to the first coalescence is
  When accounting for the frequency of the allele, the expected time to the first coalescence is
  [because x(0) = 1], resulting in a difference of
  In the simulation section below, I describe a simulation-based approach using the structured coalescent that accounts for the allele frequency trajectory. Using both coalescent and forward simulations, we see that the above formulas are good approximations for large sample sizes (say n ≥ 50).
SIMULATION
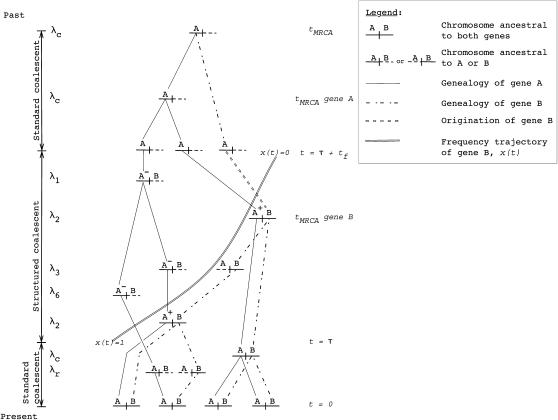
Here I describe a method for simulating the coalescent process for gene families of size two under a Wright–Fisher model. The simulation assumes that crossing over occurs between loci, but not within. Label the ancestral locus as gene A and the duplicated gene as B. The origin of B is assumed to be a randomly chosen allele from A, and we simulate the genealogy of a sample back to the most recent common ancestor (MRCA) of both genes. The genes are linked on the same chromosome and ectopic gene conversion is allowed between the two genes. The duplicate gene is assumed to have fixed at time τ in the past, and the allele frequency trajectory during fixation is a random variable. Mutations occur according to the infinitely many-sites model. Figure 3 shows an example genealogy for a gene family of size two.
Figure 3.—
Example of a gene genealogy for partially linked, duplicated genes. A sample of size n = 4 is followed back to the most recent common ancestor (MRCA) of both genes. Gene B, the recent duplicate, fixed at time τ in the past, and an “A” label represents the ancestral gene. Prior to τ, the genealogical process is the standard coalescent for two partially linked loci. At time τ, the simulation enters a structured coalescent phase, during which there are two types of chromosomes in the history of gene A. First, at any time t during the structured phase, there are chromosomes whose ancestry is in the part of the population ancestral to the duplicate. These are labeled A+. The second type has an ancestry in the portion of the population not containing the duplicate and is labeled A−. Crossing over between loci can move chromosomes between these two classes (see simulation). Note that the A+ and A− labels are necessary only during the structured phase, where one must keep track of rates of coalescence within subpopulations of different sizes. The MRCA of B is guaranteed to be reached during the structured phase, and the MRCA of B is then considered to be an allele of gene A, i.e., the mutation event that gave rise to B. After the structured phase, any remaining lineages are followed back to their MRCA according to the standard coalescent process. To the left of the recombination graph are the rates that gave rise to the chromosomes shown on the genealogy. The rates correspond to Equations 6–17.
Rates of events for a “new gene” coalescent:
At time t in the past (measured in units of 4N generations), the sample size is n = nAB + nA + nB, where nAB the number of chromosomes ancestral to both genes (Figure 3), nA is the number ancestral only to gene A, and nB the number ancestral only to gene B. At time τ in the past, the duplicate locus fixed in the population. The duration of the fixation event is tf. Prior to τ, events in the history of the sample include coalescent, crossing over between loci, and ectopic gene conversion between loci (ectopic gene conversion).
In units of 4N generations, the rate of coalescence is given by
 |
(6) |
The rate of crossover between loci is
 |
(7) |
where ρ = 4Nr is the scaled genetic distance between A and B. Ectopic gene conversion occurs at rate
 |
(8) |
where Li is the number of base pairs in the ith chromosome in the sample and 4Nc/bp is the scaled rate of gene conversion per base pair.
Structured coalescent:
At time τ, the simulation enters a structured coalescent (e.g., Hudson and Kaplan 1988; Kaplan et al. 1988; Braverman et al. 1995) phase to model the fixation of the new duplicate. At time t of the fixation process, the duplicate is at frequency x(t) in the population. Therefore, the fraction x(t) of the population bears the duplicate, and 1 − x(t) does not. During the structured phase, there are three distinct types of A chromosomes to keep track of (Figure 3). First, there are A chromosomes still linked to ancestors of B that have descendants in the sample. Second, there are A chromosomes not currently linked to ancestral B lineages, but whose ancestry is in the fraction x(t) of the population containing the duplicate (i.e., they are linked to B lineages nonancestral to the sample). Finally, there are A chromosomes whose ancestry at time t in the past is not linked to the duplicate locus. We label the first two types of A chromosomes as A+ and the third kind as A−. Examples of these types are shown in Figure 3.
I now list the rates at which events occur during the structured phase. In Equations 9–17, all rates are in units of 4N generations. Let the sample size of A− chromosomes be n1, and the rate of coalescence between A− chromosomes is
 |
(9) |
and the rate of coalescence in the rest of the sample (all A+ chromosomes, A+B pairs, and all B chromosomes) is
 |
(10) |
There are four types of crossover events to consider. First, there is crossover in an AB pair, and the ancestor of the A region has an A− label:
 |
(11) |
Second, there is crossover in an AB pair, and the ancestor of the A region has an A+ ancestor:
 |
(12) |
Third, there is crossover involving an A− chromosome, which migrates it onto the A+ background:
 |
(13) |
Finally, there is crossover involving an A− chromosome, which migrates it onto the A− background:
 |
(14) |
The rate of gene conversion from A to B is
 |
(15) |
The rate of gene conversion from B to an A− chromosome is
 |
(16) |
The rate of gene conversion from B to an A+ chromosome is
 |
(17) |
The simulation continues in the structured phase until x(t) first reaches a value ≤1/2N. At this point, all remaining chromosomes belong to the same deme, and the standard coalescent algorithm applies until the grand MRCA of the sample is reached (Figure 3). Once the structured phase is exited, one of the remaining chromosomes is the MRCA of the duplicate locus, and the origination of the duplicate is therefore a random sample of a single allele from the ancestral locus (Figure 3).
Copy number variants:
So far, we have considered only the simulation of genealogies for duplication events that are fixed in the population. The method is easily extended to duplications observed to be segregating (CNVs). To model polymorphic duplicates, one must account for the unknown population frequency of the duplication. There are two reasonable options for simulation. First, if the duplicate gene is observed in k of n chromosomes, k/n is the maximum-likelihood estimate of the population frequency of the duplicate. The second approach would be to place a prior distribution on the population frequency. A natural choice for the prior is a beta (a, b) distribution, giving the posterior distribution on the population frequency of the duplicate as beta (a + k, b + n − k) (Gelman et al. 2003, p. 40). I use the latter approach in this article, generating a new allele frequency from the posterior distribution for each simulated replicate. The prior distribution is the uniform distribution (beta (1, 1)). For the CNV model, the simulation enters the structured phase at τ = 0.
The frequency trajectory of a neutral mutation:
The fixation of the young duplication is modeled as a neutral process by simulating the trajectory of a neutral allele backward in time, from frequency x(τ) to 0, conditional on absorption at 0 (e.g., Griffiths 2003). For the case where a gene duplication is fixed, at time τ when the simulation enters the structured phase, x(τ) = 1. For a CNV, x(τ) is beta-distributed as described above. These trajectories are generated by simulating a process of small jumps in allele frequency x per time interval Δt (Coop and Griffiths 2004; Przeworski et al. 2005; Teshima and Przeworski 2006; Teshima et al. 2006). Conditional on absorption at 0, jumps in x are given by
 |
or
 |
and occur with equal probability. In the case of a selectively neutral mutation, μ*(x) = −x (Ewens 2004, p. 148). This simulation method is an accurate approximation of the diffusion process in the limit Δt → 0. In this article, Δt = 1/50N, where N = 104.
Model of ectopic gene conversion:
The model of conversion between duplicate loci is similar to Wiuf and Hein's (2000) model of conversion between alleles at a single-copy locus. The difference is that I assume that the entire duplicated region has been sampled and that the flanking regions are too divergent to be affected by gene conversion. Therefore, only events that both begin and end within the region are considered. For a fragment of L nucleotides, a conversion event begins at position i within the region and includes positions i through position i + l − 1 (i ≥ 1, i + l − 1 ≤ L).
The mean tract length is T, and tract lengths, l are sampled from the truncated geometric distribution P(l = k | k ≤ L − i + 1) using the inverse c.d.f. method, where  p = 1/T, and U is a uniformly distributed deviate from the interval (0, 1].
This model of gene conversion differs from that of Innan (2003a), who considered the case of intrachromosomal conversion (conversion between nonallelic positions on the same chromosome) affecting only one mutation per event. Here, I have relaxed that assumption, with events occurring between random chromosomes in the population and involving random amounts of DNA. Simulation results will, however, be qualitatively similar, in that increasing conversion rates will lead to fewer fixed differences, and more shared polymorphisms, between the two duplicates.
Implementation details:
Genealogies are generated using a modification of Hudson's (2002) algorithm for bookkeeping of genealogies with recombination (both gene conversion and crossing over). The simulation is written in C++, using available libraries (Thornton 2003). Source code for the coalescent simulation is available from the author's web site (http://www.molpopgen.org).
Forward simulations:
Forward simulations of a Wright–Fisher population were conducted using multinomial sampling to generate the gamete frequencies in the next generation. Mutations occur according to the infinitely many-sites model. A diploid population of 2N = 10,000 chromosomes, θ = 10, and no recombination or selection was evolved for 10N generations to reach statistical equilibrium. After reaching equilibrium, the simulation continued until a single substitution occurred, at which point independent samples of sizes 5, 25, and 50 were taken from the population and recorded. The purpose of the forward simulation in this study is to check some of the results obtained from coalescent simulations with an independent method (forward in time, rather than backward).
RESULTS
The effect of a single neutral substitution:
Here I use forward simulations to confirm the accuracy of coalescent simulations of a nonrecombining region that has experienced a single neutral substitution at time τ = 0. The expectations of π, S, and D were estimated from 105 coalescent and forward simulations, and the two simulation methods are in excellent agreement (Table 1). Also shown in Table 1 are the expectations predicted by Equations 1, 2, and 5, respectively. For large sample sizes, the simulations and the formulas are in good agreement. For smaller sample sizes, the discrepancies are rather large, because the formulas do not account for the allele frequency trajectory of the substitution event during fixation. The simulation results show that the expectation of Tajima's D statistic is negative when a fixation has occurred recently and that the expected level of diversity in the samples is also reduced.
TABLE 1.
Comparison of coalescent and forward simulations of the effect of a single neutral substitution
| n | Statistic | Coalescent | Forward | Predicted |
|---|---|---|---|---|
| 5 |  |
5.85 | 5.81 | 3.83 |
 |
12.40 | 12.35 | 9.50 | |
 |
−0.14 | −0.16 | −0.56 | |
| 25 |  |
5.81 | 5.84 | 5.45 |
 |
25.13 | 25.15 | 23.54 | |
 |
−0.51 | −0.49 | −0.44 | |
| 50 |  |
5.77 | 5.85 | 5.63 |
 |
31.13 | 31.31 | 30.19 | |
 |
−0.61 | −0.59 | −0.54 |
Predicted values are from Equations 1, 2, and 5.
Patterns of polymorphism in recent, fixed duplicates:
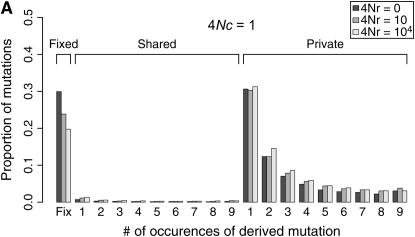
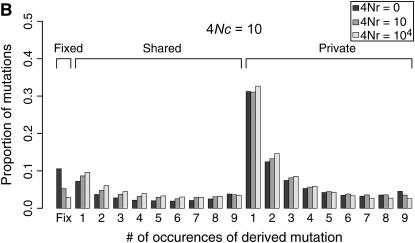
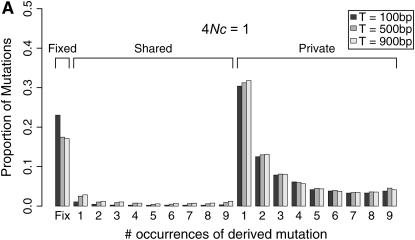
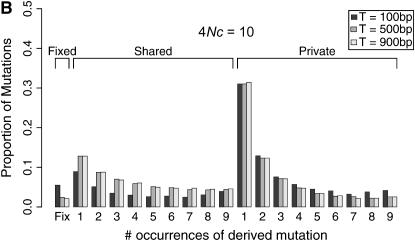
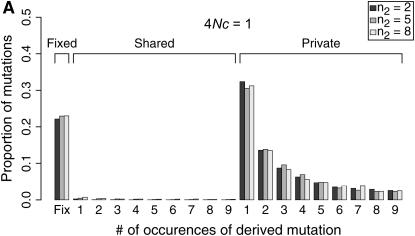
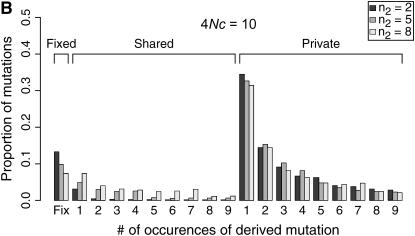
Coalescent simulations were used to study the patterns of polymorphism expected in recent gene duplicates (see the simulation section). The effect of gene conversion on the site-frequency spectrum (SFS) in the entire sample is shown in Figure 4 for a duplicate that fixed at τ = 0. As the rate of ectopic gene conversion increases, fewer fixed differences are observed between genes, and more shared polymorphisms are found in the data. As the mean length of conversion events increases, this effect becomes more pronounced (Figure 5), although there does not appear to be much of a difference between a mean tract length of  the sampled region compared to
  the region. There is also a slight effect of interlocus crossing over on the expected SFS, as crossover events cause the two loci to have different histories (Figure 3). The results in Figure 4 are qualitatively similar to those of Innan (2003a).
Figure 4.—
Expected site-frequency spectra (SFS) for a recent gene duplication event. Expected SFS were estimated by 1000 simulated replicates for n = 10 and θ = 10 for a 1000-bp region. The SFS are normalized to be independent of θ. The duplicate gene fixed at time τ = 0. The mean gene conversion tract length is 100 bp. The SFS is shown separately for fixed differences between genes, for polymorphisms shared between genes, and for private polymorphisms unique to one gene. The effect of the rate of crossing over between loci (4Nr > 0) on the SFS is because crossing over will cause the two duplicated loci to have different histories, such that the most recent common ancestor of the ancestral gene does not occur at the same time as the origin of the duplicate gene (e.g., Figure 3).
Figure 5.—
Effect of mean conversion tract length on the site frequency spectrum (SFS). Expected SFS were estimated by 1000 simulated replicates for n = 10 and θ = 10 for a 1000-bp region. The duplicate gene fixed at time τ = 0. The recombination rate between loci is 4Nr = 10. The mean length of a gene conversion between loci, T varies. The SFS are normalized to be independent of θ.
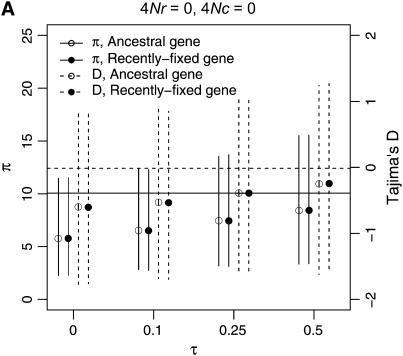
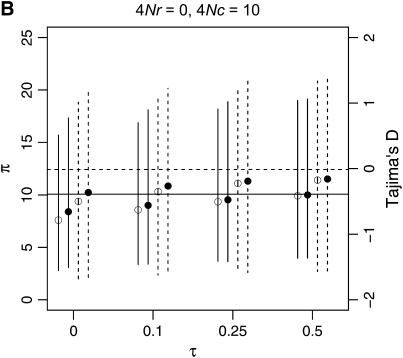
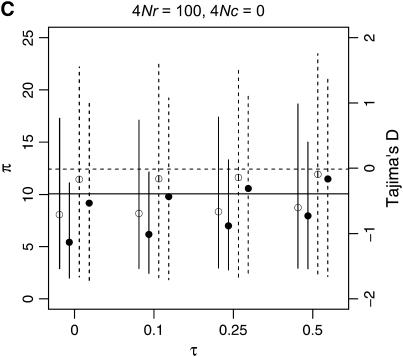
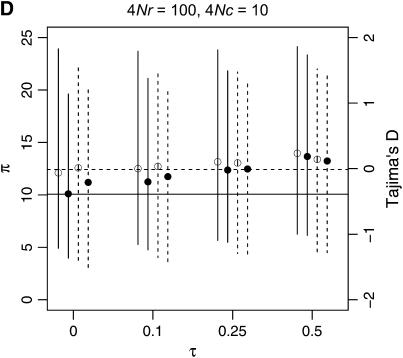
To describe patterns of polymorphism in the two genes separately, I focus on two summaries of the data, π, the mean number of pairwise differences in the sample, and D, a summary of the site-frequency spectrum. The two important qualitative results are that a reduction in diversity and a skew in the SFS of polymorphisms are expected in recent gene duplicates (Figure 6) across a range of parameters. Further, when there is neither crossing over nor conversion between loci, the ancestral gene will show the same pattern of polymorphism as the duplicate locus, since they both have the same genealogy (Figure 6A). As the fixation time of the duplicate gene becomes more ancient, the expectations of both π and D are more similar to what is expected under the standard neutral model, under which fixation events occur at random times.
Figure 6.—
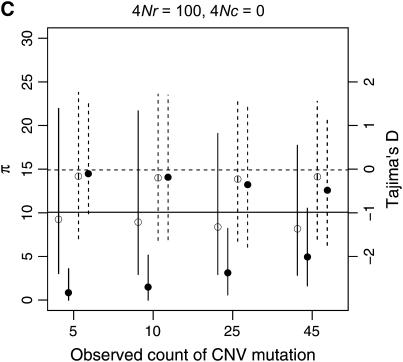
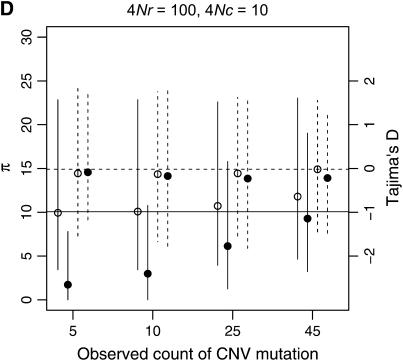
Levels of variability (π) and Tajima's (1989) D as a function of the fixation time of a gene duplication event. The means of π and D are plotted as a function of the fixation time of the duplicate, for several combinations of the crossover and gene conversion rates between loci. Vertical lines extend to the upper and lower 2.5th quantiles of the simulated distributions. Results are based on 10,000 replicates for n = 50, θ = 10, and a mean tract length of 100 bp. The horizontal lines are the expectations of π (solid) and D (dashed) for the standard neutral model of a single-copy, nonrecombining locus.
The effect of increasing rates of gene conversion is twofold. First, as the rate increases, the expectation of D becomes more positive, and the variance of the statistic becomes slightly smaller. A slightly positive D is expected even for older fixation times and higher crossover rates (e.g., Figure 6D). The genealogical intuition behind this effect is that gene conversion “migrates” some lineages ancestral to the new gene into the portion of the population not linked to the fixation event, and lineages tend not to migrate back to the new gene at more ancient times in the fixation process, as x(t) is going to 0 (Equations 15–17). The second effect of interlocus conversion on polymorphism is that the average π becomes larger than the standard neutral expectation when the conversion rate is high (Figure 6D). The effect of conversion on π depends on the rate of crossing over—when the two loci are tightly linked, variation will be reduced on average when the fixation event is recent (Figure 6C), but when crossover rates are high, E[π] > θ, even when τ = 0 (Figure 6D). For ancient duplications ( ), high rates of gene conversion result in E[π] ≈ 2θ (Innan 2003a, data not shown).
Patterns of polymorphism in copy number variants:
The observed number of occurrences of a copy-number variant affects whether or not gene conversion events are detectable as shared polymorphisms in the sample (Figure 7). When a polymorphic duplicate is rare in the sample, the duplicate allele is likely to be relatively young, and there will have been little time for gene conversion events to have occurred. When the conversion rate increases, such that 4Nc ≥ θ, shared polymorphisms will tend to be observed only as singletons unless the sample frequency of the duplicate is relatively high (compare Figure 7A to 7B).
Figure 7.—
Expected site frequency spectra (SFS) for copy-number variants. Expected SFS were estimated by 1000 simulated replicates for n = 10 and θ = 10 for a 1000-bp region, and the mean gene conversion tract length is 100 bp. The SFS are normalized to be independent of θ. The observed sample size of the polymporphic duplicate is n2. The rate of crossing over between loci is 4Nr = 10. The SFS is shown separately for fixed differences between gene duplicates, for polymorphisms shared between genes, and for private polymorphisms unique to one gene.
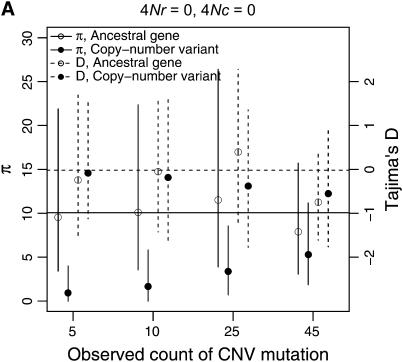
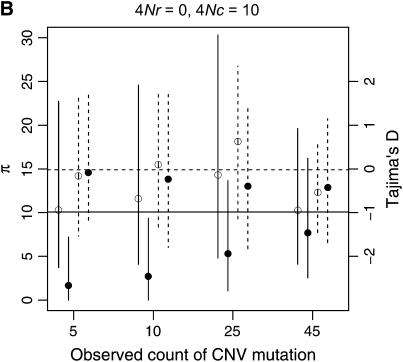
Example patterns of polymorphism for copy-number variants are illustrated in Figure 8, for a sample size of 50 chromosomes. When the duplication is rare in the sample, levels of diversity will tend to be quite low, which is expected given that the duplication is most likely a recent mutation. In general, copy number variants are not expected to show much of a skew in the site-frequency spectrum, as measured by Tajima's D, unless they are at high frequency (Figure 8). When the duplication is at high sample frequency (say ≥90%), the expectation of D will be negative, which is expected as the mutation is quite close to fixation in the population, and should thus show a pattern of polymorphism qualitatively similar to that of a fixed gene duplication (Figure 6).
Figure 8.—
Levels of variability (π) and Tajima's (1989) D as a function of the number of occurrences of a copy-number variant. The means of π and D are indicated by circles, and vertical lines extend to the upper and lower 2.5th quantiles of the simulated distributions. Results are based on 10,000 replicates for n = 50, θ = 10, and a mean tract length of 100 bp. Here, n is the sample size of the ancestral gene, and the number of occurrences of the CNV is varied. The horizontal lines are the expectations of π (solid) and D (dashed) for the standard neutral model of a single-copy, nonrecombining locus.
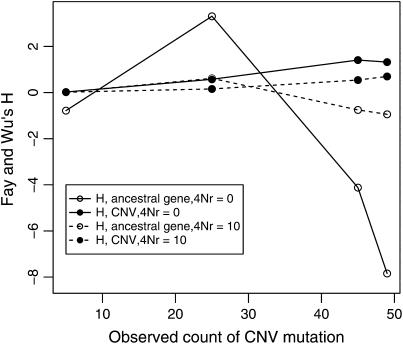
When there is tight linkage between the two loci, patterns of polymorphism are rather complex in the ancestral gene. In Figure 8A, the distributions of π and Tajima's D are summarized for the case of no crossing over and no gene conversion. When the duplicate gene is observed to be rare in the sample, D is expected to be slightly negative in both genes. When the duplicate is observed in 25 of the 50 chromosomes, D is expected to be positive in the ancestral gene and negative in the new gene. Finally, when the duplicate is at high frequency (45 of 50 in the sample), D is expected to be quite negative in both genes. The effect of sample size of the duplicate locus on D at the ancestral locus can be understood by considering that the observed sample count of the duplicate constrains the possible genealogies for the ancestral locus. For example, when there is no crossing over between loci, and the duplicate gene is present on 25 of 50 chromosomes, the 25 chromosomes bearing the new gene must reach their common ancestor before they are allowed to coalesce with the ancestors of chromosomes that do not carry the duplicate. Thus, the genealogy of the ancestral gene always contains a deep split, and a positive D is expected. Likewise, for a duplicate observed at high frequency in the sample, the genealogy of the ancestral gene will contain a deep split between relatively few lineages and many lineages, resulting in a negative D due to an excess of both rare and high-frequency derived alleles. Crossing over between loci eliminates these effects, because the genealogy of the ancestral locus can move between the duplicate-containing and duplicate-absent classes of chromosomes (compare Figures 8A and 8C). Figure 9 plots the mean of Fay and Wu's H as a function of the number of occurrences of the CNV in the sample. When there is no crossing over between loci, the expectation of H is negative in the ancestral gene when the frequency of the CNV in the sample is high, because the genealogy of the ancestral gene consists of a deep split of few lineages from the rest of the sample (see above). Thus, for evaluating hypotheses concerning the evolution of very young gene families, the standard coalescent is not an appropriate null model. It is important to consider the rate at which high-frequency derived CNVs will be observed in the genome, though. The results above consider the pattern of polymorphism given a CNV observed at a certain frequency. In a large equilibrium population with CNVs arising at rate θ in the genome, the expected number of CNVs at a frequency 1 ≤ i < n is θ/i, and therefore CNVs at frequencies such as 45 of 50 will be relatively rare.
Figure 9.—
Fay and Wu's H as a function of the frequency of a copy-number variant. The expectation of H was estimated from 1000 simulations of 50 chromosomes, with no gene conversion.
Tests of neutrality:
The expected patterns of polymorphism in recent gene duplicates differ from the prediction of the standard neutral model (SNM) of a large, constant-size population with no selection and the infinitely many-sites mutation model (Figures 6 and 8). For ancient gene duplicates, Innan (2003a) has argued that standard tests of the SNM (Hudson et al. 1987; Tajima 1989; Fu and Li 1993) do not apply when gene conversion occurs between duplicates, either because gene conversion between genes will make tests overly conservative [by reducing the true variance of the test statistic in a manner similar to standard crossing over (Hudson 1990)] or because expected levels of variability are higher for duplicated genes undergoing conversion than for single-copy loci. For these ancient gene families, however, the expectation of statistics such as Tajima's D do not differ greatly from the expectation under the SNM (see Figure 3 of Innan 2003a). In contrast, a reduction in diversity and an excess of rare alleles are expected for recent duplicates, particularly when the rate of ectopic conversion is low (Figure 6). Further, when the crossover rate between loci is low, and gene conversion is occurring, the SFS is slightly “U-shaped,” indicating an excess of high-frequency derived mutations in the sample (e.g., Figure 4B) relative to the standard neutral model.
To assess the applicability of standard tests of the SNM to recent gene duplicates, I simulated data over a range of parameters (103 samples were generated for all combinations of θ = 10, n ∈ {10, 50}, ρ ∈ {0, 10, 100}, 4Nc ∈ {0, 1, 10}, and τ ∈ {0, 0.1, 0.2}). One-tailed P-values (lower tail) for Tajima's D and Fay and Wu's (2000) H were obtained from 104 replicates simulated under the SNM with θ = 10 and no recombination of any sort. The parameter combinations that resulted in rejection rates of at least 10% are shown in Table 2. The general pattern is that, in large sample sizes (n = 50), a significantly negative Tajima's D value will be inferred up to 15% of the time, and the effect of the fixation on patterns of polymorphism may persist at least as long as 0.8N generations. Rejection rates of ≥10% were seen only for Fay and Wu's H statistic when the gene conversion rate between duplicates was high (4Nc = 10). The effect is understandable by making an analogy to the selective sweep process—some lineages have ancestors more ancient than the origin of the gene duplication, due to the effect of gene conversion. When n = 10, rejection rates for all parameter combinations for both statistics were <10%. Thus, although an excess of rare alleles is expected for small sample sizes when a neutral substitution has occurred (Table 1), the effect will be difficult to detect in small sample sizes.
TABLE 2.
Rejection rates for Tajima's D and Fay and Wu's H tests, when applied to young gene families
|
D
|
H
|
||||||
|---|---|---|---|---|---|---|---|
| n | τ | ρ | 4Nc | Ancestral gene | Duplicate | Ancestral gene | Duplicate |
| 50 | 0 | 0 | 0 | 0.100 | 0.079 | 0.002 | 0.001 |
| 1 | 0.118 | 0.108 | 0.032 | 0.030 | |||
| 10 | 0.065 | 0.049 | 0.125 | 0.139 | |||
| 10 | 0 | 0.097 | 0.148 | 0.050 | 0.006 | ||
| 1 | 0.104 | 0.139 | 0.081 | 0.049 | |||
| 10 | 0.048 | 0.056 | 0.110 | 0.117 | |||
| 0.1 | 0 | 1 | 0.091 | 0.101 | 0.039 | 0.037 | |
| 10 | 0.042 | 0.047 | 0.138 | 0.142 | |||
| 10 | 1 | 0.089 | 0.133 | 0.072 | 0.053 | ||
| 10 | 0.035 | 0.043 | 0.098 | 0.115 | |||
| 0.2 | 0 | 10 | 0.049 | 0.037 | 0.141 | 0.112 | |
| 10 | 1 | 0.101 | 0.110 | 0.095 | 0.053 | ||
| 10 | 0.031 | 0.041 | 0.119 | 0.099 | |||
| 100 | 10 | 0.023 | 0.012 | 0.099 | 0.101 | ||
Parameter combinations are shown only if the rejection rate for at least one test is at least 10% (underlined). See text for details.
The McDonald and Kreitman (1991) (MK) test has also been applied to data from duplicate loci, to test the null hypothesis that the ratio of amino acid (A) to silent (S) polymorphism within genes is the same as the A/S ratio for fixations between genes (Innan 2003a; Thornton and Long 2005; Arguello et al. 2006). For ancient gene duplications, Thornton and Long (2005) used coalescent simulations of strict neutrality to show that this application of the MK test is conservative, particularly when conversion is occurring between genes. I performed coalescent simulations of recently fixed duplicates under the same parameter combinations as described above. The total θ for a single locus was 10, split such that θ = 8 and 2 at replacement and silent sites, respectively. For each replicate, the P-value of the MK tests was obtained using Fisher's exact test. For all cases, the rejection rate for the test was <0.05, implying that the MK test is conservative when applied to data from recent duplicates (data not shown). For the highest conversion rate studied (4Nc = 10), the rejection rate was observed to be as low as 0.001. The reason for this effect is that high rates of gene conversion result in few fixed differences (Figure 4), which tends to result in high P-values for the MK test.
DISCUSSION
When a duplicate locus has either recently fixed in the genome or is still segregating in the population, the patterns of polymorphism expected in the gene family differ substantially from the predictions of the standard coalescent model, for three reasons. First, the frequency trajectory of the young duplicate gives rise to a structured coalescent process analogous to that of a selective sweep. Second, linkage between the ancestral locus and the new gene causes the two genes to have similar genealogies. Third, gene conversion between paralogs results in fragments of the two genes having correlated genealogies.
The results described here show that young duplicate genes are expected to show a reduction in diversity and an excess of rare alleles. This is an important point with respect to inferring if positive selection has acted on recent duplications, which is a critical issue in the debate over the relative roles of subfunctionalization (Force et al. 1999) vs. neofunctionalization in the preservation of duplicate genes (reviewed in Long et al. 2003). For example, a recent study of three recent duplicates in Arabidopsis thaliana observed reduced variability in two of the three genes, as well as in some of the ancestral genes (Moore and Purugganan 2003). While Moore and Purugganan interpreted this observation as evidence for recent selective sweeps, implying positive selection on new functions, the reduction in diversity in the recent duplicates may simply be a consequence of the genes having fixed recently. Similarly, ignoring concerns about the appropriate demographic model for the species, reduced diversity in the ancestral genes may be a consequence of linkage between duplicates, given that the effective rate of crossing over and gene conversion in A. thaliana is expected to be quite low due to selfing (Nordborg 2000).
Thornton and Long (2005) sequenced 12 X-linked duplicates with low divergence between duplicates at synonymous sites, and high nonsynonymous to synonymous ratios (dN/dS > 1) between duplicates, in a population sample of Drosophila melanogaster from Zimbabwe, Africa. The mean Tajima's D at third positions of codons in their data is −0.662, compared to an average of −0.186 observed in the predominantly single-copy, coding genes described in Andolfatto (2005), also sampled from Zimbabwe. It is possible that at least part of this difference in average D is due to some of the duplicates having fixed recently. Further, overall diversity is low at many of the loci, compared to the average for the species, which is also expected if the genes are young. However, the distribution of P-values for the MK test between genes shows an excess of low values (Thornton and Long 2005), and the neutrality index (Rand and Kann 1996) is <1 for most comparisons, suggesting positive selection on amino acid fixations. Given that summaries of the data such as D and levels of diversity are confounded not only by the age of the duplication and the rate of gene conversion, but also by demographic history and the possibility that levels of selective constraint differ between single-copy and duplicate loci, it is possible that approaches based on the MK test will be the most fruitful in studying the role of selection in young genes.
In Drosophila species, several copy-number variants have been described in natural populations (Takano et al. 1989; Lange et al. 1990; Lootens et al. 1993), although levels of variability at the nucleotide level remain unstudied. In humans, the emphasis so far has been on the description of genomewide patterns of CNVs (see Introduction), although SNP data from copy-number variants will likely be available soon. Although the major motivation to study CNVs in humans has been the potential that they are involved in the genetic basis of diseases, there is also the potential to learn about the evolutionary forces shaping young genes that are still segregating in natural populations. The simulations performed in this study suggest that rare CNV mutants will be low in diversity, which may make it difficult to infer the role of selection on such polymorphisms in the genome. However, such data will be very informative about the number of polymorphic pseudogenes and functional genes in the human and other genomes. Further, studying the genomewide site-frequency spectrum of polymorphic pseudogenes and functional genes will be informative about the role of selection on duplicates during processes of fixation in, or loss from, the genome.
The coalescent model presented here is highly simplified. Some of these simplications, such as no intragenic crossing over or gene conversion, are easily incorporated. Others, such as more complex models of gene conversion, are more difficult and may be better studied by forward simulation. For example, Teshima and Innan (2004) considered a model where gene conversion events are allowed to occur until divergence between duplicates reached some threshold value. Such models violate the assumption of the coalescent process that the genealogy can be studied independently of the mutation process, and hence Teshima and Innan used a forward simulation approach. An additional biological complication arises from the observation that large duplications suppress local rates of crossing over when heterozygous (Roberts and Broderick 1982), suggesting that CNVs may contribute to heterogeneity in local recombination rates and variation in the decay of linkage disequilibrium across regions of the genome.
In this study, I assumed that the fixation of the gene duplicate occurred by drift. It is straightforward to incorporate simple models of directional selection into the simulation, by replacing the neutral frequency trajectory with one for a positively selected mutation (Coop and Griffiths 2004). The most obvious effect of a fixation by positive selection is a more pronounced skew in the site-frequency spectrum when selection is very strong. A second effect is fewer shared polymorphisms between gene duplicates, as the rate of coalescence during the sweep becomes much faster than the rate of conversion.
Acknowledgments
I thank Jeffrey Ross-Ibara, Graham Coop, and two anonymous reviewers for helpful comments on the manuscript.
References
- Andolfatto, P., 2005. Adaptive evolution of non-coding DNA in Drosophila. Nature 437: 1149–1152. [DOI] [PubMed] [Google Scholar]
- Arguello, J. R., Y. Chen, S. Yang, W. Wang and M. Long, 2006. Origination of an X-linked testes chimeric gene by illegitimate recombination in Drosophila. PLoS Genet. 2: e77. [DOI] [PMC free article] [PubMed] [Google Scholar]
- Bailey, J. A., Z. Gu, R. A. Clark, K. Reinert, R. V. Samonte et al., 2002. Recent segmental duplications in the human genome. Science 297: 1003–1007. [DOI] [PubMed] [Google Scholar]
- Bailey, J. A., D. M. Church, M. Ventura, M. Rocchi and E. E. Eichler, 2004. Analysis of segmental duplications and genome assembly in the mouse. Genome Res. 14: 789–801. [DOI] [PMC free article] [PubMed] [Google Scholar]
- Betran, E., and M. Long, 2003. Dntf-2r, a young Drosophila retroposed gene with specific male expression under positive Darwinian selection. Genetics 164: 977–988. [DOI] [PMC free article] [PubMed] [Google Scholar]
- Betran, E., K. Thornton and M. Long, 2002. Retroposed new genes out of the X in Drosophila. Genome Res. 12: 1854–1859. [DOI] [PMC free article] [PubMed] [Google Scholar]
- Braverman, J. M., R. R. Hudson, N. L. Kaplan, C. H. Langley and W. Stephan, 1995. The hitchhiking effect on the site frequency-spectrum of DNA polymorphisms. Genetics 140: 783–796. [DOI] [PMC free article] [PubMed] [Google Scholar]
- Cheung, J., X. Estivill, R. Khaja, J. R. MacDonald, K. Lau et al., 2003. Genome-wide detection of segmental duplications and potential m assembly errors in the human genome sequence. Genome Biol. 4: R25. [DOI] [PMC free article] [PubMed] [Google Scholar]
- Conrad, D. F., T. D. Andrews, N. P. Carter, M. E. Hurles and J. K. Pritchard, 2006. A high-resolution survey of deletion polymorphism in the human genome. Nat. Genet. 38: 75–81. [DOI] [PubMed] [Google Scholar]
- Coop, G., and R. C. Griffiths, 2004. Ancestral inference on gene trees under selection. Theor. Popul. Biol. 66: 219–232. [DOI] [PubMed] [Google Scholar]
- Ewens, W., 2004. Mathematical Population Genetics I. Theoretical Introduction, Ed. 2. Springer-Verlag, Berlin/Heidelberg, Germany/New York.
- Fan, C., and M. Long, 2007. A new retroposed gene in Drosophila heterochromatin detected by microarray-based genomic hybridization. J. Mol. Evol. 64: 272–283. [DOI] [PubMed] [Google Scholar]
- Fay, J., and C.-I. Wu, 2000. Hitchhiking under positive Darwinian selection. Genetics 155: 1405–1413. [DOI] [PMC free article] [PubMed] [Google Scholar]
- Force, A., M. Lynch, F. B. Pickett, A. Amores, Y. L. Yan et al., 1999. Preservation of duplicate genes by complementary, degenerative mutations. Genetics 151: 1531–1545. [DOI] [PMC free article] [PubMed] [Google Scholar]
- Fu, Y. X., and W. H. Li, 1993. Statistical tests of neutrality of mutations. Genetics 133: 693–709. [DOI] [PMC free article] [PubMed] [Google Scholar]
- Gao, L. Z., and H. Innan, 2004. Very low gene duplication rate in the yeast genome. Science 306: 1367–1370. [DOI] [PubMed] [Google Scholar]
- Gelman, A., J. B. Carlin, H. S. Stern and D. B. Rubin, 2003. Bayesian Data Analysis, Ed. 2. Chapman & Hall/CRC, London/New York.
- Graubert, T. A., P. Cehan, D. Edwin, R. R. Selzer, T. A. Richmond et al., 2007. A high-resolution map of segmental DNA copy number variation in the mouse genome. PLoS Genet. 3: e3. [DOI] [PMC free article] [PubMed] [Google Scholar]
- Griffiths, R. C., 2003. The frequency spectrum of a mutation, and its age, in a general diffusion model. Theor. Popul. Biol. 64: 241–251. [DOI] [PubMed] [Google Scholar]
- Gu, Z., D. Nicolae, H. Lu and W. Li, 2002. a Rapid divergence in expression between duplicate genes inferred from microarray data. Trends Genet. 18: 609–613. [DOI] [PubMed] [Google Scholar]
- Gu, Z. L., A. Cavalcanti, F. C. Chen, P. Bouman and W. H. Li, 2002. b Extent of gene duplication in the genomes of Drosophila, nematode, and yeast. Mol. Biol. Evol. 19: 256–262. [DOI] [PubMed] [Google Scholar]
- Gu, Z. L., L. M. Steinmetz, X. Gu, C. Scharfe, R. W. Davis et al., 2003. Role of duplicate genes in genetic robustness against null mutations. Nature 421: 63–66. [DOI] [PubMed] [Google Scholar]
- Hudson, R. R., 1983. Properties of a neutral allele model with intragenic recombination. Theor. Popul. Biol. 23: 183–201. [DOI] [PubMed] [Google Scholar]
- Hudson, R. R., 1990. Gene genealogies and the coalescent process, pp. 1–42 in Oxford Surveys in Evolutionary Biology, Vol. 7, edited by D. Futuyama and J. Antonovics. Oxford University Press, Oxford.
- Hudson, R. R., 2002. Generating samples under a Wright-Fisher neutral model of genetic variation. Bioinformatics 18: 337–338. [DOI] [PubMed] [Google Scholar]
- Hudson, R. R., and N. L. Kaplan, 1988. The coalescent process in models with selection and recombination. Genetics 120: 831–840. [DOI] [PMC free article] [PubMed] [Google Scholar]
- Hudson, R. R., M. Kreitman and M. Aguade, 1987. A test of neutral molecular evolution based on nucleotide data. Genetics 116: 153–159. [DOI] [PMC free article] [PubMed] [Google Scholar]
- Iafrate, A. J., L. Feuk, M. N. Rivera, M. L. Listewnik, P. K. Donahow et al., 2004. Detection of large-scale variation in the human genome. Nat. Genet. 36: 949–951. [DOI] [PubMed] [Google Scholar]
- Innan, H., 2003. a The coalescent and infinite-site model of a small multigene family. Genetics 163: 803–810. [DOI] [PMC free article] [PubMed] [Google Scholar]
- Innan, H., 2003. b A two-locus gene conversion model with selection and its application to the human RHCE and RHD genes. Proc. Natl. Acad. Sci. USA 100: 8793–8798. [DOI] [PMC free article] [PubMed] [Google Scholar]
- Jones, C. D., A. W. Custer and D. J. Begun, 2005. Origin and evolution of a chimeric fusion gene in Drosophila subobscura, D. madeirensis and D. guanche. Genetics 170: 207–219. [DOI] [PMC free article] [PubMed] [Google Scholar]
- Kaplan, N. L., T. Darden and R. R. Hudson, 1988. The coalescent process in models with selection. Genetics 120: 819–829. [DOI] [PMC free article] [PubMed] [Google Scholar]
- Kondrashov, F., I. Rogozon, Y. Wolf and E. Koonin, 2002. Selection in the evolution of gene duplications. Genome Biol. 3: 0008.1–0008.9. [DOI] [PMC free article] [PubMed] [Google Scholar]
- Kondrashov, F. A., and A. S. Kondrashov, 2006. Role of selection in fixation of gene duplications. J. Theor. Biol. 239: 141–151. [DOI] [PubMed] [Google Scholar]
- Lange, B. W., C. H. Langley and W. Stephan, 1990. Molecular evolution of Drosophila metallothionein genes. Genetics 126: 921–932. [DOI] [PMC free article] [PubMed] [Google Scholar]
- Levine, M., C. D. Jones, A. D. Kern, H. A. Lindfors and D. J. Begun, 2006. Novel genes derived from noncoding DNA in Drosophila melanogaster are frequently X-linked and exhibit testis-biased expression. Proc. Natl. Acad. Sci. USA 103: 9935–9939. [DOI] [PMC free article] [PubMed] [Google Scholar]
- Li, J., T. Jiang, J.-H. Mao, A. Balmain, L. Peterson et al., 2004. Genomic segmental polymorphisms in inbred mouse strains. Nat. Genet. 36: 952–954. [DOI] [PubMed] [Google Scholar]
- Lindsay, S. J., M. Khajavi, J. R. Lupski and M. E. Hurles, 2006. A chromosomal rearrangement hotspot can be identified from population genetic variation and is coincident with a hotspot for allelic recombination. Am. J. Hum. Genet. 79: 890–902. [DOI] [PMC free article] [PubMed] [Google Scholar]
- Locke, D. P., A. J. Sharpe, S. A. McCarroll, S. D. McGrath, T. L. Newman et al., 2006. Linkage disequilibrium and heritability of copy-number polymorphisms within duplicated regions of the human genome. Am. J. Hum. Genet. 79: 275–290. [DOI] [PMC free article] [PubMed] [Google Scholar]
- Long, M., E. Betran, K. Thornton and W. Wang, 2003. The origin of new genes: glimpses from the young and old. Nat. Rev. Genet. 4: 865–875. [DOI] [PubMed] [Google Scholar]
- Long, M. Y., and C. H. Langley, 1993. Natural-selection and the origin of jingwei, a chimeric processed functional gene in Drosophila. Science 260: 91–95. [DOI] [PubMed] [Google Scholar]
- Lootens, S., J. Burnett and T. B. Friedman, 1993. An intraspecific gene duplication polymorphism of the urate oxidase gene of Drosophila virilis: a genetic and molecular analysis. Mol. Biol. Evol. 10: 635–646. [DOI] [PubMed] [Google Scholar]
- Loppin, B., D. Lepetit, S. Dorus, P. Couble and T. L. Karr, 2005. Origin and neofunctionalization of a Drosophila paternal effect gene essential for zygote viability. Curr. Biol. 15: 87–93. [DOI] [PubMed] [Google Scholar]
- Lynch, M., and J. S. Conery, 2000. The evolutionary fate and consequences of duplicate genes. Science 290: 1151–1155. [DOI] [PubMed] [Google Scholar]
- McDonald, J., and M. Kreitman, 1991. Adaptive protein evolution at the Adh locus in Drosophila. Nature 351: 652–654. [DOI] [PubMed] [Google Scholar]
- McVean, G., and C. A. Spencer, 2006. Scanning the human genome for signals of selection. Curr. Opin. Genet. Dev. 16: 624–629. [DOI] [PubMed] [Google Scholar]
- Moore, R. C., and M. D. Purugganan, 2003. The early stages of duplicate gene evolution. Proc. Natl. Acad. Sci. USA 100: 15,682–15,687. [DOI] [PMC free article] [PubMed] [Google Scholar]
- Nordborg, M., 2000. Linkage disequilibrium, gene trees and selfing: an ancestral recombination graph with partial self-fertilization. Genetics 154: 923–929. [DOI] [PMC free article] [PubMed] [Google Scholar]
- Perry, G. H., J. Tchinda, S. D. McGrath, J. Zhang, S. R. Picker et al., 2006. Hotspots for copy number variation in chimpanzees and humans. Proc. Natl. Acad. Sci. USA 103: 8006–8011. [DOI] [PMC free article] [PubMed] [Google Scholar]
- Przeworski, M., G. Coop and J. D. Wall, 2005. Signature of positive selection on standing variation. Evolution 59: 2312–2323. [PubMed] [Google Scholar]
- Raedt, T. D., M. Stephens, I. Heyns, H. Brems, D. Thijs et al., 2006. Conservation of hotspots for recombination in low-copy repeats associated with the NF1 microdeletion. Nat. Genet. 38: 1419–1423. [DOI] [PubMed] [Google Scholar]
- Rand, D. M., and L. M. Kann, 1996. Excess amino acid polymorphism in mitochondrial DNA: contrasts among genes from Drosophila, mice and humans. Mol. Biol. Evol. 13: 735–748. [DOI] [PubMed] [Google Scholar]
- Redon, R., S. Ishikawa, K. R. Fitch, L. Feuk, G. H. Perry et al., 2006. Global variation in copy number in the human genome. Nature 444: 444–453. [DOI] [PMC free article] [PubMed] [Google Scholar]
- Roberts, P. A., and D. J. Broderick, 1982. Properties and evolutionary potential of newly induced tandem duplications in Drosophila melanogaster. Genetics 102: 75–89. [DOI] [PMC free article] [PubMed] [Google Scholar]
- Rubin, G. M., M. D. Yandell, J. R. Wortman, G. L. G. Miklos, C. R. Nelson et al., 2000. Comparative genomics of the eukaryotes. Science 287: 2204–2215. [DOI] [PMC free article] [PubMed] [Google Scholar]
- Sebat, J., B. Lakshmi, J. Troge, J. Alexander, J. Young et al., 2004. Large-scale copy number polymorphism in the human genome. Science 305: 525–528. [DOI] [PubMed] [Google Scholar]
- Sebat, J., B. Laksmi, D. Malhotra, J. Troge, C. Lese-Martin et al., 2007. Strong association of de novo copy number mutations with autism. Science 316: 445–449. [DOI] [PMC free article] [PubMed] [Google Scholar]
- Sharp, A. J., D. P. Locke, S. D. McGrath, J. A. Bailey, R. U. Vallente et al., 2005. Segmental duplications and copy-number variation in the human genome. Am. J. Hum. Genet. 77: 78–88. [DOI] [PMC free article] [PubMed] [Google Scholar]
- Sharp, A. J., S. Hansen, R. R. Selzer, Z. Cheng, R. Regan et al., 2006. Discovery of previously unidentified genomic disorders from the duplication architecture of the human genome. Nat. Genet. 38: 1038–1042. [DOI] [PubMed] [Google Scholar]
- Tajima, F., 1983. Evolutionary relationship of DNA sequences in finite populations. Genetics 105:437–460. [DOI] [PMC free article] [PubMed] [Google Scholar]
- Tajima, F., 1989. Statistical-method for testing the neutral mutation hypothesis by dna polymorphism. Genetics 123: 585–595. [DOI] [PMC free article] [PubMed] [Google Scholar]
- Tajima, F., 1990. Relationship between DNA polymorphism and fixation time. Genetics 125: 447–454. [DOI] [PMC free article] [PubMed] [Google Scholar]
- Takano, T., S. Kusakabe, A. Koga and T. Mukai, 1989. Polymorphism for the number of tandemly multiplicated glycerol-3-phosphate dehydrogenase genes in Drosophila melanogaster. Proc. Natl. Acad. Sci. USA 86: 5000–5004. [DOI] [PMC free article] [PubMed] [Google Scholar]
- Teshima, K. M., and H. Innan, 2004. The effect of gene conversion on the divergence between duplicated genes. Genetics 166: 1553–1560. [DOI] [PMC free article] [PubMed] [Google Scholar]
- Teshima, K. M., and M. Przeworski, 2006. Directional positive selection on an allele of arbitrary dominance. Genetics 172: 713–718. [DOI] [PMC free article] [PubMed] [Google Scholar]
- Teshima, K. M., G. Coop and M. Przeworski, 2006. How reliable are empirical genome scans for selective sweeps? Genome Res. 16: 702–712. [DOI] [PMC free article] [PubMed] [Google Scholar]
- Thornton, K., 2003. libsequence: a C++ class library for evolutionary genetic analysis. Bioinformatics 19: 2325–2327. [DOI] [PubMed] [Google Scholar]
- Thornton, K., and M. Long, 2002. Rapid divergence of gene duplicates on the Drosophila melanogaster X chromosome. Mol. Biol. Evolution, 19:918–925. [DOI] [PubMed]
- Thornton, K., and M. Long, 2005. Excess of amino acid substitutions relative to polymorphism between X-linked duplications in Drosophila melanogaster. Mol. Biol. Evol. 22: 273–284. [DOI] [PubMed] [Google Scholar]
- Wang, W., J. M. Zhang, C. Alvarez, A. Llopart and M. Long, 2000. The origin of the jingwei gene and the complex modular structure of its parental gene, yellow emperor, in Drosophila melanogaster. Mol. Biol. Evol. 17: 1294–1301. [DOI] [PubMed] [Google Scholar]
- Wang, W., F. G. Brunet, E. Nevo and M. Long, 2002. Origin of sphinx, a young chimeric RNA gene in Drosophila melanogaster. Proc. Natl. Acad. Sci. USA 99: 4448–4453. [DOI] [PMC free article] [PubMed] [Google Scholar]
- Wang, W., H. Yu and M. Long, 2004. Duplication-degeneration as a mechanism of gene fission and the origin of new genes in Drosophila species. Nat. Genet. 5: 523–537. [DOI] [PubMed] [Google Scholar]
- Watterson, G. A., 1975. On the number of segregating sites in genetic models without recombination. Theor. Popul. Biol. 7: 256–276. [DOI] [PubMed] [Google Scholar]
- Wiuf, C., and J. Hein, 2000. The coalescent with gene conversion. Genetics 155: 451–462. [DOI] [PMC free article] [PubMed] [Google Scholar]


