

Abstract
Wiring cost minimization has successfully explained many structures of nervous systems. However, in the nematode Caenorhabditis elegans, for which anatomical data are most detailed, wiring economy is thought to play only a partial role and alone has failed to account for the grouping of neurons into ganglia [Chen BL, Hall DH, Chklovskii DB (2006) Proc Natl Acad Sci USA 103:4723–4728; Kaiser M, Hilgetag CC (2006) PLoS Comput Biol 2:e95; Ahn Y-Y, Jeong H, Kim BJ (2006) Physica A 367:531–537]. Here, we test the hypothesis that optimally wired subnetworks can exist within nonoptimal networks, thus allowing wiring economy to give an improved prediction of spatial structure. We show in C. elegans that the small subnetwork of wires connecting sensory and motor neurons with sensors and muscles, comprising only 15% of connections, is close to optimal and alone predicts the main features of the spatial segregation of neurons into ganglia and encephalization. Moreover, a method to dissect networks into optimal and nonoptimal components is shown to find a large near-optimal subnetwork of 84% of neurons with a very low position error of 5.4%, and that explains clustering of neurons into ganglia and encephalization to fine detail. In general, we expect realistic networks not to be globally optimal in wire cost. We thus propose the strategy of using near-optimal subnetworks to understand neuroanatomical structure.
Keywords: encephalization, ganglia, optimization, wiring economy, anatomy
Why do neurons organize spatially in ganglia, strata, brain areas, and maps? Spatial patterns might have several origins. Evolutionary and developmental constraints underlie spatial organization in nervous systems (1). Neuromodulation can be more effective when neurons form spatial groups (2). Processing can require the use of different wire lengths and a spatial organization of delays (3). Wiring economy (4) can also explain spatial patterns and has the advantage of being quantitatively testable. This principle states that the morphology of nervous systems is such that the cost of interconnecting its parts is the minimum possible given that the conditions for the proper functioning of the system are met. It is simple to see that wiring economy can result in the organization of the nervous system into spatial structures. Imagine, for example, the simple case of two types of neurons, say, R or L neurons responding to the excitation of right and left eyes in a human, respectively. If R neurons are heavily connected among themselves and the same for the L neurons, whereas the R–L connections are few, it can save wire to have the R neurons and L neurons segregated into two different spatial groups, because mixing them would increase the amount of wire used.
The wiring economy principle has been applied to many structures in nervous systems. It has been used to explain large brain structures, such as the existence of brain areas (5), neocortical folding (6), retinotopic maps (7, 8), ocular dominance patterns (5, 9), orientation maps (5, 10, 11), segregation of gray and white matter (12–14), and the arrangement of areas in vertebrate cortex and ganglia in C. elegans (15–18). Wiring economy has also been used to explain the structure of neurons, including their dimensions (19–21) and branching angles (22, 23).
The most detailed application of wiring economy has been to the entire nervous system of Caenorhabditis elegans (24). These authors updated the wiring diagram of C. elegans (25, 26) and used methods developed previously for circuit board design (27, 28) to predict neuronal layout (18). Predicted positions differed from actual ones on average <10% the length of the animal. These results showed that wiring economy is at work in C. elegans, but the layout was found to be nonoptimal (29, 30). The actual spatial organization in distinct ganglia could not be obtained from wiring economy applied to the complete network unless extra factors related to axonal guidance and command neuron function were added to the theoretical prediction (24).
Here, we use wiring economy alone to predict the clustering of neurons in ganglia in C. elegans. The article is organized as follows. First, we show that the optimization of the subnetwork of connections from sensory and motor neurons to sensors and muscles, respectively, is responsible for the main features of the clustering in ganglia. Second, we show that wiring economy further applied to the connections among sensory and motor neurons lowers the mean error of predicted neuron positions and improves details of the prediction of clustering. Third, we propose a method to dissect networks into optimal and nonoptimal components. Application to the experimental configuration of neurons in C. elegans finds an optimal subnetwork of 84% of neurons that explains the neuroanatomy of the animal down to fine details and using only wiring economy.
Results
Wiring Optimization of Complete Network Does Not Predict Actual Clustering.
The C. elegans network is formed by 279 neurons, excluding pharyngeal and unconnected neurons, organized in clusters known as ganglia (Fig. 1A; see ref. 25). There are 10 ganglia known as anterior (G1 in Fig. 1A), dorsal (G2), lateral (G3), ventral (G4), retrovesicular (G5), posterolateral (G6), ventral cord (G7), preanal (G8), dorsorectal (G9), and lumbar (G10). Ganglia G1–G5 are clustered in the head and G8–G10 in the tail. The head also has a high concentration of synapses in a region known as nerve ring. There are 73 sensory neurons (neurons connected to sensors and other neurons), 113 motor neurons (neurons connected to muscles and other neurons), 13 neurons that are simultaneously sensory and motor, and 80 interneurons (neurons connected only to other neurons).
Fig. 1.

Optimization of the complete C. elegans network fails to predict actual clustering. (A) Soma positions in the actual nematode are organized in spatial clusters known as ganglia. (B) Soma positions in the actual nematode. Somas in different ganglia are offset for clarity. (C) Soma position obtained by minimizing the wiring cost of the complete network. Neurons in different ganglia in the actual network are offset for clarity. (D) Average distance between somas belonging to the same ganglion (diagonal elements) and different ganglia (nondiagonal elements) for the actual nematode. (E) Same as D but obtained for soma positions minimizing the total wiring cost. (F) Average number of connections per neuron between ganglia. Diagonal squares, connections between neurons belonging to the same ganglion; nondiagonal squares, connections between neurons belonging to different ganglia. White boxes enclose regions of the graph corresponding to ganglia overlapping in the one dimension considered. Elements with a value of exactly 0 are colored in black. (G) Average number of connections per neuron between ganglia and organs that lie in each of the 10 bins we divided the length of the nematode. White boxes enclose regions corresponding to connections between ganglia and organs located at the same position in the body as the ganglion. Elements with a value of exactly 0 are colored in black. C and E were obtained with α = β = 1/29.3.
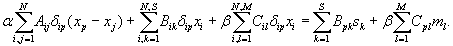
We adopt the “dedicated wire” cost model of (24) for the C. elegans network. Because the length of this nervous system is more than 10 times its diameter, the model considers a single dimension for simplicity. The network is modeled as a set of nodes representing the cell bodies connected by wires, which represent axons and dendrites. Although in C. elegans each axon makes more than one synapse, the model in principle assumes that each synapse has a dedicated wire. The total wiring cost W is written as the sum of three costs, one for connections among neurons, a second one for connections between neurons and sensors, and a third one for connections between neurons and disp
 |
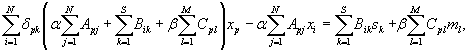
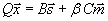
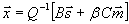
with Aij, Bik, and Cil the number of synapses between neurons i and j, neuron i and sensor k, and neuron i and muscle l, respectively. N, S, and M are the number of neurons, sensors, and muscles, respectively. xi is the 1D projection of the position of neuron i, with sk and ml analogously for the fixed positions of sensor k and muscle l, respectively. All positions have values from 0 to 1 (where 0 is the head and 1 is the tail). The 1/2 factor multiplying Aij takes into account the fact that the distance between each pair of neurons is summed twice (note that A is a symmetric matrix). α and β are normalization constants to take into account differences in average cost of the sensory neuron, motor neuron, and interneuron groups. These coefficients can account, for example, for part of the difference between the structure of the “dedicated wire” model and the real network. In the actual network, each neurite that connects two neurons or a neuron and a muscle holds on average 29.3 synapses. Because the model assumes a wire per synapse, the extra cost can be discounted by dividing the wire cost of neuron-to-neuron and neuron-to-muscle connections by 29.3, that is, by making 1/α = 1/β = 29.3 (24). On the other hand, actual connections between neurons and sensors do have a dedicated neurite for each synapse, so, in this case, the model is already in good agreement with reality. Wire cost may be due, for example, to wire volume (5, 18, 22), signal delay and attenuation (31, 32), metabolic costs (33, 34), noise and developmental costs (35). Its functional form is unknown but it is clear that it should increase with wire length. Here, it is written as a power ξ of the wire length. Because wiring cost minimization is analytical for the quadratic case, ξ = 2, results have always been obtained for this exponent except where indicated otherwise. Numerical tests suggest that these results are robust with respect to a change in the precise form of the cost (see Materials and Methods). The optimal neuron positions minimizing the total cost W in Eq. 1 for ξ = 2 can be obtained analytically as follows [see refs. 18, 27, and 28 and supporting information (SI) Text]:
 |
The optimal positions of the 279 nonpharyngeal neurons calculated from Eq. 2 and using the connectivity matrices and sensor and muscle positions of the real nematode (see Materials and Methods) compare well with the actual positions of the somas with a low average error of ep = 9.71%, much lower than the average error of random positions, ep,rand = 34.6% (24). However, the correct clustering is not predicted by wire cost minimization of the full network (Fig. 1 B–E). Neurons within each ganglion are closer to each other than to neurons in other ganglia, although in the 1D projection some ganglia overlap. The first five ganglia, located in the head of the nematode, are compact and overlap in the 1D projection. The same happens with the last three, which are located in the tail. The other two (ganglia 6 and 7) are much more elongated and located at the mid-body region. Fig. 1B shows the positions of the neurons along the actual nematode, grouped by ganglia, and offset for clarity. Fig. 1C shows the positions of the predicted positions of somas obtained from wire cost minimization applied to the complete network. As in Fig. 1B, neurons are grouped by ganglia in the actual animal and offset for clarity. Neurons belonging to the same ganglion in the actual network are now dispersed. Fig. 1D shows for the actual nematode the mean distance between neurons in the same ganglion (diagonal squares), and between neurons that lie in different ganglia (off-diagonal squares) (see Materials and Methods). The clustering structure seen in the actual nematode, Fig. 1D, is however very different to the one predicted by wire cost minimization applied to the complete network (Fig. 1E; see also Fig. 1C for an intuitive picture). To quantify how far the predicted clustering structure is from the actual one, we subtracted the clustering graphs in Fig. 1 D and E and calculated the mean resulting value as the clustering error, ec = Σi,jG|aij(actual) − aij(predicted)|/G2, where G = 10 is the number of ganglia, and aij(actual) and aij(predicted) are the elements of the actual and predicted clustering graphs, respectively. The clustering error ec has values between 0 (perfect prediction) and 1 (animal length), and we multiply it by 100 to give values as percentage of animal length, similarly to the neuron position error. Its value for the optimization of the complete network is ec = 16.4% the length of the animal, a value closer to the case of random positions, ec,rand = 21.8%, than to a perfect prediction. In the following, we always use the notation ec for clustering error as defined above and ep for average position error.
Although the actual clustering in C. elegans is not consistent with wiring cost minimization of the complete network, we wondered whether it could be consistent with wiring economy of subnetworks. If clustering is due to wiring economy, there could be in principle the following two simple scenarios for its origin. Wiring economy would predict clustering when there are more connections within a group of neurons than between neurons belonging to different groups. In this case, neurons belonging to the same group or ganglion would cluster to minimize the cost of intra-ganglion wires. Fig. 1F shows the number of connections per neuron between the neurons of the same ganglion (diagonal elements) and between neurons of different ganglia (off-diagonal elements). Elements representing exactly 0 connections per neuron are colored in black. Clustering would naturally arise in the optimal layout if diagonal elements were much stronger than nondiagonal ones. Furthermore there should be much higher connectivity between ganglia that are close to each other (e.g., ganglia 1 to 5) than between distant ganglia (e.g., ganglia 3 and 10). White lines in Fig. 1F limit these regions of the graph for which high connectivity between ganglia would be consistent with the actual layout. For example, elements within the big white box in the lower-left corner represent connectivity among the first five ganglia, which are very close to each other in the actual nematode. The other two white boxes have a similar interpretation. Elements outside the white boxes represent connectivity between distant ganglia. Although elements with highest connectivity values lie within the white boxes, elements outside them are also important with each ganglion connected to almost all ganglia, so a simple picture for clustering does not emerge.
An alternative explanation for the clustering of neurons in ganglia would consist in a high interconnectivity between neurons and sensors and muscles. Fig. 1G shows the number of connections per neuron between each ganglion and the organs, sensors and muscles, located within small segments of the nematode. In this case, the connectivity is much more consistent with the actual layout of the ganglia: ganglia 1 to 5 are strongly connected to a small region at the head of the nematode, ganglia 6 and 7 are connected to a large region in the middle of the body, and ganglia 8 to 10 are connected to a small region at the tail. Vertical white lines in Fig. 1G limit these regions of connectivity, and horizontal white lines separate the three groups of ganglia. It is clear that each ganglion is strongly connected only to one region of the animal, and very weakly connected, or not connected at all (black elements in Fig. 1G), to organs in other regions. This connectivity pattern suggests a simple picture for clustering based on wiring economy and a high interconnectivity between sensory and motor neurons and spatial patches of organs.
Wiring Optimization of Subnetwork of Connections from Sensory and Motor Neurons to Organs Predicts Main Features of Clustering.
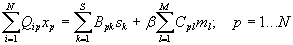
We therefore tested the prediction of cost minimization of wires connecting sensory and motor neurons with sensors and muscles, respectively. The associated cost for this case can be obtained from the total cost in Eq. 1 making α = 0, that is, eliminating from the optimization the costs of neuron-to-neuron wires,
 |
with N̂ = 199 the total number of sensory and motor neurons. Minimization of this cost function for cost exponent ξ = 2 gives explicitly the optimal position for sensory and motor neurons of the form (see SI Text)
 |
Therefore, wiring economy in this case reduces to a simple prediction by which each sensory and motor neuron should be located at the center of mass of the sensors and muscles it connects to. Despite its simplicity, the center of mass formula (Eq. 4) predicts to a very good approximation the neuronal layout of the 199 sensory and motor neurons of C. elegans (mean position error ep = 9.08%, r = 0.923 for β = 1) (Fig. 2A). Also, the density of the neurons along the animal is similar to the actual one, predicting encephalization as seen in the real animal although with brain ganglia shifted to a more anterior position (Fig. 2B). More importantly, the main features of the clustering pattern in ganglia are correctly predicted. The predicted distances between neurons from the same ganglion and between neurons from different ganglia (Fig. 2C, clustering error ec = 6.99%), compare well with the actual clustering pattern of sensory and motor neurons (Fig. 2D).
Fig. 2.

Optimization of neuron-to-organ connections predicts main features of clustering. (A) Optimal positions of sensory and motor neurons, obtained by minimizing the cost of wiring them to organs, versus their actual positions. Colors distinguish different ganglia. (B) Density sensory and motor neurons along the nematode for actual and optimal positions. (C) Average distance between neurons belonging to the same ganglion (diagonal elements) or different ganglia (nondiagonal elements) for optimized sensory and motor neuron positions. (D) Same as C but for the actual nematode. (E) Same as C but optimizing the complete network. (F) Histogram of sizes of the minipatches of skin to which each neuron connects.
The predictions obtained using the center of mass formula in Eq. 4 are extremely robust. Varying the parameters β and the cost power ξ have an effect on average position error of 1% and on clustering error <0.3% because of the fact that sensors and muscles are connected to small skin patches (Fig. 2F; see also SI Text). It is interesting to compare the results of this simple center-of-mass calculation with the predictions for sensory and motor neurons when optimizing the complete network, Eq. 2. The difference between the two calculations is that the complete network one also includes all neuron-to-neuron connections. For the complete network calculation we found that average position error ep and clustering error ec are lowest for α = 0.05 and β = 1.5. However, even for this best case the clustering is worse than that obtained using the simple center-of-mass calculation (Fig. 2E, ec = 7.26%). For other values like α = β = 1/29.3 chosen in reference (24) the clustering error is even higher (SI Fig. 6A, ec = 12.3%). We thus conclude that the net effect of the neuron-to-neuron connections in the optimization worsens the predictions. The rest of the paper is dedicated to prove that predictions can however be improved further by including part of the neuron-to-neuron connections. In this way we will be able to predict neuron positions for more than just the 199 sensory and motor neurons and explain neuroanatomy to finer details.
Optimal Connections Among Sensory and Motor Neurons Improve Predicted Clusters.
We started by adding the connections among sensory neurons, motor neurons and between sensory and motor neurons. The effect of these neuron to neuron connections is obtained from wiring economy of the subnetwork of sensory and motor neurons using the total cost W in Eq. 1 but restricting the sums to sensory and motor neurons. We found an improvement over the center of mass formula in Eq. 4 for neuronal positions, clustering structure and neuron statistics along the animal for a large parameter range, α ≤ 0.1 and β ≥ 0.06. The best results for neuronal positions and clustering structure were found for α = 0.05 and β = 1.5 (in the remaining, we always use these parameter values). Neuronal layout (Fig. 3A, ep = 7.71%, r = 0.93) and clustering in ganglia (Fig. 3 B and C; ec = 5.23%) are closer to actual ones (Fig. 3D).
Fig. 3.

Connections among sensory and motor neurons improve predicted clusters. (A) Optimal positions of sensory and motor neurons, obtained by minimizing their connections to organs and among themselves, versus their actual positions. Colors distinguish different ganglia. (B) Neuron density along the nematode, for actual and optimal positions. (C) Average distance between neurons belonging to the same ganglion (diagonal elements) or different ganglia (nondiagonal elements) for optimized sensory and motor neuron positions. (D) Same as C but for the actual nematode.
Dissection into Optimal and Nonoptimal Subnetworks.
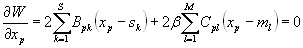
To proceed further, we needed a method to dissect the complete network into optimal and nonoptimal subnetworks in the sense of Eq. 2. The number of subnetworks in a system of N neurons is 2N, an astronomically large number for analysis. Instead, we have used a method of analysis that uses of the order of N calculations. In the following, we illustrate the core of our method using the toy connectivity illustrated in Fig. 4A, with 9 optimal neurons in blue and the 10th neuron in pink in a random position, also connected to sensors or muscles (green circles). Blue and pink links indicate N and M connections, respectively. The first step of the method consists in classifying the neurons by their position error measured for each neuron as the difference between its actual position and its locally optimal position, calculated as the position of its center-of-mass that in general reads as
 |
with xjactual the actual positions of the rest of the neurons (α = β = 1 in toy model). For the example in Fig. 4A, all of the optimally placed neurons have vanishing position errors, except neuron 7 that is connected also to the nonoptimal neuron 10. Although neuron 7 is optimal, its estimated position error depends linearly on the position of neuron 10 with a slope given by M/(M + 4N). As long as the nonoptimal neuron 10 is located sufficiently far from its center-of-mass position and the optimal links outnumber nonoptimal ones, N M, neuron 7 is then correctly classified as having less position error than neuron 10, (Fig. 4B, continuous and dashed blue line). The second step of the method consists in performing a full optimization using Eq. 2 with the complete network first and then further optimization calculations eliminating one by one the neurons in order of decreasing position error as determined by step 1, and for each of these subnetworks we calculate the average position error ep. In our example this procedure corresponds to an optimization calculation with all neurons first, then we eliminate neuron 10, followed by neuron 7 and then any of the rest, and calculate for each case the average position error, Fig. 4C. The lowest average position error is found for neurons 1–9, that is, the method finds the optimal subnetwork. Two lessons can be extracted from this simple example. First, this simple method works better the lower the number of nonoptimal links. Second, it is clear that step 1 can be improved by using an iterative classification. Once neuron 10 is classified as the worst one, the remaining 9 are reclassified. From these 9 neurons the worst neuron is selected and put as second worse in the list. This reclassification process is continued until the last neuron. In this way optimal neurons linked to nonoptimal ones, like neuron 7, are not necessary classified as worse than the rest by the dissection method. In the rest of the paper we use this iterative step 1 unless stated otherwise.
Fig. 4.

Method to dissect networks into optimal and nonoptimal subnetworks. (A) Toy network configuration. Neurons 1–9 (blue) are optimal, and neuron 10 (pink) is located at random. Blue and pink links represent N and M connections each, respectively. (B) Position error for nonoptimal neuron 10 (red) and optimal neuron 7 (blue) as a function of the position of the nonoptimal neuron 10 (rest of neurons have vanishing error). Step 1 in the dissection method classifies neurons by their position error: neuron 10 is classified as the worst one when the red line is above the blue line (N > M and neuron 10 located sufficiently far from its center-of-mass position), then neuron 7, and then the rest. (C) Step 2 in the dissection method calculates the average position error ep in networks of decreasing size (from right to left) eliminating worst located neurons in the order determined in step 1 of the method. Minimum of the error located at size 9. (D) Same as C but for a network configuration with the C. elegans connectivity and with optimal and nonoptimal subnetworks (blue) and for a noisy network with neurons located at positions obtained adding to optimal positions noise following a uniform distribution of std = 8% (red). Plus signs indicate the point separating optimal and nonoptimal subnetworks. (E) Estimated size of the nonoptimal subnetwork (blue) and percentage of correctly estimated nonoptimal neurons (green). (F) Dissection method does not find a separation between optimal and nonoptimal components in noisy networks built without optimal and nonoptimal components.
We then applied the dissection method to artificial network configurations with the same connectivity as the C. elegans network to test its efficacy in separating optimal and nonoptimal subnetworks. We built network configurations with a given percentage of randomly selected nonoptimal neurons with positions taken from a uniform distribution of width given by the length of the animal. The rest of the neurons are optimal, that is, obtained from an optimization calculation including only these neurons. We applied to these network configurations the iterative step 1 to classify the neurons by position error and step 2 to calculate the average position error ep in subnetworks of decreasing size by gradually eliminating the worst neurons in the list of step 1 (Fig. 4D, blue curve). The average position error ep goes down to a value very close to zero (as seen from right to left) at a network size that separates the optimal and nonoptimal subnetworks. The dissection method was found to have an excellent performance in the estimation of the size of the nonoptimal network for nonoptimal subnetworks up to a size of 50% and deteriorates only slightly for larger nonoptimal networks (Fig. 4E, blue). The percentage of neurons correctly classified as nonoptimal (truly nonoptimal neurons in the estimated nonoptimal subnetwork) is also excellent with little misclassification until a size of 50% of the total network and a slight deterioration for increasing size (Fig. 4E, green). Similar results are found for neurons in nonoptimal networks located randomly following a Gaussian instead of a uniform distribution (SI Fig. 7B). Crucial for the success of the method is the iterative step 1, without which the deterioration of the estimation already starts at a size of nonoptimal subnetwork of 25% (SI Fig. 8B).
Networks formed by a near-optimal subnetwork with a given low noise added to optimal positions and a nonoptimal subnetwork with larger noise are also dissected to a good approximation when the nonoptimal subnetwork has a size <50% of the total network (SI Fig. 9B). The distinct feature of the average position error ep in step 2 for this case is not a minimum but an abrupt change in the slope when reducing the size of the network. This point of abrupt slope change separates well the optimal from the nonoptimal subnetworks (SI Fig. 9A). We have implemented a robust numerical algorithm to find this separation point automatically (SI Text). Noisy networks, that is, networks in which neurons are randomly displaced from its optimal location but do not have optimal and nonoptimal subnetworks, also have lower average position error ep when eliminating the worst located neurons. Interestingly, however, these noisy networks never show, whatever the noise level, a special point that could be used to separate optimal from nonoptimal subnetworks like a minimum or a change in slope (Fig. 4D, red line for uniform noise and SI Fig. 9A, red line for Gaussian noise). As a consequence, our algorithm classifies noisy networks either as fully optimal when the noise is very low or as fully nonoptimal for higher noise (Fig. 4F for uniform noise and SI Fig. 9C for Gaussian noise).
Dissection of the actual C. elegans network results in a nonoptimal subnetwork of 12% of neurons (34 of 279) with 20 interneurons, 8 sensory neurons and 6 motor neurons. The average position error ep is lowered from 8.8% for the complete network to 5.4% for the near-optimal subnetwork (Fig. 5A, see SI Table 1 for a list of the nonoptimal neurons). More importantly, the clustering error ec is lowered very significantly from 14% to 2.1% (Fig. 5B) so the clustering diagram of the optimal subnetwork (Fig. 5B, Large Inset) is now very similar to the experimental one down to fine details like the clustering in ganglia within the brain (Fig. 1D). Encephalization, for example, is explained by using wiring economy for the optimal subnetwork (SI Fig. 10). By using the optimal subnetwork and a simple model for synapse location at the middle point between somas, predicted location of synapses is found to be consistent with the actual nerve ring (SI Fig. 11). Note that the error of the near-optimal subnetwork in C. elegans does not go to zero, consistent with a network in which both the near-optimal and nonoptimal subnetworks have noise of different variances (SI Fig. 9D).
Fig. 5.

Dissection of the actual C. elegans configuration into near-optimal and nonoptimal subnetworks. (A) Average position error ep in networks of decreasing size (from right to left) eliminating worst located neurons in the order determined in step 1 of the method. Separation of optimal and nonoptimal subnetworks was found automatically at the point with a plus sign corresponding to a large slope change. Insets: Predicted versus actual position for the near-optimal subnetwork and for the complete network. (B) Same as A but for the clustering error. (Insets) Clustering diagram for near-optimal subnetwork (compare with actual one in Fig. 1D) and for total network.
Wiring economy applied to the near-optimal subnetwork in C. elegans accounts for the clustering of neurons into ganglia as shown by the low clustering error of ec = 2.1%. The origin of this low value is 2-fold. First, the dissection method has eliminated badly located nonoptimal neurons thus reducing average position error. Second, in the optimization of the complete network, the nonoptimal subnetwork is not passive but has a negative effect on the near-optimal subnetwork. The clustering error of the near-optimal subnetwork in the complete network optimization is found to be 3% higher than alone. To further understand this effect, we have searched for the nonoptimal neurons responsible for increased position errors in the near-optimal neurons when both are forming the complete network. We removed one neuron at a time and calculated the change in position error in each of the near-optimal neurons (SI Fig. 12A). Neuron labels in the figure are located such that most damaging nonoptimal neurons are at the bottom and most affected near-optimal neurons to the left. The most damaging nonoptimal neurons are the interneurons AVA, DVA, PVC and AKL. The near-optimal neurons most affected by these nonoptimal neurons are PHC and PHB, but many more are affected and this effect is in part responsible for the low clustering error when eliminating the nonoptimal subnetwork. Nonoptimal neurons also affect the position error of other nonoptimal neurons, but the effects are smaller than on near-optimal neurons and in this case there is no clear core of most affecting neurons (SI Fig. 12B). Only DVA appears again as one of the more damaging neurons.
Discussion
The C. elegans nervous system was found to contain a subnetwork of 84% of neurons wired almost optimally. This subnetwork explains the origin of the structure of the whole system, in particular the segregation of neurons into ganglia and encephalization. A small subset of the connections of this large near-optimal subnetwork formed by the links of sensory and motor neurons to sensors and muscles is responsible for the main features of the neuroanatomy. Connections among neurons are responsible for further neuroanatomical detail, like the formation of ganglia within the head ganglia and the location of this head ganglia within the body. An analysis of nonoptimal neurons revealed that interneurons AVA, DVA, PVC, and AKL have a negative effect on the position of near-optimal neurons in a complete network optimization. This result is consistent with the idea that these interneurons might be spatially constrained in the actual nematode. Interestingly, DVA is a stretch receptor neuron expressing TRP-4, the elegans homologue of the mechanosensitive TPRN channel (36). AVA and PVC express UNC-8, a DEG/EnaC family member homologue to subunits of a mechanically gated ion channel (37). Internal body sensors like those implicated in propioception could be added to the theory in a form identical to external sensors when experimental data becomes available.
Materials and Methods
Data.
Network connectivity and actual positions of somas, sensors, and muscles were taken from the revised data published in ref. 24, available at www.wormatlas.org.
Construction of Interganglia Distance Graphs.
Interganglia distance graphs, or clustering graphs, as those in Fig. 1 D and E, were built in the following way. Neurons were grouped by the ganglion they belong to in the real nematode. Then, distances between every neuron of ganglion i and every neuron of ganglion j are computed (or, if i = j, between every two neurons of the same ganglion). The average of these distances is the i,j-th element of the interganglia distance graph. Note that these matrices are symmetrical by construction.
Construction of Interganglia Connectivity Graphs.
Square (i,j) of Fig. 1F represents the number of connections per neuron between ganglia i and j. It was computed by dividing the total number of connections between ganglia i and j by the sum of the number of neurons of the two ganglia. When i = j, it is computed as the total number of connections between neurons of the same ganglion divided by the number of neurons that form the ganglion. For Fig. 1G, the length of the nematode was divided into 10 bins of equal length. Square (i,j) of this figure represents the number of connections between ganglion i and the organs that fall into the j-th bin, divided by the number of neurons in ganglion i.
Supplementary Material
Acknowledgments
We thank Brian Burton, Vicente Pérez-Díaz, and Adela Escudero-Berián for critical comments on the manuscript. This work was supported by the Spanish Ministry of Science and Education (MEC) (G.G.d.P.) and Comunidad de Madrid (Biociencia program) (G.G.d.P.). A.P.-E. acknowledges fellowships from Consejo Superior de Investigaciones Cientificas, MEC, and Instituto de Salud Carlos III.
Footnotes
The authors declare no conflict of interest.
This article is a PNAS Direct Submission.
This article contains supporting information online at www.pnas.org/cgi/content/full/0703183104/DC1.
References
- 1.Striedter GF. Principles of Brain Evolution. Sunderland, MA: Sinauer; 2004. [Google Scholar]
- 2.Nusbaum MP, Blitz DM, Swensen AM, Wood D, Marder E. Trends Neurosci. 2001;24:146–154. doi: 10.1016/s0166-2236(00)01723-9. [DOI] [PubMed] [Google Scholar]
- 3.Konishi M. In: Elsevier's Encyclopedia of Neuroscience. Adelman G, Smith BH, editors. Amsterdam: Elsevier; 1999. pp. 1906–1908. [Google Scholar]
- 4.Ramón y, Cajal S. Textura del Sistema Nervioso del Hombre y de los Vertebrados. Madrid: Nicolás Moya; 1899. Spanish. trans Pasik P, Pasik T (1999) Texture of the Nervous System of Man and the Vertebrates (Springer, New York) [Google Scholar]
- 5.Mitchison G. Proc R Soc London B Biol Sci. 1991;245:151–158. doi: 10.1098/rspb.1991.0102. [DOI] [PubMed] [Google Scholar]
- 6.Van Essen DC. Nature. 1997;385:313–318. doi: 10.1038/385313a0. [DOI] [PubMed] [Google Scholar]
- 7.Cowey A. Q J Exp Psychol. 1979;31:1–17. doi: 10.1080/14640747908400703. [DOI] [PubMed] [Google Scholar]
- 8.Nelson ME, Bower JM. Trends Neurosci. 1990;13:403–408. doi: 10.1016/0166-2236(90)90119-u. [DOI] [PubMed] [Google Scholar]
- 9.Chklovskii DB, Koulakov A. Physica A. 2000;284:318–334. [Google Scholar]
- 10.Durbin R, Mitchison G. Nature. 1990;343:644–647. doi: 10.1038/343644a0. [DOI] [PubMed] [Google Scholar]
- 11.Koulakov AA, Chklovskii DB. Neuron. 2001;29:519–527. doi: 10.1016/s0896-6273(01)00223-9. [DOI] [PubMed] [Google Scholar]
- 12.Murre JM, Sturdy DP. Biol Cybern. 1995;73:529–545. doi: 10.1007/BF00199545. [DOI] [PubMed] [Google Scholar]
- 13.Ruppin E, Schwartz EL, Yeshurun Y. Biol Cybern. 1993;70:89–94. doi: 10.1007/BF00202570. [DOI] [PubMed] [Google Scholar]
- 14.Wen Q, Chklovskii DB. PLoS Comput Biol. 2005;1:e78. doi: 10.1371/journal.pcbi.0010078. [DOI] [PMC free article] [PubMed] [Google Scholar]
- 15.Cherniak C. J Neurosci. 1994;18:522–527. doi: 10.1016/0166-2236(95)98373-7. [DOI] [PubMed] [Google Scholar]
- 16.Cherniak C. Trends Neurosci. 1995;14:2418–2427. [Google Scholar]
- 17.Klyachko VA, Stevens CF. Proc Natl Acad Sci USA. 2003;100:7937–7941. doi: 10.1073/pnas.0932745100. [DOI] [PMC free article] [PubMed] [Google Scholar]
- 18.Chklovskii DB. Neural Comput. 2004;16:2067–2078. doi: 10.1162/0899766041732422. [DOI] [PubMed] [Google Scholar]
- 19.Cherniak C, Changizi M, Won Kang D. Phys Rev E. 1999;59:6001–6009. doi: 10.1103/physreve.59.6001. [DOI] [PubMed] [Google Scholar]
- 20.Chklovskii DB. J Neurophysiol. 2000;83:2113–2119. doi: 10.1152/jn.2000.83.4.2113. [DOI] [PubMed] [Google Scholar]
- 21.Chklovskii DB, Stepanyants A. BMC Neuroscience. 2003;4:18. doi: 10.1186/1471-2202-4-18. [DOI] [PMC free article] [PubMed] [Google Scholar]
- 22.Cherniak C. Biol Cybern. 1992;66:503–510. doi: 10.1007/BF00204115. [DOI] [PubMed] [Google Scholar]
- 23.Shefi O, Harel A, Chklovskii DB, Ben-Jacob E, Ayali A. Neurocomputing. 2003;58–60:487–495. [Google Scholar]
- 24.Chen BL, Hall DH, Chklovskii DB. Proc Natl Acad Sci USA. 2006;103:4723–4728. doi: 10.1073/pnas.0506806103. [DOI] [PMC free article] [PubMed] [Google Scholar]
- 25.White JG, Southgate E, Thomson JN, Brenner S. Philos Trans R Soc London Ser B. 1986;314:1–340. doi: 10.1098/rstb.1986.0056. [DOI] [PubMed] [Google Scholar]
- 26.Hall DH, Russell RL. J Neurosci. 1991;11:1–22. doi: 10.1523/JNEUROSCI.11-01-00001.1991. [DOI] [PMC free article] [PubMed] [Google Scholar]
- 27.Hall K. Management Sci. 1970;17:219–229. [Google Scholar]
- 28.Kleinhaus J, Sigl G, Johannes F, Antreich K. IEEE Trans CAD. 1991;10:356–365. [Google Scholar]
- 29.Ahn Y-Y, Jeong H, Kim BJ. Physics A. 2006;367:531–537. [Google Scholar]
- 30.Kaiser M, Hilgetag CC. PLoS Comput Biol. 2006;2:e95. doi: 10.1371/journal.pcbi.0020095. [DOI] [PMC free article] [PubMed] [Google Scholar]
- 31.Rushton WA. J Physiol (London) 1951;115:101–122. doi: 10.1113/jphysiol.1951.sp004655. [DOI] [PMC free article] [PubMed] [Google Scholar]
- 32.Rall W, Burke RE, Holmes WR, Jack JJ, Redman SJ, Segev I. Physiol Rev. 1992;72:5159–5186. doi: 10.1152/physrev.1992.72.suppl_4.S159. [DOI] [PubMed] [Google Scholar]
- 33.Laughlin SB, de Ruyter van Steveninck R, Anderson JC. Nat Neurosci. 1998;1:36–41. doi: 10.1038/236. [DOI] [PubMed] [Google Scholar]
- 34.Attwell D, Laughlin SB. J Cereb Blood Flow Metab. 2001;21:1133–1145. doi: 10.1097/00004647-200110000-00001. [DOI] [PubMed] [Google Scholar]
- 35.Tessier-Lavigne M, Goodman CS. Science. 1996;274:1123–1133. doi: 10.1126/science.274.5290.1123. [DOI] [PubMed] [Google Scholar]
- 36.Li W, Feng Z, Sternberg PW, Xu XZ. Nature. 2006;440:684–687. doi: 10.1038/nature04538. [DOI] [PMC free article] [PubMed] [Google Scholar]
- 37.Tavernarakis N, Shreffler W, Wang S, Driscoll M. Neuron. 1997;18:107–119. doi: 10.1016/s0896-6273(01)80050-7. [DOI] [PubMed] [Google Scholar]
Associated Data
This section collects any data citations, data availability statements, or supplementary materials included in this article.