Abstract
The nosocomial human pathogen Moraxella catarrhalis is one the most important agents of human respiratory tract infections. This species is composed of two distinct lineages, one of only moderate virulence, the so-called serosensitive subpopulation, and a second, the seroresistant one, which is enriched among strains that harbor two major virulence traits: complement resistance and adherence to epithelial cells. Using a suite of population genetics tools, we show that the seroresistant lineage is also characterized by higher homologous recombination and mutation rates at housekeeping genes relative to its less pathogenic counterpart. Thus, sex and virulence have evolved in tandem in M. catarrhalis. Moreover, phylogenetic and Bayesian analyses that take into account recombination between the two clades show that the ancestral group was avirulent, is possibly 70 million years old, and must have infected mammals prior to the evolution of humans, which occurred later. The younger seroresistant isolates went through an important population expansion some 5 million years ago, coincident with the hominid expansion. This rise and spread was possibly coupled with a host shift and the acquisition of virulence genes.
Human pathogens present ongoing challenges to public health. Recently, formerly commensal species have raised serious health concerns because of dramatic changes in their genetic makeup. This is the case for Moraxella catarrhalis, which has recently been reclassified from representing an emerging pathogen to an established nosocomial pathogen (Verduin et al. 2002). M. catarrhalis is a Gram-negative, aerobic diplococcus frequently found as a commensal of the upper respiratory tract (Johnson et al. 1981), but it is increasingly associated with acute otitis media and is associated with infectious exacerbations of chronic obstructive pulmonary disease (Hager et al. 1987; Murphy 1998). It is also the third most commonly isolated pathogen from the lower respiratory tract, after Streptococcus pneumoniae and Haemophilus influenzae. In immunocompromised hosts, M. catarrhalis can also cause pneumonia, endocarditis, septicemia, and meningitis (Catlin 1990; Daoud et al. 1996). Moreover, recent hospital outbreaks of respiratory disease due to M. catarrhalis (Patterson et al. 1988; Richards et al. 1993) have resulted in an expanding literature describing the agents and mechanisms of M. catarrhalis virulence (Helminen et al. 1993; Aebi et al. 1998; Boel et al. 1998).
Sequences of 16S and 23S rRNA, plus fingerprinting of outer membrane protein sequences, revealed that M. catarrhalis is composed of two distinct lineages (Bootsma et al. 2000; Stutzmann Meier et al. 2005) that differ in their potential for virulence; we refer to them here as the seroresistant and serosensitive populations. The seroresistant population is strongly associated with two virulence traits: complement resistance and the ability to adhere to epithelial cells. Adherence is found in 92% of seroresistant isolates and is virtually absent in the serosensitive isolates (Bootsma et al. 2000).
Public health concerns create an urgent need to understand the effects of virulence factors, pathogenicity, and ecological niches on bacterial population structure and demography. Reconstructing the evolution of virulence within a bacterial species requires a global understanding of how that species has evolved. M. catarrhalis provides a tractable system for understanding the forces and processes that have shaped the evolution and origin of increased virulence because it displays a dichotomous pathogenic pattern as well as moderate epidemiological complexity and genetic diversity. However, the population genetic structure and ongoing gene flow between lineages have not been elucidated in M. catarrhalis (and many other bacterial species) until now, partly because phylogenetic tools that are used to analyze the evolution of sequence diversity are not designed to cope with the extensive genomic re-shuffling caused by homologous recombination (Feil et al. 2001).
Multilocus sequence typing (MLST) provides a uniform, expandable typing method that can be used for long-term epidemiology (Maiden 2006). We have developed such an MLST scheme for M. catarrhalis that is based on the sequences of eight housekeeping gene fragments. This scheme is freely available for interrogation and data submission via a public Web site (http://web.mpiib-berlin.mpg.de/mlst). In this study, we analyzed their ancestral relationships and the evolution of virulence by using a suite of population genetic tools on multilocus sequence data from a global sample of strains from symptomatic and asymptomatic infections. The analytical approaches included reconstructing the diversity of ancestral sequences prior to recombination (STRUCTURE) (Falush et al. 2003a), reconstructing tree topologies after removing recombinant sequences (“tree purging”) (Wirth et al. 2006), and unraveling distinct demographic histories in the two main populations with the help of Bayesian coalescence approaches (Pybus and Rambaut 2002). Our results demonstrate that the seroresistant population underwent a rapid population expansion during the last 5 million years (Myr), approximately the same time at which it acquired virulence traits; this population has also undergone extensive recombination. In contrast, the serosensitive population is much older, has undergone less dramatic demographic changes, and possesses a population structure that is more clonal. Thus, the most admixed population is also the most virulent, whereas genetic admixture is rare among strains that lack complement resistance and adherence to epithelial cells, suggesting that sex and virulence are causally related.
Results
Sequence analyses
We assembled a collection of 268 M. catarrhalis of diverse geographic origins, half of which had been isolated from symptomatic patients and the other half from asymptomatic people (Supplemental Table S1). We designed primers to amplify and sequence fragments of eight housekeeping genes that are distributed around the M. catarrhalis genome (Supplemental Table S2) and sequenced these fragments from all strains. Each unique sequence was assigned a distinctive allele number, and each unique combination of alleles was assigned a distinctive sequence type (ST) number. A total of 173 STs were found among the 268 strains (Supplemental Table S1). We did not detect any obvious geographical clustering of individual strains within STs that contained more than one isolate, and we could not identify any other evidence for biogeographic specificity.
The phylogenetic analysis described below assigned 42 strains to a “serosensitive” population and the remaining 222 to a “seroresistant” population. However, four strains differed markedly from the others and may belong to a separate species or subspecies. Three of these strains (all in ST116) were isolated in Ethiopia and the fourth (ST127) in the United States. ST116 and ST127 differ in the alleles at all eight genes except for adk, but sequence alignments of the concatenated sequences showed that they have a common ancestry and are only distantly related to M. catarrhalis (Supplemental Fig. S1). Of the eight gene fragments, only ppa clusters among sequences from M. catarrhalis, intermingled with sequences from serosensitive strains, suggesting at least one historical interspecies homologous recombination. The mean genetic distance (Tamura-Nei) between sequences from this species/subspecies and the M. catarrhalis cluster is 0.140 (±0.009), whereas the genetic distance between the two clades within M. catarrhalis is only 0.044 (±0.003). These data suggest that these four strains are related to M. catarrhalis but sufficiently distinct that they can be used as outgroups (Supplemental Fig. S2) but should not otherwise be included in phylogenetic analyses of diversity within M. catarrhalis. We ignore them in the following descriptions.
Polymorphism and selection
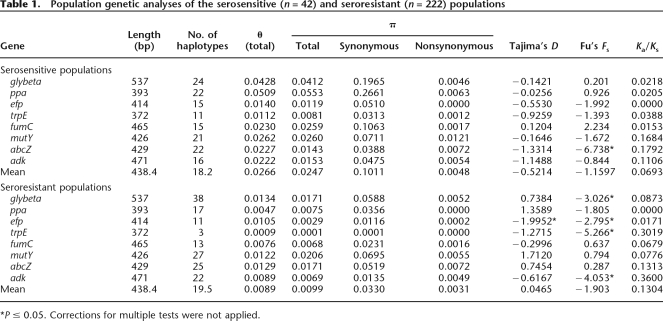
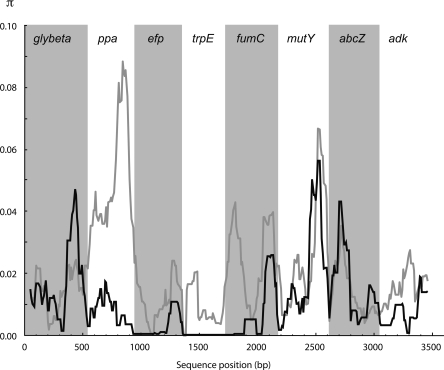
The mean pairwise nucleotide diversity (π) was higher within the serosensitive population than within the seroresistant population (0.025 vs. 0.01; P < 0.01), suggesting that the serosensitive gene pool is older than its seroresistant counterpart (Table 1). Both populations possess a similar number of alleles, although the seroresistant population includes five times as many strains as does the serosensitive population, supporting this inference. The number of alleles found in the seroresistant population varies with the locus (range: 3–38), perhaps reflecting different levels of purifying selection. We investigated this possibility by a sliding-window analysis of the total pairwise nucleotide diversity (Fig. 1), which showed substantial local variation in the degree of divergence in both serosensitive and seroresistant populations, some of which were congruent between both populations.
Table 1.
Population genetic analyses of the serosensitive (n = 42) and seroresistant (n = 222) populations
*P ≤ 0.05. Corrections for multiple tests were not applied.
Figure 1.
Sliding-window analysis of polymorphism for the eight concatenated housekeeping genes. (Light gray) Serosensitive; (black) seroresistant.
MLST relies on the analysis of core genome housekeeping genes under the assumption that they are under purifying selection. The observed peaks in diversity at certain positions in Figure 1 might reflect a relaxation of selective constraints at those positions or might reflect positive selection. Positive selection might significantly affect data interpretation and lead to unreliable phylogenetic reconstructions, but is thought to be rare (Zhang and Li 2005). We therefore tested this possibility with three population genetic tests of selection, Tajima’s D statistic (Tajima 1989), Fu’s Fs statistic (Fu 1997), and the Ka/Ks test. None of the tests produced significant evidence of selection within the serosensitive population, except for a significant Fu test for the abcZ gene (P < 0.05) (Table 1). In contrast, in the seroresistant population, four out of the eight genes displayed significantly negative values of Fu’s Fs. Fu’s Fs statistic is a one-sided test for an excess of rare alleles, a typical signature for population expansion as well as for selection. If the negative values of Fu’s Fs reflected positive selection (or genetic hitchhiking), they should be accompanied by signals in the Ka/Ks ratio and Tajima’s D. However, the Ka/Ks ratio, which measures the ratio of nonsynonymous to synonymous substitution rates, was ≪1.0 for both M. catarrhalis lineages (Table 1), a value that is characteristic of purifying selection. And there was no support for positive selection in Tajima’s D. Thus, we infer that the negative values of Fu’s Fs in the seroresistant population may reflect population expansion.
Phylogenetic analyses
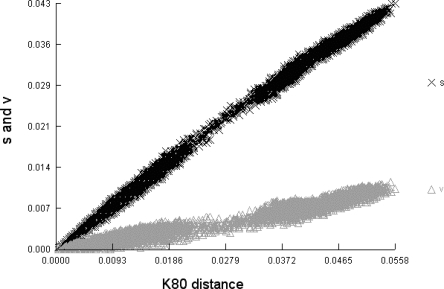
Prior to drawing any phylogenetic inferences, we first inferred the quality of the phylogenetic information contained in the data by plotting transition and tranversion rates as a function of genetic distances (Fig. 2). This graph shows that neither transversions nor transitions are saturated but, rather, both increase linearly with increasing genetic distance. We then measured substitution saturation using the Xia index (Xia et al. 2003) for all three codon positions. The observed Iss.c value of 0.848 was significantly larger than the Iss value of 0.836, thus confirming that there is little saturation at these sites.
Figure 2.
Plots of transitions (black crosses) and transversions (gray triangles) versus genetic distance (Kimura two-parameter model; K80) for eight concatenated sequences. There is no apparent saturation.
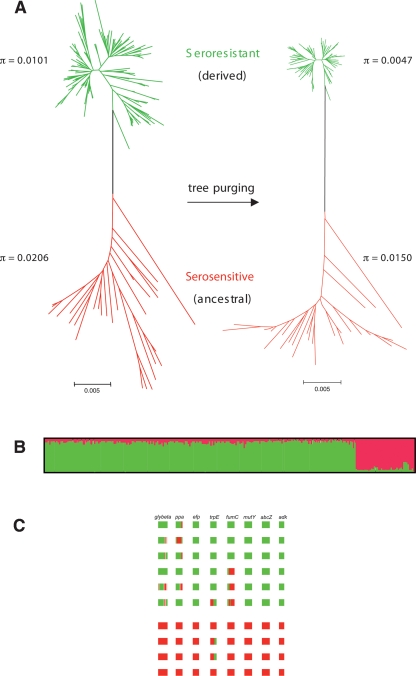
Neighbor-joining, maximum-likelihood, and Bayesian trees were then constructed independently for the concatenated sequences of all eight gene fragments. All three phylogenetic methods produced very similar trees containing two major monophyletic clades (Fig. 3A), which we refer to as populations. The statistical support for these groups is very high, with 100% bootstrap values. The same groupings were obtained when we built phylogenetic trees including the four outlier strains (Supplemental Fig. S2). Rooting the tree with those outliers as an outgroup confirmed that the two main clades are monophyletic and that neither is an immediate ancestor of the other (Supplemental Fig. S3).
Figure 3.
Phylogeny and ancestry of 264 M. catarrhalis isolates. (A) Unpurged (left) and purged (right) neighbor-joining trees of concatenated sequences using Tamura-Nei + G + I models. The bootstrap support for the two colored groups is 100%. Unpurged tree model: G = 0.412, I = 0.828; purged tree model: G = 0.353, I = 0.839. (B) Proportions of ancestry from two ancestral populations as inferred by the linkage model of STRUCTURE. This plot shows one vertical line for each isolate in which the proportions of ancestry from the two sources are color-coded. Only recombinations between the two populations can be detected. (C) Examples of recombination within 10 random strains belonging to the two main populations. Boxes colored as in A indicate sources of ancestry of stretches of nucleotides within each of the eight loci, shown in the order glybeta, ppa, efp, trpE, fumC, mutY, abcZ, and adk. Note that the serosensitive strains (bottom) are genetically rather homogeneous, whereas the seroresistant strains (top) are more admixed.
Figure 3A includes a couple of strains with long branches in the serosensitive grouping. These strains were not significantly different from others in that grouping based on the STRUCTURE analyses and were therefore included in our demogenetic analyses. An alternative possibility that we have not definitively excluded is that these strains represent highly diverse bacteria from rare or undersampled populations such as described for Escherichia coli (Wirth et al. 2006), which would reduce our estimates of age and have an impact on the demographic parameter estimates.
The dichotomy into two clades also corresponded well, albeit not perfectly, with bacterial sensitivity to serum complement-mediated lysis. Twenty-five of 29 (86%) serosensitive strains were assigned to the serosensitive population, whereas 53/54 (98%) seroresistant strains were in the seroresistant population (Supplemental Table S1). Similar patterns were also observed for the three 16S rRNA types: three of four type 2 strains and all three type 3 strains were assigned to the serosensitive population, whereas all seven type 1 strains were in the seroresistant population (χ2 = 10.94, df = 2, P ≤ 0.01).
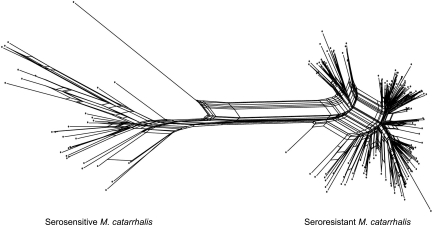
An occasional lack of correspondence between serum resistance or rRNA type with population might reflect recombination. We first tested whether recombination had been frequent by split decomposition. Split decomposition calculates networks of multiple alternative pathways between taxa whenever homoplasy or recombination results in phylogenetic inconsistency. The analysis of the concatenated genes recovered the same phylogenetic clusters as the traditional phylogenetic approaches (Fig. 4). Reticulations are common in the seroresistant population but rarer in the serosensitive population, suggesting that recombination has been more frequent in the former. Interclade recombination may have also occurred because many reticulations were detected between the two populations and near the base of the seroresistant clade. Import of sequences from the serosensitive clade into the seroresistant clade is also supported by the sequence alignment (Supplemental Fig. S1) wherein multiple short stretches of DNA in the seroresistant clade have a serosensitive origin. These short stretches are particularly obvious for the glybeta gene fragments.
Figure 4.
Split decomposition analysis of eight concatenated housekeeping genes.
Population genetics and recombination
Split decomposition is useful for visualizing alternative possible evolutionary relationships between sequences but does not provide details of individual recombination events, nor does it assess their statistical support. We therefore analyzed polymorphisms within the eight gene fragments with STRUCTURE (Pritchard et al. 2000; Falush et al. 2003a), a Bayesian method to identify the ancestral sources of nucleotides within K groups of recombining organisms. The ancestry of each strain can be estimated as the summed probabilities of derivation from each group over all polymorphic nucleotides. STRUCTURE recognized two groups of strains within M. catarrhalis that were largely homogeneous in terms of their ancestral sources of polymorphism. The groups are completely congruent with those from the phylogenetic approaches (Fig. 3B). However, a closer look revealed that numerous strains, particularly those within the seroresistant population, are of mixed ancestry, whereas the serosensitive strains are far more homogeneous (Fig. 3C). Virtually all M. catarrhalis strains possess some transferred nucleotides, but it appears that the seroresistant mosaicism is largely due to homologous recombination with the other group, therefore confirming the observed pattern in the split decomposition analysis.
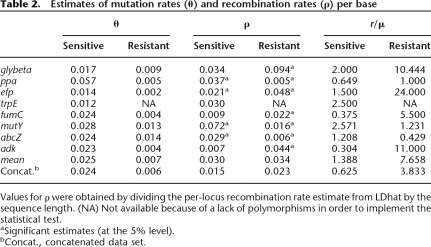
The STRUCTURE approach also does not provide quantitative estimates of the relative frequency of homologous recombination within and between groups. We therefore calculated the composite likelihood of r/μ (McVean et al. 2002), the relative probability that any single nucleotide will be switched because of mutation versus recombination (Table 2). This test confirmed our previous conclusions; the estimates of r/μ are much lower in the serosensitive population (0.625) than in the seroresistant one (3.833). A significant signature for recombination was found in only four out of eight housekeeping genes in the serosensitive population, whereas all eight gene fragments displayed signatures of recombination events in the seroresistant population. Furthermore, the mean r/μ ratios were approximately six times higher in the seroresistant population, showing that mutation is the main driving evolutionary force in the serosensitive population, whereas recombination is more prevalent in the other population (Table 2).
Table 2.
Estimates of mutation rates (θ) and recombination rates (ρ) per base
Values for ρ were obtained by dividing the per-locus recombination rate estimate from LDhat by the sequence length. (NA) Not available because of a lack of polymorphisms in order to implement the statistical test.
aSignificant estimates (at the 5% level).
bConcat., concatenated data set.
Considering these results, we attempted to deduce the true branching order and the true branch lengths by purging recombinant sites. After purging, the two populations remained distinct, but the topology of the neighbor-joining tree changed noticeably (Fig. 3A). The genetic diversity within the serosensitive population remained largely unaffected, whereas the branch lengths shortened dramatically and the estimates of π dropped twofold in the seroresistant population (Fig. 3A). This indicates that the seroresistant population is much younger than the serosensitive population, which would not have been as clear had we not corrected for recombination.
Demographic history
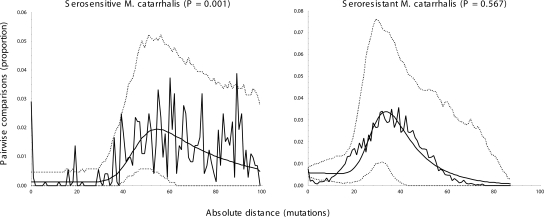
We analyzed the mismatch distributions (frequencies of pairwise differences between haplotypes) in order to evaluate whether recent population growth has occurred in the two populations (Fig. 5). The serosensitive population has an extremely ragged distribution, which is multimodal and does not fit a sudden expansion model according to the Harpending raggedness index (P = 0.001). In contrast, the mismatch distribution in the seroresistant population resembles the bell curves that are characteristic of a recent demographic expansion (Harpending et al. 1998), and the hypothesis of expansion could not be rejected (P = 0.567). Based on a stepwise expansion model, the effective population size of the seroresistant population increased by a factor of 13 (θ0 = 12.799 and θ1 = 168.438) with a τ-value of 28.633 (95% interval confidence 20.047–53.254). Assuming the same mutation rate (μ) as for E. coli (7.6 × 10⁻¹⁰ per nucleotide/yr) (Wirth et al. 2006), the expansion event took place ∼5.3 million years ago (Mya) (τ = 2μt, with a mutation rate that has to be corrected over the total fragment length, i.e., ×3507 bp).
Figure 5.
Mismatch frequency distributions of pairwise differences between concatenated sequences within serosensitive and seroresistant M. catarrhalis populations. The jagged plots correspond to the observed data. The smooth curves correspond to the predictions of a sudden expansion model whose 95% confidence intervals are indicated by dashed lines. P-values represent the probability that the raggedness of the simulated data set is equal to or greater than the observed data set.
This age estimate for the seroresistant population is probably too high because of the importation by recombination of sequence diversity from the serosensitive population, which would artificially increase the genetic diversity of the expanding seroresistant group. Unfortunately, the pruned sequences cannot be evaluated by mismatch analyses, which cannot be applied because of the missing data that result from correcting for recombination.
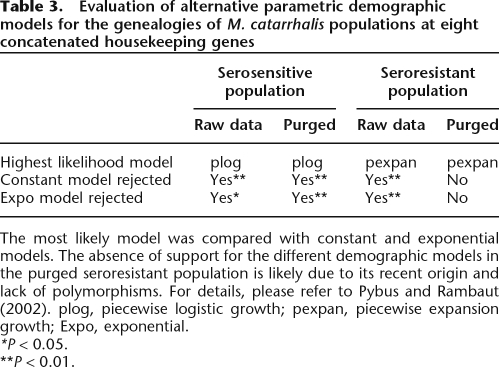
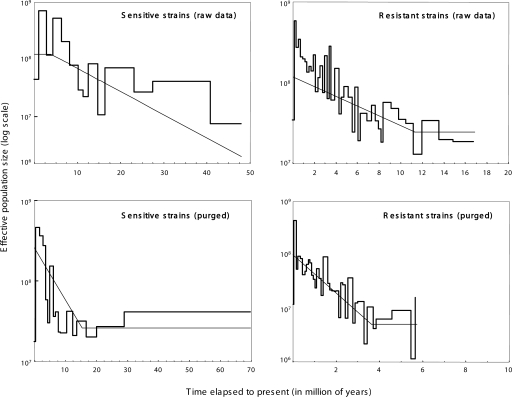
An alternative approach to elucidating changes in the effective population size over time are so-called skyline plots, which are based on coalescent analyses of sequence data. Skyline plots that are parallel to the X-axis indicate a constant population size, and those that rise with time indicate population growth. The pattern of coalescent events for the genealogies of the concatenated housekeeping gene fragments provided further evidence for different evolutionary history of the serosensitive andseroresistant populations. For both populations, the genealogies were most consistent with a history of population growth rather than with constant effective population sizes (Table 3; Fig. 6). However, the processes shaping the demographic histories operated over different time scales. Assuming approximately clock-like evolution and the same mutation rate as E. coli, the age of the most recent common ancestor (MRCA) for the serosensitive population is ∼50 Myr (raw data)–70 Myr (after purging for recombination). This is much older than the age of the MRCA of the seroresistant population, which dates back to 6 Myr (purged)–17 Myr (raw). The importance and the impact of the purging process are clearly illustrated by the generalized skyline approach. Without correction, the age of the seroresistant population would have been overestimated by almost threefold, and the strength of a demographic expansion that began some 4 Mya would have been strongly underestimated. Without correction, the seroresistant population size increased by a factor of 60 (from ∼107 to 6 × 10⁸), whereas after purging, the population expanded >4000-fold from ∼106 to 4 × 10⁹. The situation is exactly the opposite for the serosensitive strains, where the time of the MRCA is slightly underestimated and the growth rate is overestimated (100-fold vs. 20-fold) with unpurged data. The corrected current effective population size of both populations is close to 5 × 10⁸.
Table 3.
Evaluation of alternative parametric demographic models for the genealogies of M. catarrhalis populations at eight concatenated housekeeping genes
The most likely model was compared with constant and exponential models. The absence of support for the different demographic models in the purged seroresistant population is likely due to its recent origin and lack of polymorphisms. For details, please refer to Pybus and Rambaut (2002). plog, piecewise logistic growth; pexpan, piecewise expansion growth; Expo, exponential.
*P < 0.05.
**P < 0.01.
Figure 6.
Estimated demographic histories of the serosensitive and seroresistant M. catarrhalis populations based on the concatenated sequences. The thicker lines are the generalized skyline plots. The approximate timescale assumes a mutation rate (μ) of 7.6 × 10⁻¹⁰. The thinner, smooth curves represent the parametric ML demographic history (see Table 3).
Discussion
Our analyses of the diversity within M. catarrhalis reveal that this bacterial species is composed of two distinct populations. These differ in their association with disease symptoms, and the frequencies of isolates from diseased versus healthy individuals are statistically significant (P ≤ 0.01): 6:36 (0.17) for the serosensitive population versus 113:107 (1.06) for the seroresistant population. The two populations also seem to differ in regard to virulence factors. The expression of two outer membrane proteins (HMW-OMP or uspA2 and copB) has been implicated in seroresistance (Helminen et al. 1993; Aebi et al. 1998; Boel et al. 1998). An additional important pathogenicity trait is the adherence to epithelial cells, thought to be at least partially due to high-molecular-weight surface-exposed proteinaceous structures encoded by uspA1. The ratios of presence/absence of the uspA1 gene were 4:11 strains in the serosensitive population versus 13:15 strains in the seroresistant population (P < 0.05). These virulence genes are also likely to be targets of positive selection. UspA1 and UspA2 proteins are surface-exposed and induce systemic and mucosal immune responses (Stutzmann Meier et al. 2003), and specific IgG responses have been found in children and adults (Chen et al. 1999), reflecting ongoing host–bacteria interactions.
Our genealogical and coalescent-based analyses of multiple chromosomal loci have revealed that the two populations also differ greatly in their demographic histories. The serosensitive population displays much higher genetic diversity, a more moderate signal of expansion, and probably represents remnants of the ancestors of the modern M. catarrhalis that differentiated ∼50 Mya. Note that 50 Myr significantly predates the age of Homo sapiens, implying that the ancestral serosensitive population evolved in a different host, even though modern strains seem to be specific to humans. We do not know what hosts may have been infected by M. catarrhalis in the past, but it is likely that they were mammals because the closest relatives of M. catarrhalis (Moraxella bovis and Moraxella ovis) (Pettersson et al. 1998) infect cows and sheep. The present-day seroresistant population represents the consequences of a differential population expansion occurring over the last 4 Myr, during the Pliocene and Pleistocene and coincident with the rise of hominids. The size expansion of the seroresistant population possibly represents a second host shift, the acquisition of novel virulence genes, and/or strong selection for a particular clone. Our data show clearly that the emergence of M. catarrhalis is so old that it could not have evolved in the last 30–70 yr, the time period associated with the recent increased spread of seroresistant strains in hospitals. We are aware that the mutation rate used in this study is from a different bacterium (E. coli), but the age estimates for the seroresistant strains largely predate the age of antibiotics even with mutation rates that are one or two orders of magnitude greater.
The strong separations and long branch lengths between the two populations in phylogenetic trees (Fig. 3) indicate that they were isolated genetically for long time periods, possibly owing to geographical separation (allopatry) or to specialization for different hosts. More recently, the two lineages have come back into secondary genetic contact, probably through their global colonization of a common niche, the human respiratory tract. This secondary contact has resulted in gene flow between seroresistant and serosensitive strains, whereby diversity within housekeeping genes seems to have been imported into the seroresistant population from the serosensitive pool and uspA1 may have spread in the opposite direction by the selection and survival of particularly successful genotypes that escaped the host immune response.
Homologous recombination and virulence
It has long been recognized that recombination within bacterial species in nature is an important source of the diversity among modern isolates (Maynard Smith et al. 1993; Feil and Spratt 2001). The frequency of recombination is extremely variable, resulting in population structures that range from panmixia in Helicobacter pylori (Falush et al. 2001; Linz et al. 2007) and Neisseria meningitidis (Feil et al. 2001) to absolute clonality in Yesinia pestis (Achtman et al. 2004) and Mycobacterium tuberculosis (Baker et al. 2004). On the basis of preliminary data, Enright and McKenzie (1997) suggested that M. catarrhalis has a nonclonal structure due to extensive recombination. The analyses presented here show that homologous recombination is, indeed, frequent in the seroresistant population but rather rare in the serosensitive population. This striking contrast points to a link between sex, that is, homologous recombination, and virulence as also recently suggested in E. coli (Wirth et al. 2006). The association between the acquisition of novel genes by horizontal genetic exchange (HGT) and virulence is well established (Hacker and Kaper 2000). But are sex and virulence causally linked, or do these observations reflect indirect associations?
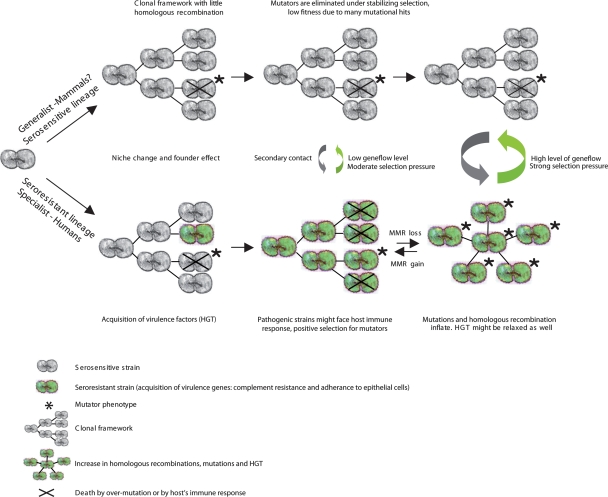
If the evolution of virulence were favored by a reduction of barriers to homologous recombination and HGT, then a single factor might be responsible for the link between sex and virulence. Reduced mismatch repair (MMR) increases both mutation and recombination rates, reducing genetic barriers between distantly related bacteria (Taddei et al. 1997b; Cooper and Lenski 2000; Denamur et al. 2000) and providing a foundation for rapid evolution (Cebula and LeClerc 1997; Sniegowski et al. 2000). Although not yet described in M. catarrhalis, mutator clones have been identified in epidemic serogroup A Neisseria meningitis (Jyssum 1968; Richardson et al. 2002), a species that is closely related to M. catarrhalis. If mutators were frequent in the seroresistant population, this would also affect our dating estimates, resulting in an overestimation of the age of this population. An involvement of MMR-deficient E. coli in the rapid emergence of antibiotic resistance and in the uptake of virulence genes within prokaryotes was first advocated in the mid-1990s (LeClerc et al. 1996). Mutators were recently shown to be frequent among Pseudomomas aeruginosa from the lungs of cystic fibrosis patients (Oliver et al. 2000) and among E. coli from chronic urinary tract infections (Labat et al. 2005). Thus, despite a lack of direct evidence, we speculate that elevated recombination in the seroresistant lineage reflects transient MMR-deficient mutators within this population. An evolutionary scenario for the two M. catarrhalis lineages reflecting this hypothesis is presented in Figure 7. According to the mutator scenario, it might have been expected that the seroresistant grouping in Supplemental Figure S3 would display longer branches, which was not the case. This may simply reflect an overwhelming impact of recombination, which resulted in branch collapse.
Figure 7.
Model of evolutionary mechanisms that link sex and virulence. Virulence determinants are assumed to be introduced initially to a lineage by HGT. We deduce that (at least) two events were needed to convert an ancestral avirulent M. catarrhalis into virulent organisms. Within each population, mutators arise at low frequencies by random mutations. Mutator strains are transient within each population because they are eliminated because of lower fitness (crosses). But virulent strains face selection pressures for more rapid diversification in response to host immune defenses, resulting in higher frequencies of mutators in the seroresistant population. The frequency of transient mutators determines the population structure. At low frequencies, populations are largely asexual (clonal), whereas sex becomes more frequent with increasing mutator frequency. As a result, virulent bacteria are expected to possess patchy sexual structure within a generally asexual framework, while avirulent strains are largely clonal.
Alternatively, the observed patterns could reflect a more prosaic mechanism whereby the evolution to a specialist involved a series of selective sweeps. In selective sweeps, there would be selection against MMR, and the link between sex and virulence would be indirect because of the evolutionary dynamics of the lineage rather than reflecting cause and effect.
Toward a new paradigm
The reduction of barriers to genetic exchange, perhaps by MMR deficiency, might also lead to more frequent import of virulence determinants. More virulent bacteria are more likely to cause invasive disease, with accompanying greater selection pressures due to the host’s immune response, thus causing an “arms race” and increasing rates of evolution of both sex and virulence. This interpretation implies that increased recombination and mutation rates may be long-term features of pathogenic bacterial populations and that they affect the core genome and leave genome-wide signatures, even when they are transient properties of particular strains (Taddei et al. 1997a). Similar analyses could lend further support to the idea that sex and virulence are intimately related in microbes. Most pathogenic bacteria harbor a spectrum of virulence phenotypes, undergo at least limited levels of recombination, and are therefore preeminent candidates for such investigations.
Methods
Bacterial strains
A total of 268 M. catarrhalis strains chosen at random from multiple healthy and diseased humans in diverse geographical areas were investigated in an attempt to study the genetic diversity of this bacterial species from an evolutionary perspective (Supplemental Table S1). A subsample of strains was tested for their sensitivity to complement-mediated lysis in a microtiter bactericidal assay that used 50% pooled human serum (Verduin et al. 1995). Strains were subdivided into three categories: sensitive (S; <3% survival of the bacteria after incubation for 1 h in 50% pooled human serum), resistant (R; >50% survival), and intermediate (I). Presence or absence of the uspA1 gene and assignment of 16S rRNA type are based on the data in Bootsma et al. (2000).
DNA sequencing
Eight gene fragments were amplified and sequenced from all isolates using the primers in Supplemental Table S2. PCR reactions were as follows: denaturation, 1 min at 94°C; annealing, 1 min at 56°C; extension, 1 min at 72°C; 35 cycles. Independent amplicons were used to sequence both strands by an Applied Biosystems Prism 3700 automated sequencer with dRhodamine-labeled terminators (PE Applied Biosystems). The multilocus haplotypes are publicly available (http://web.mpiib-berlin.mpg.de/mlst).
Phylogenetic analyses
Sequences were aligned and trimmed to a uniform size by using SEQLAB and PILEUP (Wisconsin Package 9.1; GCG) and then concatenated. In order to gain an overview of the phylogenetic signal, we plotted pairwise transition and transversion distances against the total genetic distances using the DAMBE software package (Xia and Xie 2001), and we also tested our set of molecular sequences for substitution saturation (Xia et al. 2003). The best-fit model of DNA substitution and the parameter estimates used for tree reconstruction were chosen by performing hierarchical likelihood ratio tests implemented in PAUP* (Swofford 2003) and MODELTEST 1.05 (Posada and Crandall 1998). Phylogenetic trees were estimated for each data set with PAUP* incorporating the best-fit maximum-likelihood model of evolution. Additionally, MrBayes 2.01 (Huelsenbeck and Ronquist 2000) was used to sample phylogenies according to their posterior probabilities using Metropolis-coupled Markov Chain Monte-Carlo methods and to determine clade credibility values across a consensus phylogeny. Split decomposition analyses were performed with SplitsTree, version 4, by using LogDet distances, equal edge lengths, and 1000 bootstrap replicates.
Tree purging
In order to evaluate the impact of homologous recombination on bacteria phylogeny and demography, we used pruned sequences in which recombinant nucleotides were recoded as “N”. The identification of recombinant nucleotides was based on the assignments to ancestral gene pools by the linkage model of STRUCTURE. Up to 30% of the polymorphic nucleotides were removed from the concatenated sequences depending on the strain.
Demographic inferences
To determine whether serosensitive or seroresistant populations underwent recent population expansions, we calculated mismatch distributions and compared these to predicted distributions from models of population expansion (Rogers 1995). For expanding populations, we converted the parameter tau (τ; calculated from the mismatch distribution) to estimate time to the expansion (t) using the equation τ = 2μt, where μ is the neutral mutation rate for the locus. The confidence intervals of τ were calculated using a parametric bootstrap approach (Schneider and Excoffier 1999). Mismatch distributions and τ were calculated in ARLEQUIN 3.0 (Excoffier et al. 2005).
Mismatch analysis cannot account for missing data. We therefore also investigated the historical demography of each M. catarrhalis population by using generalized skyline plots (Strimmer and Pybus 2001), a graphical nonparametric estimate of effective population size, and evaluated alternative parametric demographic models by using GENIE (Version 3.0) (Pybus and Rambaut 2002). The input topology consisted of ML genealogies. The age of the evolutionary events was calculated based on a molecular clock rate of 7.6 × 10⁻¹⁰/yr (Wirth et al. 2006). This clock rate is based on a divergence of 21.3% between the concatenated sequences of E. coli and Salmonella enterica, which diverged around 140 Mya (Ochman and Wilson 1987).
Population genetic analyses
Pairwise nucleotide diversity (π) and the number of segregating sites (Watterson’s θ) were calculated with DnaSP, version 4.10 (Rozas et al. 2003). Three tests for selection were performed: Tajima’s D, Fu’s FS, and the Ka/Ks ratio test.
We used the linkage model in STRUCTURE (Falush et al. 2003a) to identify groups with distinct allele frequencies (Falush et al. 2003b). This procedure assigns a probability of ancestry for each polymorphic nucleotide for a given number of groups, K, and also estimates q, the combined probability of ancestry from each of the K groups for each individual isolate. We chose two groups for this report because repeated analyses (20,000 iterations, following a burn-in period of 10,000 iterations) with K between 1 and 7 showed that the model probability increased dramatically between K = 1 and K = 2 and only slowly at higher values.
Recombination and mutation
The population recombination rate was estimated by a composite-likelihood method with LDhat (McVean et al. 2002). LDhat uses a parametric approach, based on the neutral coalescent, to estimate the scaled parameter 2Ner, where Ne is the effective population size and r is the rate at which recombination events separate adjacent nucleotides. The gene conversion model C was used for the analysis of biallelic sites.
Acknowledgments
We thank Paul Bunje and Géraldine Bollmann for comments on the manuscript and Anthony Campagnari, Frits Mooi, Mario Vaneechoutte, Tone Toenjum, Mark Enright, Xavier Nassif, Sebastien Suerbaum, and Nicole Luke for providing M. catarrhalis isolates. This work was supported by SmithKline Beecham, a Deutsche Forschungsgemeinschaft Grant (WI 2710/1) to T.W., and the University of Konstanz.
Footnotes
[Supplemental material is available online at www.genome.org. The multilocus haplotypes are publicly available at http://web.mpiib-berlin.mpg.de/mlst.]
Article published online before print. Article and publication date are at http://www.genome.org/cgi/doi/10.1101/gr.6122607
References
- Achtman M., Morelli G., Zhu P., Wirth T., Diehl I., Kusecek B., Vogler A.J., Wagner D.M., Allender C.J., Easterday W.R., Morelli G., Zhu P., Wirth T., Diehl I., Kusecek B., Vogler A.J., Wagner D.M., Allender C.J., Easterday W.R., Zhu P., Wirth T., Diehl I., Kusecek B., Vogler A.J., Wagner D.M., Allender C.J., Easterday W.R., Wirth T., Diehl I., Kusecek B., Vogler A.J., Wagner D.M., Allender C.J., Easterday W.R., Diehl I., Kusecek B., Vogler A.J., Wagner D.M., Allender C.J., Easterday W.R., Kusecek B., Vogler A.J., Wagner D.M., Allender C.J., Easterday W.R., Vogler A.J., Wagner D.M., Allender C.J., Easterday W.R., Wagner D.M., Allender C.J., Easterday W.R., Allender C.J., Easterday W.R., Easterday W.R., et al. Microevolution and history of the plague bacillus, Yersinia pestis. Proc. Natl. Acad. Sci. 2004;101:17837–17842. doi: 10.1073/pnas.0408026101. [DOI] [PMC free article] [PubMed] [Google Scholar]
- Aebi C., Lafontaine E.R., Cope L.D., Latimer J.L., Lumbley S.L., McCracken G.H., Hansen E.J., Lafontaine E.R., Cope L.D., Latimer J.L., Lumbley S.L., McCracken G.H., Hansen E.J., Cope L.D., Latimer J.L., Lumbley S.L., McCracken G.H., Hansen E.J., Latimer J.L., Lumbley S.L., McCracken G.H., Hansen E.J., Lumbley S.L., McCracken G.H., Hansen E.J., McCracken G.H., Hansen E.J., Hansen E.J. Phenotypic effect of isogenic uspA1 and uspA2 mutations on Moraxella catarrhalis 035E. Infect. Immun. 1998;66:3113–3119. doi: 10.1128/iai.66.7.3113-3119.1998. [DOI] [PMC free article] [PubMed] [Google Scholar]
- Baker L., Brown T., Maiden M.C., Drobniewski F., Brown T., Maiden M.C., Drobniewski F., Maiden M.C., Drobniewski F., Drobniewski F. Silent nucleotide polymorphisms and a phylogeny for Mycobacterium tuberculosis. Emerg. Infect. Dis. 2004;10:1568–1577. doi: 10.3201/eid1009.040046. [DOI] [PMC free article] [PubMed] [Google Scholar]
- Boel E., Bootsma H., de Kruif J., Jansze M., Klingman K.L., van Dijk H., Logtenberg T., Bootsma H., de Kruif J., Jansze M., Klingman K.L., van Dijk H., Logtenberg T., de Kruif J., Jansze M., Klingman K.L., van Dijk H., Logtenberg T., Jansze M., Klingman K.L., van Dijk H., Logtenberg T., Klingman K.L., van Dijk H., Logtenberg T., van Dijk H., Logtenberg T., Logtenberg T. Phage antibodies obtained by competitive selection on complement-resistant Moraxella (Branhamella) catarrhalis recognize the high-molecular-weight outer membrane protein. Infect. Immun. 1998;66:83–88. doi: 10.1128/iai.66.1.83-88.1998. [DOI] [PMC free article] [PubMed] [Google Scholar]
- Bootsma H.J., van der Heide H.G., de van Pas S., Schouls L.M., Mooi F.R., van der Heide H.G., de van Pas S., Schouls L.M., Mooi F.R., de van Pas S., Schouls L.M., Mooi F.R., Schouls L.M., Mooi F.R., Mooi F.R. Analysis of Moraxella catarrhalis by DNA typing: Evidence for a distinct subpopulation associated with virulence traits. J. Infect. Dis. 2000;181:1376–1387. doi: 10.1086/315374. [DOI] [PubMed] [Google Scholar]
- Catlin B.W. Branhamella catarrhalis: An organism gaining respect as a pathogen. Clin. Microbiol. Rev. 1990;3:293–320. doi: 10.1128/cmr.3.4.293. [DOI] [PMC free article] [PubMed] [Google Scholar]
- Cebula T.A., LeClerc J.E., LeClerc J.E. Hypermutability and homeologous recombination: Ingredients for rapid evolution. Bull. Inst. Pasteur. 1997;95:97–106. [Google Scholar]
- Chen D., Barniak V., VanDerMeid K.R., McMichael J.C., Barniak V., VanDerMeid K.R., McMichael J.C., VanDerMeid K.R., McMichael J.C., McMichael J.C.1999. . The levels and bactericidal capacity of antibodies directed against the UspA1 and UspA2 outer membrane proteins of Moraxella (Branhamella) catarrhalis in adults and children Infect. Immun. 671310–1316. [DOI] [PMC free article] [PubMed] [Google Scholar]
- Cooper V.S., Lenski R.E., Lenski R.E. The population genetics of ecological specialization in evolving Escherichia coli populations. Nature. 2000;407:736–739. doi: 10.1038/35037572. [DOI] [PubMed] [Google Scholar]
- Daoud A., Abuekteish F., Masaadeh H., Abuekteish F., Masaadeh H., Masaadeh H. Neonatal meningitis due to Moraxella catarrhalis and review of the literature. Ann. Trop. Paediatr. 1996;16:199–201. doi: 10.1080/02724936.1996.11747826. [DOI] [PubMed] [Google Scholar]
- Denamur E., Lecointre G., Darlu P., Tenaillon O., Acquaviva C., Sayada C., Sunjevaric I., Rothstein R., Elion J., Taddei F., Lecointre G., Darlu P., Tenaillon O., Acquaviva C., Sayada C., Sunjevaric I., Rothstein R., Elion J., Taddei F., Darlu P., Tenaillon O., Acquaviva C., Sayada C., Sunjevaric I., Rothstein R., Elion J., Taddei F., Tenaillon O., Acquaviva C., Sayada C., Sunjevaric I., Rothstein R., Elion J., Taddei F., Acquaviva C., Sayada C., Sunjevaric I., Rothstein R., Elion J., Taddei F., Sayada C., Sunjevaric I., Rothstein R., Elion J., Taddei F., Sunjevaric I., Rothstein R., Elion J., Taddei F., Rothstein R., Elion J., Taddei F., Elion J., Taddei F., Taddei F., et al. Evolutionary implications of the frequent horizontal transfer of mismatch repair genes. Cell. 2000;103:711–721. doi: 10.1016/s0092-8674(00)00175-6. [DOI] [PubMed] [Google Scholar]
- Enright M.C., McKenzie H., McKenzie H. Moraxella (Branhamella) catarrhalis clinical and molecular aspects of a rediscovered pathogen. J. Med. Microbiol. 1997;46:360–371. doi: 10.1099/00222615-46-5-360. [DOI] [PubMed] [Google Scholar]
- Excoffier L., Laval G., Schneider S., Laval G., Schneider S., Schneider S. Arlequin ver. 3.0: An integrated software package for population genetics data analysis. Evol. Bioinform. Online. 2005;1:47–50. [PMC free article] [PubMed] [Google Scholar]
- Falush D., Kraft C., Taylor N.S., Correa P., Fox J.G., Achtman M., Suerbaum S., Kraft C., Taylor N.S., Correa P., Fox J.G., Achtman M., Suerbaum S., Taylor N.S., Correa P., Fox J.G., Achtman M., Suerbaum S., Correa P., Fox J.G., Achtman M., Suerbaum S., Fox J.G., Achtman M., Suerbaum S., Achtman M., Suerbaum S., Suerbaum S. Recombination and mutation during long-term gastric colonization by Helicobacter pylori: Estimates of clock rates, recombination size, and minimal age. Proc. Natl. Acad. Sci. 2001;98:15056–15061. doi: 10.1073/pnas.251396098. [DOI] [PMC free article] [PubMed] [Google Scholar]
- Falush D., Stephens M., Pritchard J.K., Stephens M., Pritchard J.K., Pritchard J.K. Inference of population structure using multilocus genotype data: Linked loci and correlated allele frequencies. Genetics. 2003a;164:1567–1587. doi: 10.1093/genetics/164.4.1567. [DOI] [PMC free article] [PubMed] [Google Scholar]
- Falush D., Wirth T., Linz B., Pritchard J.K., Stephens M., Kidd M., Blaser M.J., Graham D.Y., Vacher S., Perez-Perez G.I., Wirth T., Linz B., Pritchard J.K., Stephens M., Kidd M., Blaser M.J., Graham D.Y., Vacher S., Perez-Perez G.I., Linz B., Pritchard J.K., Stephens M., Kidd M., Blaser M.J., Graham D.Y., Vacher S., Perez-Perez G.I., Pritchard J.K., Stephens M., Kidd M., Blaser M.J., Graham D.Y., Vacher S., Perez-Perez G.I., Stephens M., Kidd M., Blaser M.J., Graham D.Y., Vacher S., Perez-Perez G.I., Kidd M., Blaser M.J., Graham D.Y., Vacher S., Perez-Perez G.I., Blaser M.J., Graham D.Y., Vacher S., Perez-Perez G.I., Graham D.Y., Vacher S., Perez-Perez G.I., Vacher S., Perez-Perez G.I., Perez-Perez G.I., et al. Traces of human migrations in Helicobacter pylori populations. Science. 2003b;299:1582–1585. doi: 10.1126/science.1080857. [DOI] [PubMed] [Google Scholar]
- Feil E.J., Spratt B.G., Spratt B.G. Recombination and the population structures of bacterial pathogens. Annu. Rev. Microbiol. 2001;55:561–590. doi: 10.1146/annurev.micro.55.1.561. [DOI] [PubMed] [Google Scholar]
- Feil E.J., Holmes E.C., Bessen D.E., Chan M.S., Day N.P., Enright M.C., Goldstein R., Hood D.W., Kalia A., Moore C.E., Holmes E.C., Bessen D.E., Chan M.S., Day N.P., Enright M.C., Goldstein R., Hood D.W., Kalia A., Moore C.E., Bessen D.E., Chan M.S., Day N.P., Enright M.C., Goldstein R., Hood D.W., Kalia A., Moore C.E., Chan M.S., Day N.P., Enright M.C., Goldstein R., Hood D.W., Kalia A., Moore C.E., Day N.P., Enright M.C., Goldstein R., Hood D.W., Kalia A., Moore C.E., Enright M.C., Goldstein R., Hood D.W., Kalia A., Moore C.E., Goldstein R., Hood D.W., Kalia A., Moore C.E., Hood D.W., Kalia A., Moore C.E., Kalia A., Moore C.E., Moore C.E., et al. Recombination within natural populations of pathogenic bacteria: Short-term empirical estimates and long-term phylogenetic consequences. Proc. Natl. Acad. Sci. 2001;98:182–187. doi: 10.1073/pnas.98.1.182. [DOI] [PMC free article] [PubMed] [Google Scholar]
- Fu Y.X. Statistical tests of neutrality of mutations against population growth, hitchhiking and background selection. Genetics. 1997;147:915–925. doi: 10.1093/genetics/147.2.915. [DOI] [PMC free article] [PubMed] [Google Scholar]
- Hacker J., Kaper J.B., Kaper J.B. Pathogenicity islands and the evolution of microbes. Annu. Rev. Microbiol. 2000;54:641–679. doi: 10.1146/annurev.micro.54.1.641. [DOI] [PubMed] [Google Scholar]
- Hager H., Verghese A., Alvarez S., Berk S.L., Verghese A., Alvarez S., Berk S.L., Alvarez S., Berk S.L., Berk S.L. Branhamella catarrhalis respiratory infections. Rev. Infect. Dis. 1987;9:1140–1149. doi: 10.1093/clinids/9.6.1140. [DOI] [PubMed] [Google Scholar]
- Harpending H.C., Batzer M.A., Gurven M., Jorde L.B., Rogers A.R., Sherry S.T., Batzer M.A., Gurven M., Jorde L.B., Rogers A.R., Sherry S.T., Gurven M., Jorde L.B., Rogers A.R., Sherry S.T., Jorde L.B., Rogers A.R., Sherry S.T., Rogers A.R., Sherry S.T., Sherry S.T. Genetic traces of ancient demography. Proc. Natl. Acad. Sci. 1998;95:1961–1967. doi: 10.1073/pnas.95.4.1961. [DOI] [PMC free article] [PubMed] [Google Scholar]
- Helminen M.E., Maciver I., Paris M., Latimer J.L., Lumbley S.L., Cope L.D., McCracken G.H., Hansen E.J., Maciver I., Paris M., Latimer J.L., Lumbley S.L., Cope L.D., McCracken G.H., Hansen E.J., Paris M., Latimer J.L., Lumbley S.L., Cope L.D., McCracken G.H., Hansen E.J., Latimer J.L., Lumbley S.L., Cope L.D., McCracken G.H., Hansen E.J., Lumbley S.L., Cope L.D., McCracken G.H., Hansen E.J., Cope L.D., McCracken G.H., Hansen E.J., McCracken G.H., Hansen E.J., Hansen E.J. A mutation affecting expression of a major outer membrane protein of Moraxella catarrhalis alters serum resistance and survival in vivo. J. Infect. Dis. 1993;168:1194–1201. doi: 10.1093/infdis/168.5.1194. [DOI] [PubMed] [Google Scholar]
- Huelsenbeck J.P., Ronquist F., Ronquist F. MrBayes: Bayesian inferences of phylogeny. Bioinformatics. 2000;17:754–755. doi: 10.1093/bioinformatics/17.8.754. [DOI] [PubMed] [Google Scholar]
- Johnson M.A., Drew W.L., Roberts M., Drew W.L., Roberts M., Roberts M. Branhamella (Neisseria) catarrhalis a lower respiratory tract pathogen? J. Clin. Microbiol. 1981;13:1066–1069. doi: 10.1128/jcm.13.6.1066-1069.1981. [DOI] [PMC free article] [PubMed] [Google Scholar]
- Jyssum K. Mutator factor in Neisseria meningitidis associated with increased sensitivity to ultraviolet light and defective transformation. J. Bacteriol. 1968;96:165–172. doi: 10.1128/jb.96.1.165-172.1968. [DOI] [PMC free article] [PubMed] [Google Scholar]
- Labat F., Pradillon O., Garry L., Peuchmaur M., Fantin B., Denamur E., Pradillon O., Garry L., Peuchmaur M., Fantin B., Denamur E., Garry L., Peuchmaur M., Fantin B., Denamur E., Peuchmaur M., Fantin B., Denamur E., Fantin B., Denamur E., Denamur E. Mutator phenotype confers advantage in Escherichia coli chronic urinary tract infection pathogenesis. FEMS Immunol. Med. Microbiol. 2005;44:317–321. doi: 10.1016/j.femsim.2005.01.003. [DOI] [PubMed] [Google Scholar]
- LeClerc J.E., Li B., Payne W.L., Cebula T.A., Li B., Payne W.L., Cebula T.A., Payne W.L., Cebula T.A., Cebula T.A. High mutation frequencies among Escherichia coli and Salmonella pathogens. Science. 1996;274:1208–1211. doi: 10.1126/science.274.5290.1208. [DOI] [PubMed] [Google Scholar]
- Linz B., Balloux F., Moodley Y., Manica A., Liu H., Roumagnac P., Falush D., Stamer C., Prugnolle F., van der Merwe S.W., Balloux F., Moodley Y., Manica A., Liu H., Roumagnac P., Falush D., Stamer C., Prugnolle F., van der Merwe S.W., Moodley Y., Manica A., Liu H., Roumagnac P., Falush D., Stamer C., Prugnolle F., van der Merwe S.W., Manica A., Liu H., Roumagnac P., Falush D., Stamer C., Prugnolle F., van der Merwe S.W., Liu H., Roumagnac P., Falush D., Stamer C., Prugnolle F., van der Merwe S.W., Roumagnac P., Falush D., Stamer C., Prugnolle F., van der Merwe S.W., Falush D., Stamer C., Prugnolle F., van der Merwe S.W., Stamer C., Prugnolle F., van der Merwe S.W., Prugnolle F., van der Merwe S.W., van der Merwe S.W., et al. An African origin for the intimate association between humans and Helicobacter pylori. Nature. 2007;445:915–918. doi: 10.1038/nature05562. [DOI] [PMC free article] [PubMed] [Google Scholar]
- Maiden M.C. Multilocus sequence typing of bacteria. Annu. Rev. Microbiol. 2006;60:561–588. doi: 10.1146/annurev.micro.59.030804.121325. [DOI] [PubMed] [Google Scholar]
- Maynard Smith J., Smith N.H., O’Rourke M., Spratt B.G., Smith N.H., O’Rourke M., Spratt B.G., O’Rourke M., Spratt B.G., Spratt B.G. How clonal are bacteria? Proc. Natl. Acad. Sci. 1993;90:4384–4388. doi: 10.1073/pnas.90.10.4384. [DOI] [PMC free article] [PubMed] [Google Scholar]
- McVean G., Awadalla P., Fearnhead P., Awadalla P., Fearnhead P., Fearnhead P. A coalescent-based method for detecting and estimating recombination from gene sequences. Genetics. 2002;160:1231–1241. doi: 10.1093/genetics/160.3.1231. [DOI] [PMC free article] [PubMed] [Google Scholar]
- Murphy T.F. Lung infections. 2. Branhamella catarrhalis: Epidemiological and clinical aspects of a human respiratory tract pathogen. Thorax. 1998;53:124–128. doi: 10.1136/thx.53.2.124. [DOI] [PMC free article] [PubMed] [Google Scholar]
- Ochman H., Wilson A.C., Wilson A.C. Evolution in bacteria: Evidence for a universal substitution rate in cellular genomes. J. Mol. Evol. 1987;26:74–86. doi: 10.1007/BF02111283. [DOI] [PubMed] [Google Scholar]
- Oliver A., Canton R., Campo P., Baquero F., Blazquez J., Canton R., Campo P., Baquero F., Blazquez J., Campo P., Baquero F., Blazquez J., Baquero F., Blazquez J., Blazquez J. High frequency of hypermutable Pseudomonas aeruginosa in cystic fibrosis lung infection. Science. 2000;288:1251–1254. doi: 10.1126/science.288.5469.1251. [DOI] [PubMed] [Google Scholar]
- Patterson T.F., Patterson J.E., Masecar B.L., Barden G.E., Hierholzer W.J., Zervos M.J., Patterson J.E., Masecar B.L., Barden G.E., Hierholzer W.J., Zervos M.J., Masecar B.L., Barden G.E., Hierholzer W.J., Zervos M.J., Barden G.E., Hierholzer W.J., Zervos M.J., Hierholzer W.J., Zervos M.J., Zervos M.J. A nosocomial outbreak of Branhamella catarrhalis confirmed by restriction endonuclease analysis. J. Infect. Dis. 1988;157:996–1001. doi: 10.1093/infdis/157.5.996. [DOI] [PubMed] [Google Scholar]
- Pettersson B., Kodjo A., Ronaghi M., Uhlen M., Tonjum T., Kodjo A., Ronaghi M., Uhlen M., Tonjum T., Ronaghi M., Uhlen M., Tonjum T., Uhlen M., Tonjum T., Tonjum T. Phylogeny of the family Moraxellaceae by 16S rDNA sequence analysis, with special emphasis on differentiation of Moraxella species. Int. J. Syst. Bacteriol. 1998;48:75–89. doi: 10.1099/00207713-48-1-75. [DOI] [PubMed] [Google Scholar]
- Posada D., Crandall K.A., Crandall K.A. MODELTEST: Testing the model of DNA substitution. Bioinformatics. 1998;14:817–818. doi: 10.1093/bioinformatics/14.9.817. [DOI] [PubMed] [Google Scholar]
- Pritchard J.K., Stephens M., Donnelly P., Stephens M., Donnelly P., Donnelly P. Inference of population structure using multilocus genotype data. Genetics. 2000;155:945–959. doi: 10.1093/genetics/155.2.945. [DOI] [PMC free article] [PubMed] [Google Scholar]
- Pybus O.G., Rambaut A., Rambaut A. GENIE: Estimating demographic history from molecular phylogenies. Bioinformatics. 2002;18:1404–1405. doi: 10.1093/bioinformatics/18.10.1404. [DOI] [PubMed] [Google Scholar]
- Richards S.J., Greening A.P., Enright M.C., Morgan M.G., McKenzie H., Greening A.P., Enright M.C., Morgan M.G., McKenzie H., Enright M.C., Morgan M.G., McKenzie H., Morgan M.G., McKenzie H., McKenzie H. Outbreak of Moraxella catarrhalis in a respiratory unit. Thorax. 1993;48:91–92. doi: 10.1136/thx.48.1.91. [DOI] [PMC free article] [PubMed] [Google Scholar]
- Richardson A.R., Yu Z., Popovic T., Stojiljkovic I., Yu Z., Popovic T., Stojiljkovic I., Popovic T., Stojiljkovic I., Stojiljkovic I. Mutator clones of Neisseria meningitidis in epidemic serogroup A disease. Proc. Natl. Acad. Sci. 2002;99:6103–6107. doi: 10.1073/pnas.092568699. [DOI] [PMC free article] [PubMed] [Google Scholar]
- Rogers A.R. Genetic evidence for a Pleistocene population explosion. Evolution Int. J. Org. Evolution. 1995;49:608–615. doi: 10.1111/j.1558-5646.1995.tb02297.x. [DOI] [PubMed] [Google Scholar]
- Rozas J., Sanchez-DelBarrio J.C., Messeguer X., Rozas R., Sanchez-DelBarrio J.C., Messeguer X., Rozas R., Messeguer X., Rozas R., Rozas R. DnaSP, DNA polymorphism analyses by the coalescent and other methods. Bioinformatics. 2003;19:2496–2497. doi: 10.1093/bioinformatics/btg359. [DOI] [PubMed] [Google Scholar]
- Schneider S., Excoffier L., Excoffier L. Estimation of past demographic parameters from the distribution of pairwise differences when the mutation rates vary among sites: Application to human mitochondrial DNA. Genetics. 1999;152:1079–1089. doi: 10.1093/genetics/152.3.1079. [DOI] [PMC free article] [PubMed] [Google Scholar]
- Sniegowski P.D., Gerrish P.J., Johnson T., Shaver A., Gerrish P.J., Johnson T., Shaver A., Johnson T., Shaver A., Shaver A. The evolution of mutation rates: Separating causes from consequences. BioEssays. 2000;22:1057–1066. doi: 10.1002/1521-1878(200012)22:12<1057::AID-BIES3>3.0.CO;2-W. [DOI] [PubMed] [Google Scholar]
- Strimmer K., Pybus O.G., Pybus O.G. Exploring the demographic history of DNA sequences using the generalized skyline plot. Mol. Biol. Evol. 2001;18:2298–2305. doi: 10.1093/oxfordjournals.molbev.a003776. [DOI] [PubMed] [Google Scholar]
- Stutzmann Meier P., Heiniger N., Troller R., Aebi C., Heiniger N., Troller R., Aebi C., Troller R., Aebi C., Aebi C. Salivary antibodies directed against outer membrane proteins of Moraxella catarrhalis in healthy adults. Infect. Immun. 2003;71:6793–6798. doi: 10.1128/IAI.71.12.6793-6798.2003. [DOI] [PMC free article] [PubMed] [Google Scholar]
- Stutzmann Meier P., Troller R., Heiniger N., Grivea I.N., Syrogiannopoulos G.A., Aebi C., Troller R., Heiniger N., Grivea I.N., Syrogiannopoulos G.A., Aebi C., Heiniger N., Grivea I.N., Syrogiannopoulos G.A., Aebi C., Grivea I.N., Syrogiannopoulos G.A., Aebi C., Syrogiannopoulos G.A., Aebi C., Aebi C. Moraxella catarrhalis strains with reduced expression of the UspA outer membrane protein belong to a distinct subpopulation. Vaccine. 2005;23:2000–2008. doi: 10.1016/j.vaccine.2004.09.036. [DOI] [PubMed] [Google Scholar]
- Swofford D.L. PAUP*—Phylogenetic analyses using parsinomy and other methods, version 4.0. Sinauer; Sunderland, MA: 2003. [Google Scholar]
- Taddei F., Matic I., Godelle B., Radman M., Matic I., Godelle B., Radman M., Godelle B., Radman M., Radman M. To be a mutator, or how pathogenic and commensal bacteria can evolve rapidly. Trends Microbiol. 1997a;5:427–428. doi: 10.1016/S0966-842X(97)01157-8. [DOI] [PubMed] [Google Scholar]
- Taddei F., Radman M., Maynard-Smith J., Toupance B., Gouyon P.H., Godelle B., Radman M., Maynard-Smith J., Toupance B., Gouyon P.H., Godelle B., Maynard-Smith J., Toupance B., Gouyon P.H., Godelle B., Toupance B., Gouyon P.H., Godelle B., Gouyon P.H., Godelle B., Godelle B. Role of mutator alleles in adaptive evolution. Nature. 1997b;387:700–702. doi: 10.1038/42696. [DOI] [PubMed] [Google Scholar]
- Tajima F. Statistical method for testing the neutral mutation hypothesis by DNA polymorphism. Genetics. 1989;123:585–595. doi: 10.1093/genetics/123.3.585. [DOI] [PMC free article] [PubMed] [Google Scholar]
- Verduin C.M., Hol C., Van Dijke E., Faber J.A., Jansze M., Verhoef J., Van Dijk H., Hol C., Van Dijke E., Faber J.A., Jansze M., Verhoef J., Van Dijk H., Van Dijke E., Faber J.A., Jansze M., Verhoef J., Van Dijk H., Faber J.A., Jansze M., Verhoef J., Van Dijk H., Jansze M., Verhoef J., Van Dijk H., Verhoef J., Van Dijk H., Van Dijk H. Assessment of complement-mediated killing of Moraxella (Branhamella) catarrhalis isolates by a simple method. Clin. Diagn. Lab. Immunol. 1995;2:365–368. doi: 10.1128/cdli.2.3.365-368.1995. [DOI] [PMC free article] [PubMed] [Google Scholar]
- Verduin C.M., Hol C., Fleer A., van Dijk H., van Belkum A., Hol C., Fleer A., van Dijk H., van Belkum A., Fleer A., van Dijk H., van Belkum A., van Dijk H., van Belkum A., van Belkum A. Moraxella catarrhalis: From emerging to established pathogen. Clin. Microbiol. Rev. 2002;15:125–144. doi: 10.1128/CMR.15.1.125-144.2002. [DOI] [PMC free article] [PubMed] [Google Scholar]
- Wirth T., Falush D., Lan R., Colles F., Mensa P., Wieler L.H., Karch H., Reeves P.R., Maiden M.C., Ochman H., Falush D., Lan R., Colles F., Mensa P., Wieler L.H., Karch H., Reeves P.R., Maiden M.C., Ochman H., Lan R., Colles F., Mensa P., Wieler L.H., Karch H., Reeves P.R., Maiden M.C., Ochman H., Colles F., Mensa P., Wieler L.H., Karch H., Reeves P.R., Maiden M.C., Ochman H., Mensa P., Wieler L.H., Karch H., Reeves P.R., Maiden M.C., Ochman H., Wieler L.H., Karch H., Reeves P.R., Maiden M.C., Ochman H., Karch H., Reeves P.R., Maiden M.C., Ochman H., Reeves P.R., Maiden M.C., Ochman H., Maiden M.C., Ochman H., Ochman H., et al. Sex and virulence in Escherichia coli: An evolutionary perspective. Mol. Microbiol. 2006;60:1136–1151. doi: 10.1111/j.1365-2958.2006.05172.x. [DOI] [PMC free article] [PubMed] [Google Scholar]
- Xia X., Xie Z., Xie Z. DAMBE: Software package for data analysis in molecular biology and evolution. J. Hered. 2001;92:371–373. doi: 10.1093/jhered/92.4.371. [DOI] [PubMed] [Google Scholar]
- Xia X., Xie Z., Salemi M., Chen L., Wang Y., Xie Z., Salemi M., Chen L., Wang Y., Salemi M., Chen L., Wang Y., Chen L., Wang Y., Wang Y. An index of substitution saturation and its application. Mol. Phylogenet. Evol. 2003;26:1–7. doi: 10.1016/s1055-7903(02)00326-3. [DOI] [PubMed] [Google Scholar]
- Zhang L., Li W.-H., Li W.-H. Human SNPs reveal no evidence of frequent positive selection. Mol. Biol. Evol. 2005;22:2504–2507. doi: 10.1093/molbev/msi240. [DOI] [PubMed] [Google Scholar]


