

Abstract
The role of mitochondria in cell metabolism and survival is controlled by calcium signals that are commonly transmitted at the close associations between mitochondria and endoplasmic reticulum (ER). However, the physical linkage of the ER–mitochondria interface and its relevance for cell function remains elusive. We show by electron tomography that ER and mitochondria are adjoined by tethers that are ∼10 nm at the smooth ER and ∼25 nm at the rough ER. Limited proteolysis separates ER from mitochondria, whereas expression of a short “synthetic linker” (<5 nm) leads to tightening of the associations. Although normal connections are necessary and sufficient for proper propagation of ER-derived calcium signals to the mitochondria, tightened connections, synthetic or naturally observed under apoptosis-inducing conditions, make mitochondria prone to Ca2+ overloading and ensuing permeability transition. These results reveal an unexpected dependence of cell function and survival on the maintenance of proper spacing between the ER and mitochondria.
Introduction
Mitochondria have been recently established as both physiological targets and relay points in intracellular Ca2+ signaling, contributing to a spectrum of cellular events ranging from oxidative ATP generation (Hajnoczky et al., 1995; Robb-Gaspers et al., 1998; Jouaville et al., 1999) to apoptotic cell death (Ferri and Kroemer, 2001; Demaurex and Distelhorst, 2003). This versatile function of mitochondria depends on the generation of mitochondrial matrix [Ca2+] ([Ca2+]m) signals. The [Ca2+]m signal results from activation of the uniporter-mediated Ca2+ uptake that shows a relatively low Ca2+ affinity (Kirichok et al., 2004; Nicholls, 2005). The mitochondrial Ca2+ uptake of the IP3 receptor (IP3R)–mediated Ca2+ release is facilitated locally by the high cytoplasmic [Ca2+] ([Ca2+]c) microdomains around the IP3Rs at focal contact areas between the ER and mitochondria (Rizzuto et al., 1998). Notably, mitochondria exhibit structural and functional diversity (Collins et al., 2002), and subsets of mitochondria may interact locally with other organelles (Hoth et al., 2000; Dolman et al., 2005). The local [Ca2+] control between IP3Rs and mitochondria seems to occur at stable sites between the ER and mitochondria (Filippin et al., 2003) and displays a “quasisynaptic” organization (Csordas et al., 1999). Mitochondria-associated ER membranes are also involved in multiple mechanisms of joint operation between the two organelles, in the synthesis of the mitochondrial cytochrome c oxidase (Parimoo et al., 1982) and phospho- and glycosphingolipids (Voelker, 2005).
The existence of physical links between ER and mitochondria have been suggested based on cosedimentation of ER particles with mitochondria and electron microscopic observations of close associations between mitochondria and ER vesicles (Shore and Tata, 1977; Meier et al., 1981; Mannella et al., 1998). Recently, several mitochondria or ER bound proteins have been shown to be important for maintaining the spatial relationship between ER and mitochondria and, hence, have also been implicated as possible linking elements: DLP-1/DRP1-1 (Pitts et al., 1999; Varadi et al., 2004), tumor autocrine motility factor receptor (Wang et al., 2000), and PACS-2 and BAP31 (Simmen et al., 2005). IP3Rs have also been postulated to interact with the Voltage-dependent anion-selective channel to form an ER–mitochondria Ca2+ tunnel (Rapizzi et al., 2002). Heterogeneity in the distance between the interfacing ER and outer mitochondrial membranes (OMMs; Pacher et al., 2000) also indicates that the contact formation may depend on several factors and raises the intriguing possibility that the ER–mitochondria distance may be controlled to affect ER and mitochondria function. However, despite the attention paid to the structural basis of the ER–mitochondria communication, the fundamental question of whether direct physical linkage between ER and mitochondria is required for the local [Ca2+] coupling remains to be elucidated. Here, we visualize the ER–mitochondria tethers and show that the local Ca2+ coupling can be weakened and strengthened by demolition and enforcement of the interorganellar protein linkage, respectively. Furthermore, our data reveal a novel regulatory role of the ER–mitochondria gap width in Ca2+ signaling and in cell survival.
Results and discussion
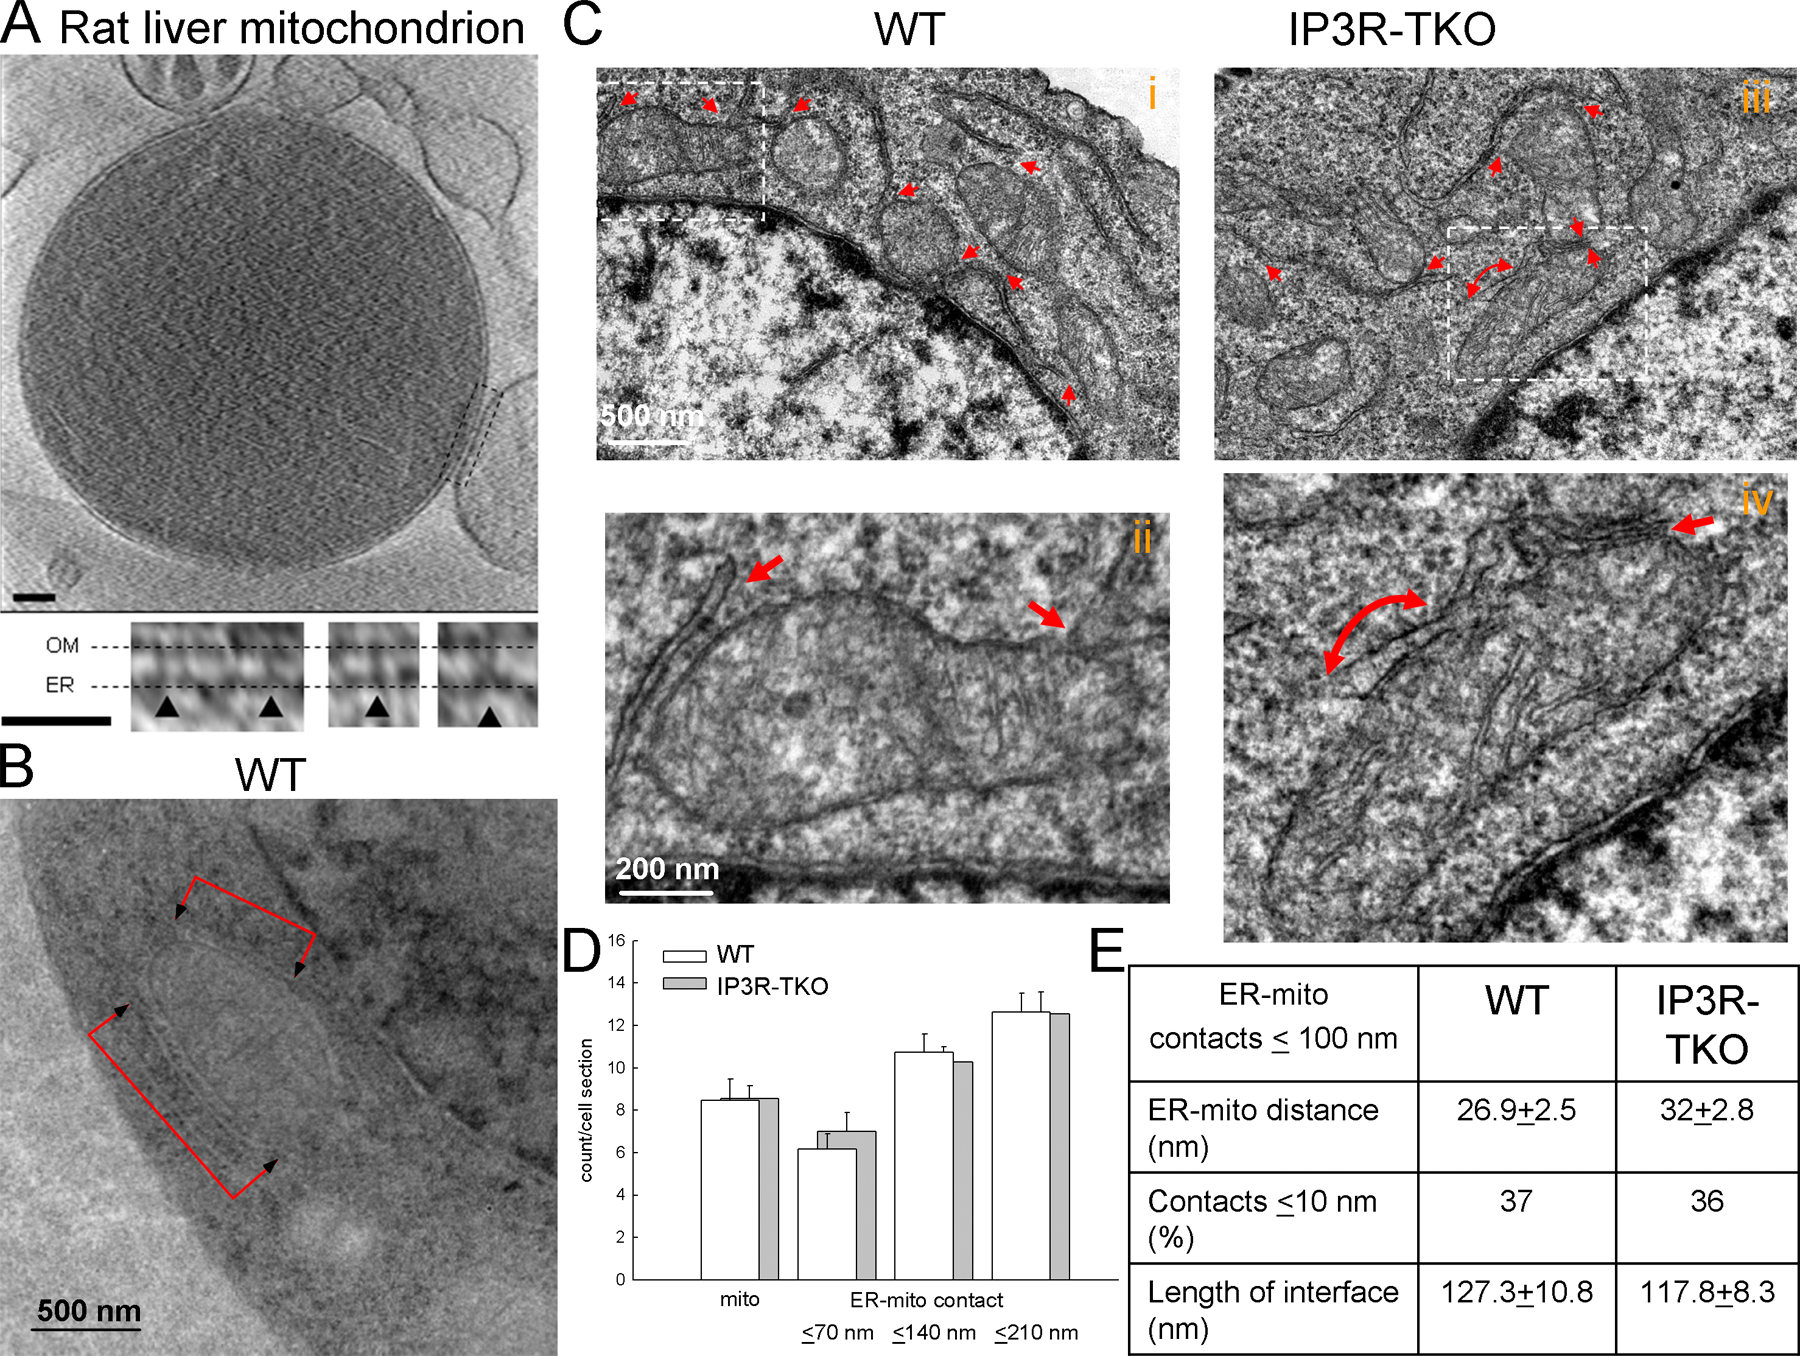
To directly visualize the structures responsible for the physical association of the ER with mitochondria, we used electron tomography (ET), which can reveal fine structural details missed in conventional micrographs because of overlapping densities (Mannella et al., 1994). Tomographic analysis of isolated rat-liver mitochondria (conventionally fixed, plastic-embedded or unfixed, frozen-hydrated) show narrow particles connecting the OMM to putative ER vesicles (Fig. 1 A and Fig. S1 A, available at http://www.jcb.org/cgi/content/full/jcb.200604016/DC1). These “tethers” tend to occur in clusters of six or more, spaced 13–22 nm apart, spanning intermembrane distances of 6–15 nm with indications of increments occurring in 5-nm steps (Table S1). Electron micrographs and tomograms of plastic-embedded liver (not depicted) and DT40 cells (Fig. 1) indicate numerous regions of close association between mitochondria and both rough and smooth ER, but the noisy background (due to particle crowding) made tethers more difficult to detect than in isolated fractions. Tethers connecting OMM and smooth ER in situ (unpublished data) have lengths (9–16 nm) similar to those between attached vesicles and OMM of isolated mitochondria (Table S1). Spacings between OMM and rough ER in situ begin at 20 nm (the minimum distance to accommodate ribosomes), and the measured tether lengths are 19–30 nm (Table S1). Of the six tethers detected in the DT40 tomogram of Fig. 1 (B–F), three appear to terminate at ribosomes on the ER. The DT40 cells used were IP3R triple knockout cells (IP3R-TKO), chosen to assess the role of IP3R in the interorganellar coupling. In electron micrographs of DT40 cells, the IP3R-TKO have ER–mitochondria associations similar to wild-type cells (Fig. S1, B–E), suggesting that an IP3R-independent linkage exists between ER and mitochondria.
Figure 1.

Tethering structures between ER and mitochondria visualized by ET. (A, top) Slice (2 nm thick) from tomogram of a frozen-hydrated rat-liver mitochondrion (700-nm diameter), showing several attached putative ER vesicles. Bar, 100 nm. (bottom) Higher magnification (2×) slices through vesicles 1–3 showing tethers (arrowheads). Bar, 50 nm. (B) Micrograph of a DT40 TKO cell (200-nm-thick plastic section) showing ER flanking a mitochondrion. Bar, 250 nm. (C) Slice (3 nm thick) from tomogram of this field. (D) Surface model of ER (yellow) and OMM (red). (E) Subfields (130-nm diameter) from ER–mitochondria interface regions (1–3 are from boxed region in D) with tethers indicated by arrowheads (black arrowheads indicate tethers that terminate on ribosomes). (F) 3D models of three subregions in E, showing isodensity surfaces that best visualize the tethers (gray), membrane surfaces (OMM, red; ER, yellow), and ribosomes (blue ellipsoids). The resolution is ∼8 nm in the z (vertical or section thickness) direction.
In summary, ET has revealed direct physical links of varying length between smooth and rough ER and mitochondria, both in normal tissue and IP3R knockout cells. Because IP3Rs are present to mediate Ca2+ release at both smooth and rough ER, multiple coupling elements may be relevant for Ca2+ signal propagation from ER to mitochondria. The heterogeneity in tether lengths points to an enticing new possibility, that ER–mitochondria communication may be controlled by varying the interorganellar distance. To test the functional significance of the tethers, we designed strategies for weakening and enhancing the physical coupling.
To disrupt the ER–mitochondria physical coupling, limited proteolysis was used. Confocal images of isolated liver mitochondria preparations showed abundant overlapping immunoreactivity for both IP3R (type 1 and 2) and cytochrome c oxidase, an enzyme of the inner mitochondrial membrane (Fig. 2 A), indicating that the IP3Rs reside in mitochondria-associated ER. When this preparation was trypsinized (40 μg/ml for 150 s followed by addition of soybean trypsin inhibitor [SBI] at 250 μg/ml) and recentrifuged, the IP3R immunoreactivity disappeared (Fig. 2 B) and was recovered in the light membranes (not depicted). The IP3-sensitive Ca2+ store was also quantified by measurement of the IP3 + thapsigargin (Tg)-induced Ca2+ release in the 10,000-g pellet (ER–mitochondria complex) and supernatant (ER only) of both the control and trypsin-pretreated liver mitochondria (Fig. 2 C). Trypsin pretreatment caused a twofold increase in Ca2+ release in the supernatants and a significant decrease in the pellets (Fig. 2 C). Similar findings were obtained in RBL-2H3 cells (Fig. S2, A and B, available at http://www.jcb.org/cgi/content/full/jcb.200604016/DC1). Collectively, these data suggest that limited proteolysis disrupted the physical coupling between ER and mitochondria.
Figure 2.

Limited proteolysis loosens the structural and functional association of the IP3R with mitochondria. (A and B) Confocal images showing the distribution of IP3Rs (red) and the cytochrome c oxidase (green) and their colocalization (overlay, yellow) in a rat-liver mitochondrial fraction attached to coverslips. (B) Trypsin (40 μg/ml; 150 s) was added before attachment to the coverslips (n = 3). (C) ER Ca2+ storage in naive and trypsin-pretreated rat-liver mitochondrial fraction. In suspensions of the particles, the capacity of the ER Ca2+ store was determined as the sum of the extravesicular [Ca2+] ([Ca2+]o) increases caused by sequentially added IP3 and Tg in the 10,000-g supernatants (ER-only fraction) and pellets (ER–mitochondria complex) after trypsinization (40 μg/ml; 150 s) in the presence (control) and absence of SBI (mean ± SEM; n = 10). (D and E) Effect of proteinase K and trypsin on the IP3-induced [Ca2+]c and [Ca2+]m increase in suspensions of permeabilized RBL-2H3 cells. (D) Control (black) and proteinase K–pretreated cells (red) in the absence (left) or presence (middle) of uncoupler (2 μM carbonyl cyanide p-trifluoromethoxyphenylhydrazone + 5 μg/ml oligomycin). (right) [Ca2+]m rise evoked by a 10 μM CaCl2 pulse (Ca; bulk [Ca2+]c increase, ∼3 μM). To prevent the uptake of added Ca2+ by the ER, 2 μM Tg was added 5 s before stimulus. (E) 100 μg/ml trypsin for 150 s (left, red) or 60 s (middle, pink). 40 μg/ml trypsin for 150 s (middle) in the absence (purple) or presence (gray) of 250 μg/ml SBI. (right) Effect of trypsin in the presence of uncoupler.
We next evaluated the effect of proteolytic treatment on mitochondrial Ca2+ signaling. IP3R-mediated Ca2+ release effectively supports mitochondrial Ca2+ uptake in permeabilized RBL-2H3 cells (Csordas et al., 1999). Suspensions of digitonin-permeabilized cells were treated with proteinase K, another serine protease (20 μg/ml for 150 s), and [Ca2+]c and [Ca2+]m were simultaneously monitored fluorometrically. In control cells, 8 μM IP3 evoked an abrupt increase in [Ca2+]c that was paralleled by a rapid and substantial increase in [Ca2+]m (Fig. 2 D, left). In the proteinase K–pretreated cells, the IP3-induced [Ca2+]c increase was preserved, but the [Ca2+]m increase was practically eliminated (Fig. 2 D and Fig. S2 C). Because proteinase K treatment did not affect IP3-induced Ca2+ release (either in the presence or absence of mitochondrial uncouplers) and failed to inhibit the mitochondrial uptake of directly added Ca2+ (Fig. 2 D and Fig. S2 C), it is likely that proteinase K inhibited the transfer of released Ca2+ from IP3Rs to the mitochondria.
Similar data were obtained when trypsin was used instead of proteinase K (Fig. 2 E). Consistent with earlier reports, trypsin-digested preparations retained IP3-induced Ca2+ release (Yoshikawa et al., 1999) but almost completely lost the IP3-induced [Ca2+]m signal, an effect that was prevented by SBI (Fig. 2 E, middle). Trypsin also failed to inhibit the [Ca2+]m increase induced by elevation of the bulk [Ca2+]c by addition of 10 μM CaCl2 (Fig. 2 E; initial rates were 0.96 ± 0.08 for control and 1.25 ± 0.17 μM/s for trypsin, respectively; n = 3). The trypsin dose dependence and time course data (Fig. S2 C) further illustrate that the Ca2+ transfer from IP3Rs to the mitochondrial matrix is very sensitive to trypsinolysis, whereas the Ca2+ release or mitochondrial Ca2+ uptake by itself is hardly inhibited. Thus, limited proteolysis disrupts the link between ER and mitochondria and suppresses the propagation of the IP3R-mediated Ca2+ release to the mitochondria.
To tighten the physical coupling between ER and mitochondria, we created a construct that encodes monomeric red fluorescent protein (mRFP) fused to the OMM targeting sequence of mAKAP1 at the N terminus and fused to the ER targeting sequence of yUBC6 at the C terminus (mAKAP1 [34–63]-mRFP-yUBC6, OMM–ER linker). Based on the size of the fluorescent protein (4.2 × 2.4 nm), the maximal length of this construct is <5 nm. As a control, the above construct was also prepared without the ER targeting sequence (mAKAP1 [34–63]-mRFP). Cells expressing the constructs showed red fluorescence localized to the mitochondria and displayed mitochondrial aggregation in some cells (unpublished data). To analyze the ER–mitochondria interface, the transfected cells were sorted and prepared for transmission EM (TEM). The mAKAP1(34–63)-mRFP transfected cells displayed numerous associations between ER and mitochondria, but the interface area only involved a small fraction of the mitochondrial perimeter (Fig. 3 A, left) similar to the situation in nontransfected cells (Fig. 4 B). The ER–OMM distance showed bimodal distribution, having the most frequent values at 10–15 and 25–30 nm, similar to the results of the ET analysis. In contrast, in the OMM–ER linker transfected cells, the ER formed a cap over large mitochondrial areas and the cleft between the ER membrane and the OMM was extremely narrow (Fig. 3 A, right). On average, the ER–mitochondria distance at these sites decreased from 24 ± 3 to 6 ± 1 nm and the interface area increased fourfold in the presence of the OMM–ER linker (Fig. 3 B). Thus, expression of the OMM–ER linker caused the associations to become tighter and the interface area to increase.
Figure 3.

Enhancement of the ER–mitochondria association and Ca2+ coupling by a synthetic linker protein. (A) Electron micrographs of RBL-2H3 cells expressing the mAKAP1(34–63)-mRFP-yUBC6 or mAKAP1(34–63)-mRFP with red arrows showing the ER–mitochondria contacts. (B) Dimensions of the ER–mitochondria interface in each condition. (C) [Ca2+]m and nuclear [Ca2+] ([Ca2+]nu) responses to submaximal doses of adenophostin (AP) recorded using pericam in cells transfected with OMM-mRFP (black) or OMM–ER linker-mRFP (red). Adenophostin evokes gradual Ca2+ liberation through IP3Rs and a [Ca2+]m increase characterized with a gradual slow phase when the sarcoplasmic/endoplasmic reticulum calcium ATPase pumps are blocked (Csordas and Hajnoczky, 2001). As a reference, a 20-μM CaCl2 pulse (Ca) was applied. (right) [Ca2+]c and [Ca2+]m increases 60 s after adenophostin stimulation. Data are normalized to the response evoked by Ca (P > 0.01; n = 15–16). Error bars indicate SEM.
Figure 4.

Relevance of the tight ER–mitochondria association for cell survival. (A) Sensitization to Tg-induced Ca2+ overloading and mitochondrial membrane permeabilization in RBL-2H3 cells expressing either the OMM–ER linker or OMM- or ER-only targeted control. (left) Overlaid fura2FF fluorescence images recorded at 340 nm (red)/380 nm (green) excitation (56 × 60 μm area) and the fura2FF ratio graphs for individual cells (middle) and for the mean (bottom) show two sequential [Ca2+]c elevations evoked by 2 μM Tg in OMM–ER linker-mRFP (red) and OMM-mRFP (black) overexpressing cells (n = 74 and 100, respectively). (right) Lag time distributions for the steep second [Ca2+]c rise in the experiment shown in the left (bottom) and the fraction of cells exhibiting a [Ca2+]c rise above the first peak at 30 min of stimulation for the series of experiments (n = 3; top). (B) EM images (red arrowheads depicting the close contacts) and measurements of the ER–mitochondria interface in cells exposed to proapoptotic conditions (0% serum starvation and 10 μg/ml tunicamycin). (C) Dependence of mitochondrial function on the gap width between ER and mitochondria. In the scheme, the effects on [Ca2+]m, ATP production, and membrane permeabilization are shown for the normal (middle), loose (left), and tight (right) variations in ER–mitochondria physical coupling. Error bars indicate SEM.
To evaluate the effect of the enhanced physical coupling between the organelles on the Ca2+ transport, we conducted imaging of [Ca2+]m and [Ca2+]c in permeabilized cells expressing either mAKAP1(34–63)-mRFP-yUBC6 or mAKAP1(34–63)-mRFP and the Ca2+ probe, ratiometric pericam targeted to the mitochondrial or nuclear matrix. Synchronous Ca2+ release evoked by maximal IP3 induced comparable [Ca2+]c and [Ca2+]m responses in both OMM–ER linker and control cells (unpublished data). However, a different picture emerged when gradual Ca2+ liberation through IP3Rs was stimulated by adenophostin A (Bird et al., 1999; Csordas and Hajnoczky, 2001). The nuclear matrix [Ca2+] rise that closely follows the [Ca2+]c signal was unaffected in the OMM–ER linker–expressing cells, but the [Ca2+]m elevation was significantly enhanced (Fig. 3 C, top). In particular, the delay between the [Ca2+]nuclear and [Ca2+]m elevation was shortened (Fig. 3 C, left). Thus, overexpression of the linker enabled mitochondrial Ca2+ uptake during Ca2+ mobilization conditions that normally are recognized by the mitochondria with low efficiency. Based on the effects of the synthetic linker, the quantity and the length of the tethers may exert a control on the ER–mitochondria Ca2+ coupling.
Bringing the ER closer to mitochondria by the physiological tethers effectively supports local Ca2+ signaling. However, sustaining a gap between the organelles by the tethers may also bear significance for other cell functions. A too-close association between ER and mitochondrial membranes might cause continuous mitochondrial Ca2+ uptake during background Ca2+ release and, in turn, could facilitate mitochondrial Ca2+ overloading and membrane permeabilization (Bernardi, 1999; Green and Kroemer, 2004). Also, the extent of the anchorage of ER to the mitochondria is relevant to the motility of the mitochondria, which allows dynamic redistribution of the mitochondrial ATP production and Ca2+ buffering throughout the cell (Yi et al., 2004; Brough et al., 2005). To test the idea that tightening of the ER–mitochondria coupling may affect the cells' ability to respond to challenges, RBL-2H3 cells expressing the ER–OMM linker were exposed to Tg, which gradually mobilizes the ER Ca2+ store and, in turn, stimulates the store-operated Ca2+ entry (as a control, either the mitochondria- or the ER-targeted part of the linker was overexpressed). In the cells expressing the OMM–ER linker, the [Ca2+]c signal showed an initial elevation followed by a partial decay to a plateau. After a longer period of time, a gradual elevation appeared turning to a steep and robust [Ca2+]c rise (Fig. 4 A, red). This second [Ca2+]c rise began at different time points in the individual cells, causing a more gradual rise in the mean response (Fig. 4 A, bottom). In control cells, the first [Ca2+]c rise was similar to those in the OMM–ER linker cells; however, the second [Ca2+]c rise developed much more slowly (Fig. 4 A, black). Analysis of [Ca2+]c signals in single cells showed an early onset of both the gradual [Ca2+]c elevation and the steep and robust [Ca2+]c increase (Fig. 4 A, right) in the cells expressing the OMM–ER linker. The second [Ca2+]c elevation was prevented by the addition of either 5 μM carbonyl cyanide p-trifluoromethoxyphenylhydrazone and 2.5 μg/ml oligomycin or by 5 μM cyclosporin A, a drug interfering with the Ca2+-dependent activation of the permeability transition pore, suggesting that it depended on mitochondrial Ca2+ uptake and was a result of Ca2+ release from Ca2+-overloaded mitochondria (unpublished data). Hence, mitochondria were susceptible to Ca2+ overloading and permeabilization in cells where the ER–mitochondria coupling was tightened by the OMM–ER linker.
The mitochondrial Ca2+ dysregulation was regularly followed by detachment of the cells, indicating the loss of viability. Because Ca2+ transfer to the mitochondria is a key step in induction of many forms of cell death, we reasoned that tightening of the ER–mitochondria coupling may contribute to the execution of the cells induced by certain proapoptotic stimuli. To this end, RBL-2H3 cells were exposed to apoptotic conditions (serum starvation and tunicamycin treatment) and were fixed for EM at 24 h, before the onset of cell detachment. Analysis of the dimensions of the ER–mitochondria interface showed shortening of the mean distance between ER and mitochondria in both the serum-starved and tunicamycin-treated cells and an increase in the frequency of tight associations (<6 nm distance; Fig. 4 B). The high incidence of the tight associations could not be attributed to the condensation of the apoptotic cells because the perimeter or area of the cell cross sections has not been altered yet. These results suggest that narrowing of the ER–mitochondria gap occurs in intact cells and may be an important step in the execution of some apoptotic mechanisms.
The scheme in Fig. 4 C illustrates the novel aspects of the ER–mitochondria signaling uncovered in the present work. The association between ER and mitochondria is due to the presence of tethers that link both smooth and rough ER to the mitochondria. The length of the tethers displays some diversity, giving rise to varying distances between ER and mitochondria. In response to apoptotic agents the ER–mitochondria gap narrows, indicating dynamic regulation of the interorganellar junction. In healthy cells, the ER–mitochondria tethering ensures the propagation of IP3R-linked Ca2+ signals to the mitochondria to coordinate ATP production with the stimulated state of the cell and to enable the mitochondrial Ca2+ buffering. However, the gap between the organelles is sufficiently wide to isolate mitochondria from the slow Ca2+ leakage from the ER. Relaxing the ER–mitochondria coupling suppresses the Ca2+ signal propagation to the mitochondria, putting at risk the Ca2+-dependent control of mitochondrial metabolism. In contrast, tightening of the coupling invokes mitochondria in the handling of Ca2+ under resting conditions, sensitizing mitochondria to Ca2+ overloading and leading to permeabilization and committing the cells to a cell death pathway. Tightening of the connections seems to be relevant for several mechanisms of cell death. Thus, these results reveal an unexpected dependence of cell function and survival on the maintenance of a proper spacing between the ER and mitochondria.
Materials and methods
DNA constructs
To construct the OMM–ER linker, mRFP was targeted to the ER by using the C-terminal ER localization sequence of the yeast UBC6 protein (X73234, residues 233–250: MVYIGIAIFLFVGLFMK), through the linker (SGLRSRAQASNSRV; Varnai et al., 2005). This construct was complemented with the N-terminal mitochondrial localization sequence of the mouse AKAP1 protein (V84389, residues 34–63: MAIQLRSLFPLALPGLLALLGWWWFFSRKK) with the linker (DLELKLRILQSTVPRARDPPVAT). Ratiometric pericam targeted to the mitochondrial or nuclear matrix was provided by A. Miyawaki (Institute of Physical and Chemical Research, Wako-city, Japan).
Cells
RBL-2H3 cells were cultured as described previously (Csordas et al., 1999). Cells were transfected with cDNA by means of electroporation in suspensions (4.5 × 10⁶ cells + 20 μg of each cDNA in 250 μl medium). Electroporation was performed in a BTX-830 square-pulse generator in a 4-mm gap cuvette using a single 250-V 13-ms pulse. For FACS sorting (MoFlo FACS sorter [DakoyCytomation] equipped with a 488-nm laser), 8.5–12.5 × 10⁶ cells transfected with a construct of interest and EGFP were cultured for 24 h.
DT40 (wild type and IP3R knockouts alike were a gift from T. Kurosaki, Kansai Medical University, Moriguchi, Japan) cells were cultured in suspension, in RPMI 1640 with glutamine supplemented with penicillin/streptomycin, 2 mM l-glutamine, 10% heat inactivated FCS, and 1% chicken serum (Invitrogen) in 5% CO2 and 95% air at 40°C.
Fluorometric measurements of [Ca2+]c and [Ca2+]m in suspensions of permeabilized RBL-2H3 cells
Experiments were performed as described earlier (Csordas and Hajnoczky, 2001).
Fractionation of RBL-2H3 cells
Cells grown overconfluent in tissue culture flasks (∼7 × 10⁷ cells) were loaded with fura2FF/AM, harvested using trypsin/versene, and washed with Na-Hepes/EGTA. All further steps were performed at 4°C. The cells were exposed to hyposmosis for 10 min (14 ml intracellular medium [ICM; 120 mM KCl, 10 mM NaCl, 1 mM KH2PO4, 20 mM Tris-Hepes, 2 mM MgATP, and 1 μg/ml each of antipain, leupeptin, and pepstatin, pH 7.2]) diluted fivefold with dH2O and supplemented with 200 μM EGTA and 5 mM MgCl2). Subsequently, the cells were homogenized in a dounce glass/glass homogenizer (30–35 strokes, tight pestle). To restore osmolarity, 3 vol of 100% ICM supplemented with 125 mM sucrose, 200 μM EGTA, and 5 mM MgCl2 was added. To eliminate unbroken cells and nuclei, the homogenate was centrifuged at 1,000 g for 10 min. The supernatant was further centrifuged at 10,000 g for 15 min, and the pellet (mitochondrial fraction) was resuspended in 400–500 μl ICM plus protease inhibitors and 10 μM EGTA and stored on ice. Attachment to CellTak (BD Biosciences) coated coverslips was performed at room temperature for 5 min in the presence of 2 mM Mg2+ATP in 25–50 μl vol.
Fractionation of rat liver
The protocol was adapted from Meier et al. (1981). The liver of a 350–400-g normal male Sprague-Daily rat was perfused with ∼200-ml Na-Hepes/EGTA and was removed. All the further steps were done at 4°C. The liver was cut up to small pieces with scissors and washed with ICM. After determination of the wet weight, a 1:4 homogenate was prepared in 350 mM sucrose containing 2.5 mM magnesium acetate and 10 mM Tris maleate, pH 7.4. Homogenization was performed in a 60-ml glass-Teflon homogenizer (11 strokes at 900 rev/min). The homogenate was filtered through two layers of sterile gauze and once more through one layer of Miracloth (Calbiochem). The mitochondrial fraction was obtained by centrifuging the supernatant of the 900-g (10 min) fraction at 8,000 g for 15 min. Particles were attached to CellTak-coated coverslips as described above in the previous paragraph.
Immunostaining of the mitochondrial fractions
The membrane fractions attached to coverslips were fixed in 3% paraformaldehyde. A monoclonal anti-human cytochrome c oxidase complex IV subunit 1 antibody (Invitrogen) was used to visualize mitochondria and polyclonal anti–IP3R-1 and -2 antibodies (Affinity BioReagents, Inc.) were used to visualize the IP3Rs. The secondary antibodies were fluorescently labeled (Alexa Fluor 488 and 568). Images were acquired using a confocal system (Radiance 2001; Bio-Rad Laboratories), and colocalization was evaluated using Lasersharp software (Bio-Rad Laboratories; Csordas and Hajnoczky, 2001).
Fluorometric monitoring of extravesicular [Ca2+] in suspension of rat-liver mitochondrial fraction
A 20–25-μl aliquot of the crude mitochondrial fraction was transferred to 800 μl ICM supplemented with 1.5 μM fura2/FA, 2 mM Mg-ATP, 2 mM succinate, and protease inhibitors in a stirred cuvette at 35°C. Ratiometric recording of fura2 fluorescence was performed as described for the permeabilized cells.
Fluorescence imaging of [Ca2+] in single cells and in adherent subcellular particles
RBL-2H3 cells or mitochondrial fractions attached to coverslips were placed in 1 ml buffer to the heated stage (35 C°) of a microscope (IX70 [Olympus]; 40×; UApo340) connected to a cooled charge-coupled device camera (PXL; Photometrics). Ratiometric imaging of fura2FF and pericam was used to monitor [Ca2+]c and [Ca2+]m as described previously (Csordas and Hajnoczky, 2001; Yi et al., 2004).
TEM and ET
For embedding, a standard protocol was used (Pacher et al., 2000). Ultrathin sections for TEM were poststained with UA and sodium bismuth (Pacher et al., 2000). The sections were examined with either a scanning transmission electron microscope (model 7000; Hitachi) or a digital transmission electron microscope (Tecnai 12; Philips) driven by Gatan software.
For ET of DT40 cells, 150–300-nm-thick sections were cut from epoxy blocks, and 15-nm colloidal gold particles were applied to one side as alignment markers. Tilt series were collected on an AEI EM7 high-voltage electron microscope operated at an accelerating voltage of 1,000 kV. Images were serially recorded around two orthogonal tilt axes, over angular ranges of ±60° at 2° intervals.
For cryo-EM of isolated mitochondria, 3–5-μl aliquots of mitochondrial suspensions (10–20 mg/ml in 0.225 M manitol and 0.075 M sucrose) containing 10-nm colloidal gold particles were deposited on freshly glow-discharged 300-mesh copper grids with holey carbon films. Grids were blotted with filter paper and immediately plunged into liquid ethane cooled by liquid nitrogen. Tilt series were collected over an angular range of ±60° at 2° intervals (total dose ∼24 electrons/Ǻ2) using a transmission electron microscope (JEM-4000FX; JEOL) equipped with Gatan cryo-transfer unit and a TVIPS 1024 × 1024 cooled charge-coupled device camera.
Images were aligned and tomographic reconstructions calculated as previously described (Penczek et al., 1995), using the weighted back-projection method as implemented in the SPIDER image processing system (Frank et al., 1996). 3D models were generated by density thresholding using Iris Explorer (Numerical Algorithms Group) or surface rendering in Iris Explorer after manual membrane tracing in Sterecon (Marko and Leith, 1996). In the case of plastic sections, the z dimension (section thickness) of the final models was increased by 20% to compensate for radiation-induced thinning of the plastic section. Lengths of tethers connecting mitochondrial outer membranes and ER membranes were determined using NIH ImageJ.
Online supplemental material
Table S1 shows the dimensions of the ER–mitochondria interaction areas. Fig. S1 shows tight ER–mitochondria associations in quick frozen and chemically fixed isolated liver mitochondria and in wild-type and IP3R-TKO DT40 cells. Fig. S2 demonstrates protein linkage between ER and mitochondria in RBL-2H3 cells. Online supplemental material is available at http://www.jcb.org/cgi/content/full/jcb.200604016/DC1.
Supplementary Material
Acknowledgments
We thank Drs. David Birk and Ted Taraschi for access to EM equipment.
ET at the Resource for Visualization of Biological Complexity is supported by a grant from the National Center for Research Resources of the National Institutes of Health (RR01219). T. Balla and P. Varnai were supported in part by the Intramural Research Program of the National Institute of Child Health and Human Development of the National Institutes of Health. P. Varnai was supported in part by the Senior Fellowship Program administered by the Oak Ridge Institute for Science and Education through an interagency agreement between the U.S. Department of Energy and the National Institutes of Health. This work was supported by a grant from the National Institutes of Health to G. Hajnoczky (DK51526).
Abbreviations used in this paper: [Ca2+]c, cytoplasmic [Ca2+]; [Ca2+]m, mitochondrial matrix [Ca2+]; ET, electron tomography; IP3R, IP3 receptor; mRFP, monomeric red fluorescent protein; OMM, outer mitochondrial membrane; SBI, soybean trypsin inhibitor; TEM, transmission EM; Tg, thapsigargin.
References
- Bernardi, P. 1999. Mitochondrial transport of cations: channels, exchangers, and permeability transition. Physiol. Rev. 79:1127–1155. [DOI] [PubMed] [Google Scholar]
- Bird, G.S., M. Takahashi, K. Tanzawa, and J.W. Putney Jr. 1999. Adenophostin A induces spatially restricted calcium signaling in Xenopus laevis oocytes. J. Biol. Chem. 274:20643–20649. [DOI] [PubMed] [Google Scholar]
- Brough, D., M.J. Schell, and R.F. Irvine. 2005. Agonist-induced regulation of mitochondrial and endoplasmic reticulum motility. Biochem. J. 392:291–297. [DOI] [PMC free article] [PubMed] [Google Scholar]
- Collins, T.J., M.J. Berridge, P. Lipp, and M.D. Bootman. 2002. Mitochondria are morphologically and functionally heterogeneous within cells. EMBO J. 21:1616–1627. [DOI] [PMC free article] [PubMed] [Google Scholar]
- Csordas, G., and G. Hajnoczky. 2001. Sorting of calcium signals at the junctions of endoplasmic reticulum and mitochondria. Cell Calcium. 29:249–262. [DOI] [PubMed] [Google Scholar]
- Csordas, G., A.P. Thomas, and G. Hajnoczky. 1999. Quasi-synaptic calcium signal transmission between endoplasmic reticulum and mitochondria. EMBO J. 18:96–108. [DOI] [PMC free article] [PubMed] [Google Scholar]
- Demaurex, N., and C. Distelhorst. 2003. Cell biology. Apoptosis–the calcium connection. Science. 300:65–67. [DOI] [PubMed] [Google Scholar]
- Dolman, N.J., J.V. Gerasimenko, O.V. Gerasimenko, S.G. Voronina, O.H. Petersen, and A.V. Tepikin. 2005. Stable Golgi-mitochondria complexes and formation of Golgi Ca2+ gradients in pancreatic acinar cells. J. Biol. Chem. 280:15794–15799. [DOI] [PubMed] [Google Scholar]
- Ferri, K.F., and G. Kroemer. 2001. Organelle-specific initiation of cell death pathways. Nat. Cell Biol. 3:E255–E263. [DOI] [PubMed] [Google Scholar]
- Filippin, L., P.J. Magalhaes, G. Di Benedetto, M. Collela, and T. Pozzan. 2003. Stable interactions between mitochondria and endoplasmic reticulum allow rapid accumulation of calcium in a subpopulation of mitochondria. J. Biol. Chem. 278:39224–39234. [DOI] [PubMed] [Google Scholar]
- Frank, J., M. Radermacher, P. Penczek, J. Zhu, Y. Li, M. Ladjadj, and A. Leith. 1996. SPIDER and WEB: processing and visualization of images in 3D electron microscopy and related fields. J. Struct. Biol. 116:190–199. [DOI] [PubMed] [Google Scholar]
- Green, D.R., and G. Kroemer. 2004. The pathophysiology of mitochondrial cell death. Science. 305:626–629. [DOI] [PubMed] [Google Scholar]
- Hajnoczky, G., L.D. Robb-Gaspers, M.B. Seitz, and A.P. Thomas. 1995. Decoding of cytosolic calcium oscillations in the mitochondria. Cell. 82:415–424. [DOI] [PubMed] [Google Scholar]
- Hoth, M., D.C. Button, and R.S. Lewis. 2000. Mitochondrial control of calcium-channel gating: a mechanism for sustained signaling and transcriptional activation in T lymphocytes. Proc. Natl. Acad. Sci. USA. 97:10607–10612. [DOI] [PMC free article] [PubMed] [Google Scholar]
- Jouaville, L.S., P. Pinton, C. Bastianutto, G.A. Rutter, and R. Rizzuto. 1999. Regulation of mitochondrial ATP synthesis by calcium: evidence for a long-term metabolic priming. Proc. Natl. Acad. Sci. USA. 96:13807–13812. [DOI] [PMC free article] [PubMed] [Google Scholar]
- Kirichok, Y., G. Krapivinsky, and D.E. Clapham. 2004. The mitochondrial calcium uniporter is a highly selective ion channel. Nature. 427:360–364. [DOI] [PubMed] [Google Scholar]
- Mannella, C.A., M. Marko, P. Penczek, D. Barnard, and J. Frank. 1994. The internal compartmentation of rat-liver mitochondria: tomographic study using the high-voltage transmission electron microscope. Microsc. Res. Tech. 27:278–283. [DOI] [PubMed] [Google Scholar]
- Mannella, C.A., K. Buttle, B.K. Rath, and M. Marko. 1998. Electron microscopic tomography of rat-liver mitochondria and their interaction with the endoplasmic reticulum. Biofactors. 8:225–228. [DOI] [PubMed] [Google Scholar]
- Marko, M., and A. Leith. 1996. Sterecon–three-dimensional reconstructions from stereoscopic contouring. J. Struct. Biol. 116:93–98. [DOI] [PubMed] [Google Scholar]
- Meier, P.J., M.A. Spycher, and U.A. Meyer. 1981. Isolation and characterization of rough endoplasmic reticulum associated with mitochondria from normal rat liver. Biochim. Biophys. Acta. 646:283–297. [DOI] [PubMed] [Google Scholar]
- Nicholls, D.G. 2005. Mitochondria and calcium signaling. Cell Calcium. 38:311–317. [DOI] [PubMed] [Google Scholar]
- Pacher, P., P. Csordas, T. Schneider, and G. Hajnoczky. 2000. Quantification of calcium signal transmission from sarco-endoplasmic reticulum to the mitochondria. J. Physiol. 529:553–564. [DOI] [PMC free article] [PubMed] [Google Scholar]
- Parimoo, S., N. Rao, and G. Padmanaban. 1982. Cytochrome c oxidase is preferentially synthesized in the rough endoplasmic reticulum–mitochondrion complex in rat liver. Biochem. J. 208:505–507. [DOI] [PMC free article] [PubMed] [Google Scholar]
- Penczek, P., M. Marko, K. Buttle, and J. Frank. 1995. Double-tilt electron tomography. Ultramicroscopy. 60:393–410. [DOI] [PubMed] [Google Scholar]
- Pitts, K.R., Y. Yoon, E.W. Krueger, and M.A. McNiven. 1999. The dynamin-like protein DLP1 is essential for normal distribution and morphology of the endoplasmic reticulum and mitochondria in mammalian cells. Mol. Biol. Cell. 10:4403–4417. [DOI] [PMC free article] [PubMed] [Google Scholar]
- Rapizzi, E., P. Pinton, G. Szabadkai, M.R. Wieckowski, G. Vandecasteele, G. Baird, R.A. Tuft, K.E. Fogarty, and R. Rizzuto. 2002. Recombinant expression of the voltage-dependent anion channel enhances the transfer of Ca2+ microdomains to mitochondria. J. Cell Biol. 159:613–624. [DOI] [PMC free article] [PubMed] [Google Scholar]
- Rizzuto, R., P. Pinton, W. Carrington, F.S. Fay, K.E. Fogarty, L.M. Lifshitz, R.A. Tuft, and T. Pozzan. 1998. Close contacts with the endoplasmic reticulum as determinants of mitochondrial Ca2+ responses. Science. 280:1763–1766. [DOI] [PubMed] [Google Scholar]
- Robb-Gaspers, L.D., P. Burnett, G.A. Rutter, R.M. Denton, R. Rizzuto, and A.P. Thomas. 1998. Integrating cytosolic calcium signals into mitochondrial metabolic responses. EMBO J. 17:4987–5000. [DOI] [PMC free article] [PubMed] [Google Scholar]
- Shore, G.C., and J.R. Tata. 1977. Two fractions of rough endoplasmic reticulum from rat liver. I. Recovery of rapidly sedimenting endoplasmic reticulum in association with mitochondria. J. Cell Biol. 72:714–725. [DOI] [PMC free article] [PubMed] [Google Scholar]
- Simmen, T., J.E. Aslan, A.D. Blagoveshchenskaya, L. Thomas, L. Wan, Y. Xiang, S.F. Feliciangeli, C.H. Hung, C.M. Crump, and G. Thomas. 2005. PACS-2 controls endoplasmic reticulum-mitochondria communication and Bid-mediated apoptosis. EMBO J. 24:717–729. [DOI] [PMC free article] [PubMed] [Google Scholar]
- Varadi, A., L.I. Johnson-Cadwell, V. Cirulli, Y. Yoon, V.J. Allan, and G.A. Rutter. 2004. Cytoplasmic dynein regulates the subcellular distribution of mitochondria by controlling the recruitment of the fission factor dynamin-related protein-1. J. Cell Sci. 117:4389–4400. [DOI] [PubMed] [Google Scholar]
- Varnai, P., A. Balla, L. Hunyady, and T. Balla. 2005. Targeted expression of the inositol 1,4,5-triphosphate receptor (IP3R) ligand-binding domain releases Ca2+ via endogenous IP3R channels. Proc. Natl. Acad. Sci. USA. 102:7859–7864. [DOI] [PMC free article] [PubMed] [Google Scholar]
- Voelker, D.R. 2005. Bridging gaps in phospholipid transport. Trends Biochem. Sci. 30:396–404. [DOI] [PubMed] [Google Scholar]
- Wang, H.J., G. Guay, L. Pogan, R. Sauve, and I.R. Nabi. 2000. Calcium regulates the association between mitochondria and a smooth subdomain of the endoplasmic reticulum. J. Cell Biol. 150:1489–1498. [DOI] [PMC free article] [PubMed] [Google Scholar]
- Yi, M., D. Weaver, and G. Hajnoczky. 2004. Control of mitochondrial motility and distribution by the calcium signal: a homeostatic circuit. J. Cell Biol. 167:661–672. [DOI] [PMC free article] [PubMed] [Google Scholar]
- Yoshikawa, F., H. Iwasaki, T. Michikawa, T. Furuichi, and K. Mikoshiba. 1999. Trypsinized cerebellar inositol 1,4,5-trisphosphate receptor. Structural and functional coupling of cleaved ligand binding and channel domains. J. Biol. Chem. 274:316–327. [DOI] [PubMed] [Google Scholar]
Associated Data
This section collects any data citations, data availability statements, or supplementary materials included in this article.