

Abstract
The Goto Kakizaki (GK) rat is a widely used animal model to study defective glucose-stimulated insulin release in type-2 diabetes (T2D). As in T2D patients, the expression of several proteins involved in Ca2+-dependent exocytosis of insulin-containing large dense-core vesicles is dysregulated in this model. So far, a defect in late steps of insulin secretion could not be demonstrated. To resolve this apparent contradiction, we studied Ca2+–secretion coupling of healthy and GK rat β cells in acute pancreatic tissue slices by assessing exocytosis with high time-resolution membrane capacitance measurements. We found that β cells of GK rats respond to glucose stimulation with a normal increase in the cytosolic Ca2+ concentration. During trains of depolarizing pulses, the secretory activity from GK rat β cells was defective in spite of upregulated cell size and doubled voltage-activated Ca2+ currents. In GK rat β cells, evoked Ca2+ entry was significantly less efficient in triggering release than in nondiabetic controls. This impairment was neither due to a decrease of functional vesicle pool sizes nor due to different kinetics of pool refilling. Strong stimulation with two successive trains of depolarizing pulses led to a prominent activity-dependent facilitation of release in GK rat β cells, whereas secretion in controls was unaffected. Broad-spectrum inhibition of PKC sensitized Ca2+-dependent exocytosis, whereas it prevented the activity-dependent facilitation in GK rat β cells. We conclude that a decrease in the sensitivity of the GK rat β-cell to depolarization-evoked Ca2+ influx is involved in defective glucose-stimulated insulin secretion. Furthermore, we discuss a role for constitutively increased activity of one or more PKC isoenzymes in diabetic rat β cells.
INTRODUCTION
A primary event in the development of type-2 diabetes is a decrease in the capacity of pancreatic β cells to secrete insulin in response to glucose stimulation (Bergman et al., 2002; Gerich, 2002). As in synaptic vesicle exocytosis, proteins of the soluble N-ethylmaleimide–sensitive factor attachment protein receptor (SNARE) complex are indispensable for the regulated secretion of insulin-containing large dense-core vesicles (LDCV) from pancreatic β cells (Wheeler et al., 1996).
The Goto Kakizaki (GK) rat is a well-established inbred model for nonobese T2D (Portha, 2005). Albeit also showing some degree of hepatic and peripheral insulin resistance, especially glucose-stimulated insulin secretion (GSIS) from β cells of GK rats is prominently impaired (Goto et al., 1976; Portha et al., 1991; Abdel-Halim et al., 1996). Similar to islets of T2D patients (Ostenson et al., 2006), the expression of several of the SNARE complex proteins is dysregulated in this GK islets. Protein levels of α-SNAP, SNAP-25, syntaxin-1, Munc13-1, Munc18-1 (nSec1), N-ethylmaleimide–sensitive fusion protein (NSF), and synaptotagmin III were found to be reduced (Nagamatsu et al., 1999; Zhang et al., 2002; Sheu et al., 2003). Furthermore, other studies demonstrated that the number of syntaxin-1A and SNAP-25 clusters and the number of morphologically docked insulin-containing LDCVs are reduced as well (Ohara-Imaizumi et al., 2004a,b). Normalization of the expression of some of the aforementioned proteins improves impaired insulin secretion in these animals (Nagamatsu et al., 1999; Ohara-Imaizumi et al., 2004b).
An earlier study using cultured β cells could not demonstrate any defects in late steps of stimulus–secretion coupling in GK rats (Hughes et al., 1998). Moreover, to nonnutrient stimulation (high external K+ concentrations), GK rat islets respond with even more pronounced insulin secretion compared with healthy islets (Abdel-Halim et al., 1996). This led to the conclusion of defective glucose metabolism rather than impaired secretory machinery function being the primary lesion site in T2D β cells (Abdel-Halim et al., 1996).
Biochemical studies performed so far lacked the temporal and spatial resolution to reveal kinetic alterations in LDCV secretion of diabetic β cells. On the other hand, time-resolved electrical measurements of LDCV release were performed in vitro on single β cells from primary cell cultures (Hughes et al., 1998), where cell dissociation can alter secretory function as demonstrated in adrenal chromaffin cells (Moser and Neher, 1997), pituitary melanotrophs (Sedej et al., 2005), and mouse β cells (Speier et al., 2007). The secretory capacity of β cells is particularly dependent on the intact functional interaction between the cells within the islet (Pipeleers et al., 1982; Speier et al., 2007) and is negatively affected by cell culturing (Zawalich et al., 1998).
The aim of this study is to elucidate the apparent contradiction between molecular biology data and secretion studies, by taking advantage of a novel in situ approach. The acute endocrine tissue slice preparation of rodent pancreas (Speier and Rupnik, 2003) combines the high-time resolution of electrophysiological single-cell experiments while also preserving the islet microanatomy.
To measure regulated exocytosis we used the whole-cell patch-clamp technique to monitor membrane capacitance (Cm), a parameter sensitive to the changes in cell surface area occurring during exo- or endocytosis (Neher and Marty, 1982). Our data indicate that Ca2+–secretion coupling in β cells of GK rats indeed is impaired. Diabetic β cells showed a decreased efficacy of Ca2+ to trigger rapid LDCV exocytosis and a facilitation of LDCV release during repetitive stimulation. The latter finding provides an explanation for the paradoxical hypersecretion due to nonnutrient stimulation found in GK rats as well as individuals suffering from T2D (Giroix et al., 1983; Leahy et al., 1992; Okamoto et al., 1995). Using a pharmacological approach to inhibit protein kinase activity in healthy and diabetic rat β cells, our data furthermore indicate that the underlying cause for the observed phenomena in β cells of diabetic GK rats might be a long-term enhancement of PKC activity.
MATERIALS AND METHODS
Animals
Experiments were performed on β cells within intact islets in pancreatic tissue slices of adult male healthy (Wistar) and diabetic (GK) rats (age 8–18 wk). GK rats and GK rat breeding pairs were obtained from a commercial supplier (Taconic M&B) and bred up to F2 in our animal facility. All animals were kept under standard housing conditions and were allowed to feed and drink ad libitum. The rats were killed by CO2 asphyxiation followed by cervical dislocation. Immediately afterwards, blood samples were taken from the tail vein and heart for glucose and insulin measurements, respectively. Our GK rats showed stable nonfasting hyperglycemia (16.9 ± 1.3 mM, n = 22, vs. 6.7 ± 0.1 mM, n = 38, P < 0.001) and increased plasma insulin levels (927.2 ± 147.4 pM l−1, n = 12, vs. 342.8 ± 49.9 pM l−1, n = 13; P < 0.001). Blood glucose concentration was measured using the glucose oxidase method (OneTouch Ultra, Lifescan) and plasma insulin measurements were performed with an insulin sandwich enzyme-linked immunoassay (Ultrasensitive Mouse Insulin ELISA Kit, Mercodia). Experiments were conducted according to the regulations of our institutional and state committees on animal experiments.
Solutions
We used a standard extracellular solution (ES) consisting of (in mM) 125 NaCl, 2.5 KCl, 26 NaHCO3, 1.25 Na2HPO4, 2 Na pyruvate, 0.25 ascorbic acid, 3 myo-inositol, 6 lactic acid, 1 MgCl2, 2 CaCl2, and 3 glucose. All external solutions were adjusted to pH 7.3 by gassing with carbogen (95% O2, 5% CO2) for at least 30 min before use. The pipette filling solution contained (in mM) 127 Cs-methanesulfonate, 8 CsCl, 10 HEPES (pH 7.2; CsOH), 2 MgCl2, 0.05 EGTA, 20 TEACl, and 4 ATP-Na2. A higher ATP concentration as frequently used otherwise was chosen to comply with empirical data showing a mean islet ATP concentration of 3.9 mM (Ashcroft et al., 1973). In some experiments external CaCl2 was elevated by replacing NaCl in the ES to maintain isoosmolarity (300 ± 10 mOsm). The liquid junction potential was calculated with the JPCalc software (Barry, 1994) to be 9 mV and was similar for both the standard and the Ca2+-elevated ES. PMA, bisindolylmaleimide I (BIS), and PKC 19-31 were obtained from Calbiochem and stock solutions of 1 mM (PMA), 2.5 mM (BIS), and 500 μM (PKC 19-31) were prepared either in DMSO (PMA, BIS) or 5% acetic acid (PKC 19-31) and stored frozen until use. The final concentration of DMSO in solution was <0.02%. The pipette filling solution used for cell dialysis with PKC 19-31 was slightly hypoosmolar (290 mOsm, omitting 10 mM Cs-methanesulfonate) to compensate for the increase in osmolarity after the necessary pH adjustment with CsOH after the addition of PKC 19-31. All other chemicals used were purchased from Sigma-Aldrich unless otherwise indicated.
Preparation of Rat Pancreatic Tissue Slices
The abdominal cavity was opened, and warm (37°C) low gelling temperature agarose (2% wt/vol, Seaplaque GTG agarose, BMA Products) was injected into the distally (duodenal side) clamped bile duct. Prior to the injection a ligature was performed at the height of the hepatic bifurcation of the bile duct to prevent the injected agarose from flowing backward toward the liver. After injection, the pancreas was cooled down fast with ice-cold ES. The hardened pancreas was extracted into an ice-cold ES. To reduce ischemic damage of the tissue, care was taken to ensure that <10 min elapsed from the stoppage of cardiac activity to cooling down of the preparation. The tissue was inserted into a small dish filled with warm (37°C) agarose and then immediately cooled down on ice. A small cube was cut out of the splenic part of the agarose-embedded tissue and glued onto the probe plate of a vibratome (VT 1000 S, Leica). The tissue was sliced at a speed of 0.05 mm s−1 at 75 Hz into 200-μm-thick slices of ∼1 × 1 cm containing on average 4.0 ± 0.3 islets (n = 20 slices and 73 islets). During slicing and for storage the tissue slices were kept in ice-cold ES and were continuously gassed with carbogen. Before starting the experiments slices were incubated for at least 30 min at 32°C in carbogenated ES. Experiments regularly started within 1 h after tissue extraction and could be performed for up to 8 h.
Single-Cell Ca2+ Imaging
The K+ salt of the leakage-resistant Ca2+ indicator Fura-PE3 (Vorndran et al., 1995) (TEF Labs, 50 μM, added to the EGTA-free pipette solution) was used to monitor intracellular Ca2+ concentration changes (Δ[Ca2+]i) simultaneously with the patch-clamp recordings. Monochromatic light (Polychrome IV, TILL Photonics) alternating between 340 and 380 nm (50 Hz) was short-pass filtered (at 410 nm), reflected by a dichroic mirror (centered at 400 nm), and directed through a 60× water immersion objective (N.A. = 1) focused on the vertical midline section of the patched and loaded cell. The emitted fluorescence was transmitted by the dichroic mirror and further filtered through a 470-nm barrier filter. Images were obtained at a rate of 50 Hz (6-ms exposure time) using a cooled emCCD camera (Ixon, Andor Technology) and native Andor software. [Ca2+]i was calculated from the background-subtracted intensity ratios of the images obtained with 340 and 380 nm excitation using the equation derived by Grynkiewicz et al. (1985):
 |
where K d* is the apparent K d of Fura PE3 of our experimental setup, R is the measured fluorescence intensity ratio, and R min and R max are the ratios obtained by intracellular three-point in vivo calibrations with EGTA-buffered intracellular solutions containing no ([Ca2+]free = 0 μM; 10 mM K+-EGTA), a defined ([Ca2+]free = 0.367 μM; 3 mM K+-EGTA, 7 mM Ca2+-EGTA), and a saturating concentration of free Ca2+ ([Ca2+]free ≈ 36 μM, 10 mM Ca2+-EGTA). Free Ca2+ was calculated using the Max-Chelator software (Patton et al. 2004). Two to three β cells were filled with each calibration solution and mean values of 1.2 μM, 0.14, and 0.98 for K d*, R min, and R max were obtained. All necessary calculations were performed using a custom written Matlab script, and image acquisition and hardware triggering parameters were calculated and controlled by a custom AndorBasic (Andor Technology) program.
In addition to monitoring [Ca2+]i, images of the dye-loaded cells were used for the morphometric analysis of cell size to complement the resting Cm measurements. The β-cell cross-sectional area (A) of a custom-shaped region of interest (ROI) enclosing the cell perimeter of the midline focus section was determined with the WiseVision software (Wise Technologies). Cell size was assessed as total surface area (F) of the cell and was approximated by assuming spherical cell shape according to F = 4 × A. The obtained images were size calibrated using images of fluorescent microspheres (4 μm, Molecular Probes) excited at 380 nm.
Islet Ca2+ Imaging
To observe [Ca2+]i changes in a large number of islet cells, slices were bulk loaded with 6 μM Fura-PE3 AM (stock, 4 mM in DMSO with 5% pluronic acid F-127; Molecular Probes). After loading for 60 min on an orbital shaker, the slices were incubated for at least 15 min in indicator-free ES at 32°C to achieve a sufficient degree of deesterification. The final concentrations of DMSO and pluronic acid were 0.15% and 0.007%, respectively.
Ratio image pairs were taken at a frequency of 1 Hz (exposure time, 60 ms per image) with a 20× water immersion objective (N.A. = 0.5) using the same setup as for single-cell Ca2+ imaging. The obtained images (512 × 512 pixel, 2 × 2 on-chip binning) were background corrected by subtracting the average pixel intensity of tissue-free areas from the intensity values of all image pixels for each frame separately. Image analysis and acquisition were performed using the Andor software in connection with custom written AndorBasic scripts. The experiments were performed under constant perfusion of the recording chamber with carbogenated ES at 37°C at a constant flow rate of ∼1.5 ml min−1. The delay time for a solution change to reach the recording chamber ranged from 40 to 45 s and all data were adjusted accordingly.
Electrophysiology
Whole-cell patch-clamp recordings were performed under constant perfusion with carbogenated ES (31–33°C). We used controlled whole-cell dialysis to exclude signaling differences resulting from dissimilar concentrations of diffusible cytosolic factors like ATP and cAMP in Wistar and GK rat β cells that have been reported earlier (Dachicourt, N., D. Serradas, D. Bailbe, and B. Portha. 1997. Diabetologia. Abstr. 40; Hughes et al., 1998). β cells were identified by the characteristic half maximal inactivation of voltage-activated Na+ currents (∼−100 mV; Göpel et al., 1999; Speier and Rupnik, 2003), which renders a majority of these channels inactive at resting membrane potential. All experiments were performed on a SWAM II C dual-phase lock-in patch-clamp amplifier (Celica). Data were filtered at 3 kHz by an A/D converter (National Instruments). Recording, stimulation, and preliminary analysis were performed using the WinWcp software (v3.52; John Dempster, University of Strathclyde, Glasgow, UK). Patch pipettes were pulled (P-97; Sutter Instruments) from borosilicate glass capillaries (GC150F-15; WPI) to a resistance of 2–4 MΩ in pipette solution. Fast pipette capacitance (Cfast) was compensated before and slow membrane capacitance (Cslow) as well as series conductance (Gs) were compensated after whole-cell breakthrough. Only experiments with Gs > 50 nS were processed. The initial Cslow values were further used as data for the estimation of the surface area (F) of the patched cells assuming a specific Cm of 9 fF μm−2 (MacDonald et al., 2005). The cross-sectional area was derived according to A = F/4. All currents were analyzed and presented after p/n leak subtraction. To estimate changes in membrane capacitance (ΔCm) the piecewise linear technique was used (1.6 kHz sine wave frequency, 11 mV RMS amplitude). Secretory activity was triggered by trains or single depolarization pulses as indicated. To determine the evoked ΔCm, Cm was first averaged over the 30 ms preceding the depolarization to obtain a baseline value that was subtracted from the value estimated after the depolarization averaged over a 40-ms window. The first 30 ms after the depolarization were excluded from the Cm measurement to avoid contamination by nonsecretory capacitive transients related to gating charge movement (Horrigan and Bookman, 1994). In most cases, no asynchronous release was detected and experiments showing fast endocytosis after stimulus cessation were discarded. Only experiments not displaying crosstalk between Cm and membrane conductance monitored in parallel were used for analysis. To calculate Ca2+ charge entry, the first 2 ms of the inward current integral were omitted to reduce contamination with Na+ current. No tetrodotoxin was used to enable β-cell identification and reduce nonsecretory Cm transients (Horrigan, F.T., and R.J. Bookman. 1993. Biophys. J. 64:101). In dual-pulse protocols a slightly smaller inward current for the second depolarization was considered acceptable, because Ca2+ entering during the second pulse will add to the already increased cytosolic Ca2+ resulting from Ca2+ during the first depolarization (Dinkelacker et al., 2000).
For data analysis and figure preparation we used Matlab, Matview (Matlab WinWCP extension, Wise Technologies), and Sigmaplot and Sigmastat (SPSS). Statistics are given as means ± SEM, and statistical significance was tested by paired and unpaired Student's t tests as indicated.
Online Supplemental Material
The online supplemental material is available at http://www.jgp.org/cgi/content/full/jgp.200609604/DC1. As a supplement to Fig. 2, videos of the still images shown can be found online. Furthermore, three supplementary figures were included.
RESULTS
General Characteristics of Wistar and GK Rat Islets in Tissue Slices
Minor modifications to the original protocol (Speier and Rupnik, 2003) rendered the slice preparation suitable to study the electrophysiology of rat β cells. Fig. 1 A shows the morphology of slices of healthy Wistar and diabetic GK rats. GK rat islets could frequently be distinguished from control by their red appearance resulting from an erythrocyte-filled islet vasculature. This is in good agreement with previously reported increased islet blood flow under hyperglycemic conditions (Svensson et al., 2000).
Figure 1.

β cells of GK rats in tissue slices are hypertrophic and display increased Ca2+ currents. (A, left) Transmitted light image of a pancreatic tissue slice of a Wistar rat. Note the orange-brown central islet, the surrounding exocrine tissue (white arrow), and a pancreatic duct (black arrow). (A, right) Red, erythrocyte-filled islet (white arrow) in a GK rat tissue slice. (B) Total β-cell surface area (F) estimated from images of dye-loaded cells (i) and derived from the initial Cm of whole-cell patch-clamped cells (ii). (C, i) Whole-cell Ca2+ currents of Wistar and GK β cells evoked by voltage ramps ranging from −89 to 51 mV with a duration of 300 ms (0.47 mV ms−1). Peak HVA and LVA currents in GK rat β cells are indicated by dashed gray lines. (ii) Peak LVA (left) and HVA (right) current densities of ramp-evoked Ca2+ influx in Wistar (open bars) and GK rat (gray bars) β cells. ***, P < 0.001; **, P < 0.01, unpaired t test.
Roughly one third of the GK rat islets in the acute tissue slice preparation showed changes in morphology similar to the described fibrotic “starfish shaped” islets (Guenifi et al., 1995). Previously, considerable difficulties have been reported in isolating fibrotic islets from diabetic GK rats, presumably because the connective tissue invasion of these islets hinders the enzymatic digestion necessary for this preparation (Ostenson 2000). This potential bias toward islets less affected by the diabetic phenotype might partly explain the differences to previously published data we report here, since the slice preparation we use allows in situ recordings of β cells regardless of islet morphology.
GK Rat β Cells in Tissue Slices Are Hypertrophic and Display Increased Ca2+ Currents
We found that β cells in diabetic GK rat islets were significantly hypertrophic. In agreement with previously published data (Lou et al., 2003), rat β cells in tissue slices had an average resting Cm of 6.4 ± 0.15 pF (n = 271). Using this value as a measure of cell size we found that GK rat β cells were significantly larger (Cm = 9.8 ± 0.36 pF, n = 109; P < 0.001). Assuming a specific membrane capacitance of 9 fF μm−2 (MacDonald et al., 2005), this corresponds to a difference in cell surface area of 367 μm2 (716 ± 16.2 μm2, n = 271, vs. 1083 ± 39.6 μm2, n = 109; P < 0.001). Similar, albeit slightly bigger, cell sizes were determined by estimating the surface area from the circumference of dye-loaded cells (Fig. 1 B) (746 ± 39.1 μm2, n = 19, vs. 1341 ± 70.6 μm2, n = 5; P < 0.001).
In agreement with previously published data (Kato et al., 1996), but in contradiction to a more recent report (Hughes et al., 1998), we further found that β cells of diabetic rats display prominently enhanced voltage-activated Ca2+ currents (VACCs). Similar to that demonstrated in pituitary melanotrophs (Kocmur and Zorec, 1993; Sedej et al., 2004), chromaffin cells (Liu and Misler, 1998), and mouse β cells (Speier et al., 2007), we used ramp depolarizations (−89 to 51 mV, 0.47 mV ms−1) to quickly assess the amplitude and voltage dependence of VACCs. The application of this protocol resulted in the separation of two inward current components, showing peaks around −45 and −5 mV. These peaks most likely correspond to low (LVA) and high (HVA) voltage-activated Ca2+ currents (Hiriart and Matteson, 1988; Sala et al. 1991).
We found that peak HVA Ca2+ influx was almost doubled in GK rat β cells (141 ± 12.5 pA, n = 41, vs. 74 ± 6.8 pA, n = 37, P < 0.001). LVA Ca2+ currents were also prominently increased (55 ± 4.7 pA, n = 41, vs. 21 ± 2.4 pA, n = 37, P < 0.001), thus confirming previous observations (Kato et al., 1996). Considering the increased size of GK rat β cells, we normalized the peak VACC amplitudes to the resting Cm. Both HVA and LVA current densities still were significantly increased in diabetic GK rat β cells (Fig. 1 C, ii). To match Ca2+ entry in control cells with that of GK cells we had to elevate external Ca2+ in the Wistar rat controls to 7 mM.
Glucose Elicits Similar Changes in the Cytosolic [Ca2+] in Healthy and Diabetic Rats
In β cells with intact metabolism, stimulation with glucose induces electrical activity that leads to an increase in [Ca2+]i that in turn triggers insulin secretion (Ashcroft and Rorsman, 1989). To assess to which extent glucose is still able to elicit the triggering Ca2+ signal in GK rats, we monitored glucose-induced changes in [Ca2+]i by ratiometric imaging of Fura-PE3–loaded islets in tissue slices (Fig. 2). In islets of both healthy and diabetic rats, elevation of external glucose to 20 mM led to an increase in [Ca2+]i (response latency ∼50 s) that was monitored as a change in the mean fluorescence intensity ratio of an image area enclosing large parts of the respective islets (Fig. 2 A; see Videos 1–3, available online at http://www.jgp.org/cgi/content/full/jgp.200609604/DC1). The absolute Ca2+-response amplitude expressed as change in the fluorescence ratio showed no significant difference (Wistar: 0.1 ± 0.03, n = 5, vs. GK: 0.1 ± 0.01, n = 4; not significant [n.s.]). In contrast to other reports (Martin et al., 1995; Antunes et al., 2000) but similar to Ahmed and Grapengiesser (2002), we observed oscillatory changes of [Ca2+]i upon glucose stimulation in rat islets. These oscillations were limited to small cell clusters within the islets (Fig. 2 B, gray trace) but could be found in Wistar (not depicted) as well as GK rat islets (see Videos 2 and 3).
Figure 2.

Glucose elicits similar changes in the cytosolic Ca2+ concentration in healthy and diabetic rats. (A) Ratio images of Fura PE3-AM bulk-loaded Wistar (left, also see Video 1) and GK (right, also see Video 3) rat islets before (top images, t = 0 s) and after (bottom images, t = 1,800 s) application of 20 mM glucose (glc). (B) Mean pixel intensity data of ROI1 (black traces) and ROI2 (gray trace) shown in A. Dotted lines indicate the response amplitude.
Exocytosis during Trains of Depolarizing Pulses Is Impaired in Diabetic GK Rat β Cells
Finding no severe impairment in the ability of glucose to increase [Ca2+]i, we needed to address the question of whether Ca2+–secretion coupling itself is impaired in β cells of diabetic rats. Therefore, we applied trains of depolarizing pulses to elicit inward Ca2+ currents and trigger Ca2+-dependent secretion. Similar to that demonstrated previously using Cm measurements (Speier and Rupnik, 2003) or by directly measuring GSIS from isolated β cells (Hiriart and Matteson, 1988), about one third of the β cells did not show evoked exocytosis. To unequivocally tell responsive from unresponsive β cells we therefore used a stimulation consisting of 50 depolarizations of 40-ms duration from −89 to 1 mV at a frequency of 10 Hz. This protocol represents a tradeoff between (a) mimicking low frequency physiological spiking maximal activity ranging between 1 and 5 Hz (see Fig. S3, available at http://www.jgp.org/cgi/content/full/jgp.200609604/DC1; Antunes et al., 2000), (b) providing a stimulus intensity strong enough to lead to sufficient LDCV exocytosis, and (c) being short enough to prevent slow endocytosis from affecting the secretion readout.
In the representative recording of a Wistar rat β-cell shown in Fig. 3 A (i), stimulation with a train of depolarizing pulses led to a steady increase in Cm that reached 172 fF at the end of the stimulation. This corresponded to the release of ∼49 LDCVs, assuming a unitary Cm of 3.5 fF for a rat β-cell LDCV (Cm = ɛ × π × d2, where ɛ is 9 fF μm−2 and d = 348 nm; Straub et al., 2004; MacDonald et al., 2005). β cells of diabetic GK rats were subjected to the same stimulation protocol. The β-cell of the diabetic animal reached a total ΣΔCm of 149 fF (∼43 LDCVs). The quantitative analysis of the data showed that there was no significant difference in the absolute ΣΔCm reached at the end of the train stimulation between Wistar and GK rat β cells (Fig. 3 A, ii). The kinetics of the Cm increase, however, was significantly different between Wistar and GK rat β cells; whereas the average release rate in controls stayed high from the 2nd to the 11th depolarization (59 ± 9 fF s−1, n = 34), GK β cells showed a much slower initial response (33 ± 7 fF s−1, n = 29, P < 0.05). This led to a significantly lower initial ΣΔCm in GK rats (Fig. 3 B). Using elevated external Ca2+ (7 mM) Wistar rat β cells showed a much stronger initial response (196 ± 64 fF s−1, n = 7, P < 0.001; Fig. S1).
Figure 3.

Initial exocytotic response during repetitive stimulation is impaired in β cells of diabetic rats. (A, i) Typical depolarization train–induced changes in Cm (bottom trace) in a β-cell of a Wistar (left) and GK rat (right). (ii) Comparison of the total ΣΔCm reached after the end of the train between β cells of control (open bars) and diabetic (gray bars) animals. (B) Average ΣΔCm during the first 10 pulses of train stimulation of Wistar (closed circles) and GK (open circles) rat β cells. Note the depressed initial release in diabetic β cells. Straight lines represent linear fits through 10 data points starting with ΔCm evoked by pulse #2. (C) Cell size–normalized cumulative increase in Cm during (i) and at the end (ii) of train stimulation (same data as in A). **, P < 0.01; *, P < 0.05, unpaired t test.
The secretory capacity of nondiabetic β cells is positively correlated to the size of the cells (Giordano et al., 1993; Leung et al., 2005). However, if the ΔCm of control and diabetic β cells was normalized to the cell size, the relative amount of exocytosis in GK rat β cells was much smaller throughout the train (Fig. 3 C, i). The size-normalized release after cessation of the last pulse in GK rat β cells was reduced by >50% (Fig. 3 C, ii).
The Secretory Dysfunction in Diabetic β Cells Is Not Caused by Differences in Functional Pool Sizes or Pool Refilling Kinetics
Next we tested whether the depressed secretion in GK rat β cells was due to changes in the size and availability of releasable pools. Because Ca2+ influx is enhanced in GK rat β cells, we used a dual-pulse protocol that allows estimates of pool sizes independently from absolute Ca2+ entry. From the sum (S) and the reverse ratio (R) of the capacitance increases (ΔC 2/ΔC 1) in response to two identical Ca2+ elevations elicited at a short interval, the upper limit of a releasable pool size (B max) can be estimated if the pulses release the same fraction of the available pool of vesicles according to B max = S/(1 – R 2) (Fig. 4 A) (Gillis et al., 1996).
Figure 4.

Functional vesicle pool sizes and RP refilling kinetics are not changed in β cells of diabetic rats. (A, i) Dual-pulse protocols used to estimate the maximal size of RP and IRP in β cells. (Top panels) Inward INa,Ca currents (peak INa transients truncated) and ΣΔCm elicited by depolarizations from −89 to 1 mV (bottom panels). (ii) The maximal RP (left) and IRP (right) size estimates in Wistar and GK rat β cells showed no difference. n.s., unpaired t test. (B) The time course of RP recovery after depletion is also similar in Wistar and GK rat β cells. The ratio of the summed Cm responses (S 2/S 1, see text) in response to two successive dual-pulse stimulations as a function of the delay time between the double pulses is shown for Wistar (closed symbols) and GK rat β cells (open symbols) (data binned for delay times, n.s., unpaired t test). Interpulse intervals have been randomized and at least 30 s between two dual-pulse pairs was allowed to ensure complete recovery of RP. The combined data of Wistar and GK β cells were fitted by a single exponential function (solid line: τ = 5.6 s, y intercept S2/S1 = 0.35).
Similar in chromaffin cells, pituitary melanotrophs, and isolated mouse β cells (Horrigan and Bookman, 1994; Moser and Neher, 1997; Barg et al., 2001; Sedej et al., 2005), depolarizing pulses of duration longer than ∼200 ms depleted a significant fraction of the RP (see Fig. S2). We therefore chose pulse durations of 300 ms with an interpulse interval of 100 ms for the estimation of the maximal size of this pool. To further maximize release in response to the stimulation, [Ca2+]o was increased to 10 mM and the step depolarizations were performed from a holding potential of −89 to −4 mV, a potential close to the peak HVA Ca2+ current influx (Fig. 1 C, i). Using this protocol we achieved a satisfactory depletion ratio of R = 0.58 ± 0.05 (n = 17) for Wistar and R = 0.55 ± 0.05 (n = 9) for GK rats. Only cells with R < 0.7 were taken for analysis, thus excluding 30% of the Wistar and 33% of the GK rat β cells. We found that the maximal RP size in diabetic β cells was the same as in controls (Wistar: 170 ± 38 fF, n = 12, vs. GK: 189 ± 82 fF, n = 6). The Cm response to the first depolarization can be used as an estimate of the lower boundary of RP size (Gillis et al., 1996). With 79 ± 18 fF (n = 12) for Wistar and 95 ± 37 fF (n = 6) for GK rat β cells, again no significant pool size difference was found.
A subfraction of LDCVs from the RP is released rapidly upon short depolarizations in neuroendocrine cells, including β cells (immediately releasable pool [IRP]) (Horrigan and Bookman, 1994). With short pulses (−89 to 1 mV, 40-ms duration, 60-ms interpulse interval) in standard ES (2 mM Ca2+), this pool could be selectively depleted (Fig. 4 A and see Fig. S2). With R = 0.44 (n = 34) for Wistar and R = 0.17 (n = 28) for GK rats, the latter showed a slightly but not significantly higher degree of depression than controls. However, the upper IRP size as estimated with this protocol again was the same in β cells of healthy and diabetic rats (Wistar: 24 ± 5 fF, 26 of 34 cells R < 0.7; GK: 25 ± 3 fF, 23 of 28 cells R < 0.7; n.s.). Also, the minimal IRP size estimated from the Cm response to the first depolarization showed no differences (Wistar: 17 ± 2 fF, n = 26, vs. GK: 19 ± 3 fF, n = 23; n.s.).
Since our data indicates that the steady-state RP sizes of diabetic GK rat β cells are unaltered, the depressed secretion during the train stimulation in GK rats could result from differences in the RP refilling kinetics. We therefore measured the time course of RP refilling by probing the pool size at different times after a pool-depleting stimulus (Fig. 4 B). In the recording shown in Fig. 4 B (i), maximal RP size was assessed by a double-pulse protocol similar to Fig. 4 A. Because of the achieved pool depletion, a subsequent double-pulse following 2.3 s afterwards showed that the RP has only partially recovered. Because the absolute RP size has already been shown to be constant, only the time course of refilling was of interest. Therefore we could use the ratio of the summed Cm responses instead of the absolute Bmax values to represent the relative RP recovery (Dinkelacker et al., 2000). However, using several delay times reaching from 1.2 to 52 s, the refilling kinetics in Wistar and GK rats were almost identical (Fig. 4 B, ii). Interestingly, Wistar and GK rats showed a considerably faster RP recovery (τ = 5.6 s) in comparison to previously reported values for isolated mouse β cells (Gromada et al., 1999; τ = 31 s). It remains to be established whether this discrepancy has to be attributed to species differences or is resulting from differences in the preparation (slice vs. single-cell culture) and stimulus paradigm used.
The Efficacy of Ca2+ to Trigger Secretion Is Reduced in β Cells of GK Rats
To further elucidate defective Ca2+–secretion coupling in β cells of diabetic rats we needed to account for the fact that the triggering Ca2+ signal is prominently enhanced in the GK model (Fig. 5). During train stimulation, both Ca2+ charge entry as well as the size-normalized charge density were significantly higher for each of the single depolarization pulses of standard train stimulation (Fig. 5 B). In the cells shown in Fig. 5 A, this led to an increase in the global cytosolic [Ca2+]i that reached a stable level after ∼2 s. Whereas the Wistar rat β-cell showed an increase in [Ca2+]i of 200 nM, [Ca2+]i in the diabetic β-cell increased by 460 nM. No significant difference in the buffered resting [Ca2+]i between Wistar and GK rat β cells was found (Wistar: [Ca2+]i = 120 ± 30 nM, n = 9, vs. GK: [Ca2+]i = 130 ± 20 nM, n = 5).
Figure 5.

Ca2+ influx during train stimulation is higher in GK rat β cells. (A) Depolarization train–evoked change in [Ca2+]i in (i) a Wistar and (ii) a GK rat β-cell measured by ratiometric imaging of cells loaded with 50 μM Fura-PE3. (B, i) Average Ca2+ influx for each depolarization pulse in control (closed symbols, n = 33) and diabetic (open symbols, n = 20) β cells measured as integrated Ca2+ current. (ii) Same as in i but normalized to the cell size (unpaired t test).
Furthermore, Fig. 5 B shows that the Ca2+ charge entry during train stimulation displays prominent inactivation. In Wistar as well as GK rat β cells the first pulse elicited ∼100% more charge entry than the 50th depolarization in the train. The inactivating Ca2+ charge entry and not the relatively uniform increase in global cytosolic [Ca2+]i is more likely to represent the submembrane [Ca2+]i relevant for fast LDCV release (Neher, 1998). To compare the secretory activity with respect to the actual stimulus intensity we therefore correlated the cumulative Cm change during train stimulation to the cumulative Ca2+ charge entry (ΣΔQCa). Fig. 6 A shows, that whereas ΣΔCm in the representative GK β-cell was higher than in control (422 fF vs. 217 fF), Ca2+ entry was more than doubled as well (268 pC vs. 111 pC). This led to a relative secretory efficacy (ΣΔCm / ΣΔQCa) of 2 fF pC−1 in the Wistar and 1.6 fF pC−1 in the GK rat β cells.
Figure 6.

Sensitivity to stimulus-evoked Ca2+ influx is decreased in a PKC-dependent manner in β cells of diabetic GK rats. (A) Cm traces from depolarization train–stimulated β cells of Wistar (top left) and GK (bottom left) rats. The respective I Na,Ca resulting from the 1st (black traces) and 50th (gray traces) depolarization are shown below. The right panels show the ΣΔCm of the same cells plotted against the cumulative Ca2+ current integrals (ΣQCa). Straight lines represent linear fits (ΣΔCm(ΣQCa) = E × ΣQCa) through the first 10 data points. The slope factor E is taken to represent the exocytotic efficacy of Ca2+ influx to trigger LDCV secretion. (B) Average Ca2+–exocytosis relationship during pulse trains in Wistar (closed circles) and GK rat (open circles) β cells. For clarity, error bars are only shown for every 10th data point. (C) Comparison of E during train stimulation between Wistar (open bars) and GK (gray bars) β cells. The same protocol was repeated for Wistar β cells superfused with PMA and GK β cells treated with BIS (hatched bars) and PKC 19-31 (crossed bar). **, P < 0.01; *, P < 0.05, unpaired t test.
It turned out that for approximately up to the 10th pulse, a linear function well describes the data regardless of the inherent variability due to nonlinear increases (facilitation) or decreases (depression) in exocytotic efficacy at very early or later phases of train stimulation, which can lead to deviations from this linear relation (Fig. 6 B). Furthermore, as demonstrated before (Fig. 3 B), the most prominent impairment of secretory function in GK rat β cells takes place during the first 25 pulses of the stimulation. Therefore we chose the slope of the zero-constrained linear fit as the parameter to represent secretory efficacy (E) in our experiments.
Fig. 6 B shows the average ΣΔCm as a function of ΣΔQCa for Wistar and GK β cells. Clearly, β cells from healthy rats responded to any given amount of Ca2+ entering during the train stimulation with a higher number of secreted vesicles leading to an average secretion of 161 ± 39 fF in response to a cumulative Ca2+ entry of 125 ± 19 pC (n = 22). With 196 ± 45 fF (n = 15), the total secretion after train cessation in GK rat β cells again was not significantly different from controls, but the corresponding total Ca2+ entry was much higher (243 ± 35 pC, n = 14, P < 0.001). Ca2+ in controls was almost twice as efficient in triggering secretion as in GK β cells (E = 1.5 ± 0.2 fF pC−1, n = 22, vs. E = 0.9 ± 0.1 fF pC−1, n = 15, P < 0.01).
Surprisingly, broad-spectrum inhibition of PKC by either BIS, a potent multi-isoform inhibitor of PKC (Toullec et al., 1991), or the structurally unrelated pseudosubstrate PKC inhibitory peptide PKC 19-31 (House and Kemp, 1987) restored secretory efficacy in GK rats. 500 nM BIS, applied in the extracellular and in the pipette solution, elevated E in GK β cells to the level of Wistar controls (E = 1.8 ± 0.6 fF pC−1, n = 6, P < 0.05). Similarly, also cell dialysis for 3 min with 10 μM PKC 19-31 added to the pipette solution (Nagy et al. 2002) increased the efficacy of Ca2+ to trigger secretion to E = 1.7 ± 0.4 fF pC−1 (n = 9, P < 0.05) in GK rat β cells. Acute stimulation of control cells with a potent PKC activator (PMA), however, did not yield the opposite result, as 100 nM PMA added to the superfusing ES of control β cells 5 min before and also during the experiment slightly but not significantly enhanced E to 2.1 ± 0.3 fF pC−1 (n = 21). Phorbol esters in isolated mouse β cells have been reported to decrease VACCs, whereas PKC inhibition has been reported to enhance Ca2+ currents (Zhang et al., 2004). However, application of neither of the pharmacological agents had a significant effect on the total ΣΔQCa reached after train stimulation compared with the untreated group (Wistar + PMA: 125 ± 16 pC, n = 22, n.s.; GK + BIS: 166 ± 38 pC, n = 11, n.s.; GK + PKC 19–31: 183 ± 35 pC, n = 12, n.s.).
Repetitive Train Stimulation Leads to an Increase in Exocytotic Efficacy in Diabetic GK Rat β Cells
Next we needed to answer the question of how a decreased exocytotic efficacy in GK rat β cells relates to the published reports that insulin release in response to strongly depolarizing nonnutrient stimuli is not impaired and in some cases is even higher in GK rats than in healthy control (Giroix et al., 1983; Abdel-Halim et al., 1996). Many neuroendocrine and synaptic preparations respond to intense stimulation with a short- to long-term enhancement of their secretory efficacy (Smith, 1999; Zucker and Regehr, 2002). We therefore tested if a similar form of facilitation could explain the exaggerated nonnutrient stimulated secretion of GK rats.
If we applied two identical trains of depolarizations (2 × 50 pulses, 10 Hz) the secretory response to the second stimulation 4 min after the first was markedly different between healthy and diabetic β cells (Fig. 7). Whereas ΣΔCm in the control β-cell shown in Fig. 7 A was decreased during the second stimulation, the GK β-cell demonstrated a clear increase in its secretory capacity. Fig. 7 B shows two further β cells in which ΣΔCm is related to the respective stimulus intensity. ΣQCa elicited by the second train is reduced in both cases due to Ca2+ current rundown. In controls, E stayed constant in spite of reduced charge entry (first train: E = 0.95 fF pC−1 vs. second train: E = 0.87 fF pC−1). However, in the diabetic β-cell, E was higher throughout the second train, almost reaching a value similar to that of Wistar cells (first train: E = 0.6 fF pC−1, second train: E = 1.0 fF pC−1).
Figure 7.

GK rat β cells show PKC-mediated activity-dependent facilitation of release. (A) ΣΔCm in response to two successive depolarization trains (interstimulus interval, 4 min) in a Wistar (top panel) and GK (bottom panel) β-cell. (B) ΣΔCm of two further individual Wistar and GK β cells as a function of ΣQCa. Straight lines represent linear fits through the first 10 data points of the first (solid) and second (dashed) stimulus train. (C) Averaged ΣΔCm during repetitive train stimulation of Wistar and GK β cells. (D) Total ΣΔCm after the end of the train plotted against the stimulus train number for Wistar (closed circles, n = 8–23) and GK (gray triangles, n = 11–25) β cells. Additionally, ΣΔCm for Wistar β cells perifused with 7 mM Ca2+ is shown (open circles, n = 4). Asterisks indicate differences (*, P < 0.05, unpaired t test) between ΣΔCm of the GK rat group after each train and the respective Wistar rat control in high and low external Ca2+. (E) E of Wistar and GK β cells in the absence and presence of PMA, BIS, and PKC 19-31. Only paired groups of the same category (second vs. first train controls) were tested for statistical significance. **, P < 0.01, paired t test.
On average, total ΣΔCm in controls was significantly lower after the second train than after the first (219 ± 42 fF vs. 120 ± 45 fF, n = 23, P < 0.01, paired t test). In GK β cells, the same stimulation led to a small, albeit not significant, increase in ΣΔCm (229 ± 38 fF vs. 266 ± 46 fF, n = 25) (Fig. 7 C). This discriminative behavior occurred in spite of a comparable Ca2+ current rundown in Wistar (first train: 122 ± 45 pC vs. second train: 47 ± 37 pC, n = 7, P < 0.01, paired t test) and GK rats (first train: 248 ± 29 pC vs. second train: 152 ± 28 pC, n = 11, P < 0.01, paired t test).
In terms of the secretory efficacy, this means that whereas in controls E stayed relatively constant during repetitive train stimulation (E = 1.7 ± 0.3 fF pC−1 to E = 1.4 ± 0.5 fF pC−1, n = 7, n.s., paired t test), GK β cells displayed significant facilitation (E = 0.8 ± 0.1 fF pC−1 to 1.1 ± 0.2 fF pC−1, n = 10, P < 0.01, paired t test). The effect could not be explained by the increased Ca2+ entry in diabetic β cells because if we elevated external Ca2+ in the controls to 7 mM to match the Ca2+ entry of GK rats (Fig. S1), rundown of ΣΔCm was still present in Wistar β cells (Fig. 7 D). In contrast to the first train, the total release in GK β cells after second or even third stimulation was significantly higher compared with the high and low [Ca2+]o controls.
Similar to that shown in comparable experiments on chromaffin cells (Smith, 1999), the facilitation of release in GK rats could be prevented by blocking PKC activity (Fig. 7 E). Whereas untreated GK rat β cells showed a robust increase in secretory efficacy, there was no facilitation visible during the second train stimulation in the presence of 500 nM BIS or 10 μM PKC 19-31. Again, activation of PKC in Wistar rat controls by PMA did not significantly change E, neither for the first nor for the second stimulation.
DISCUSSION
It has been suggested that the primary lesion in GK rats is defective glucose metabolism leading to an impaired insulin secretion, whereas the secretory machinery itself is not affected directly (Katayama et al., 1995; Abdel-Halim et al., 1996). Here, we demonstrate that in spite of putatively compensatory mechanisms like increased Ca2+ influx and increased cell size, the most distal steps of stimulus–secretion coupling in diabetic β cells in tissue slices in fact are impaired.
β-Cell Hypertrophy and Ca2+ Homeostasis
Whereas upregulation of VACCs has previously (although not consequently, see Hughes et al. 1998) been reported using cultured GK rat β cells (Kato et al., 1996), we additionally found that diabetic β cells in fresh slices are significantly hypertrophic. As secretory capacity of single β cells is positively correlated to the cell size (Giordano et al., 1993), β-cell hypertrophy is generally believed to enhance secretion to cope with the increased secretory demand during hyperglycemia (Bonner-Weir et al., 1989). Short- to long-term increases in β-cell size in response to short- or long-term hyperglycemia have been demonstrated repeatedly in both lean and obese rats (Hayek and Woodside, 1979; Bonner-Weir et al., 1989). Our data describing a significant increase in surface area in GK rat β cells is close to the range of the 20–40% hypertrophy previously reported for obese fa/fa rats (Chan et al., 1999, 2002). In mice, prominent cell size differences between isolated and cultured β cells and β cells in tissue slices have been observed (Speier et al., 2005). It is likely that neither Kato et al. (1996) nor Hughes et al. (1998) reported different resting Cm values between isolated diabetic and nondiabetic cells because any original size difference would have already been masked by the culturing effect on cell size.
We demonstrate here that [Ca2+]i measurements can readily be performed in rat pancreatic tissue slices. It is reasonable to assume that impaired glucose metabolism would lead to a decrease in the total amount of glucose-stimulated Ca2+ influx. However, similar to Zaitsev et al. (1997), we did not observe a difference in the absolute Ca2+ response amplitude between islets of healthy and diabetic rats. By contrast, two further studies reported both kinetic as well as absolute differences in Δ[Ca2+]i using isolated and cultured islets (Kato et al., 1996; Marie et al., 2001). Regardless of the preparation or GK colony used, all studies published so far showed a robust increase in [Ca2+]i upon glucose stimulation. It therefore appears questionable if a reduced ability of glucose to generate the triggering Ca2+ signal is indeed the predominant lesion in diabetic GK rat β cells. The lack of a pronounced impairment of glucose-induced Δ[Ca2+]i rather supports the notion that a defect in late steps of stimulus–secretion coupling is involved in the depressed GSIS in diabetic GK rat β cells (Metz et al., 1999).
Impaired Ca2+–Secretion Coupling
It is well conceivable that both hypertrophy and increased Ca2+ currents in GK β cells represent compensatory measures to overcome a secretory defect. This compensation is clearly not sufficient, because we found the initial release rate during a train of depolarizing pulses to be depressed in diabetic β cells. However, if at the end of a stimulus the amount of LDCV release in GK cells is similar to control cells, how can this defect then relate to the impaired GSIS of this animal model? Very comparable kinetics of ΣΔCm in response to similar train stimulations were observed in adrenal chromaffin cells (Seward and Nowycky, 1996). For this neuroendocrine cell, Seward and Nowycky (1996) showed that the duration of the initially depressed secretion during train stimulation is positively correlated to the stimulus intensity. As stated before, in terms of action potential frequency, glucose-induced electrical activity is a less intense stimulus for the β-cell than the depolarization train used. Therefore, it is reasonable to assume that the secretory defect would be much more pronounced under the more moderate conditions of physiological nutrient stimulation since any decrease in the stimulus intensity would necessarily prolong the initial phase of depressed secretion.
To exclusively study the secretory dysfunction of GK rat β cells and exclude the putatively compensatory effects of hypertrophy and increased Ca2+ influx, we normalized depolarization-evoked secretion to the respective parameters. In contrast to isolated β cells (Hughes et al., 1998), the secretory lesion of diabetic β cells in tissue slices became much more apparent if the Cm response was normalized to the cell size. By monitoring Cm in parallel with Ca2+ charge entry, we found that Wistar β cells were almost twice as efficient as β cells from diabetic rats in conveying the evoked Ca2+ signal to LDCV release. This could principally result from two factors: (1) a change in the Ca2+ sensitivity of the release machinery and/or the complex spatiotemporal propagation of the evoked Ca2+ signal, or (2) a decrease in the number and/or refilling kinetics of release ready LDCVs. Using double-pulse protocols, we obtained estimates of the size of LDCV pools that are in good agreement with previously reported values for isolated Wistar rat β cells (Wan et al., 2004). However, we found no differences in functional pool sizes or kinetics of pool recovery after depletion between healthy and diabetic rats. It is reasonable to assume that the sensitivity of GK rat β cells to depolarization-evoked Ca2+ entry is reduced by changes in the apparent Ca2+ affinity of the release machinery and/or by changes in the spatiotemporal properties of the evoked Ca2+ signal (i.e., internal buffer conditions, diffusion kinetics, and position of LDCVs with respect to open Ca2+ channels; for review see Kits and Mansvelder, 2000). Further experiments allowing a more controlled and uniform increase in [Ca2+]i (i.e., uncaging of Ca2+ from a photolabile chelator) would be needed to precisely distinguish between the last possibilities. However, given that the IRP of LDCVs is generally believed to represent a pool of vesicles experiencing high [Ca2+]i during stimulation by being tightly coupled to Ca2+ channels (Horrigan and Bookman, 1994, Moser and Neher, 1997; Barg et al., 2001), and we found this pool to be unchanged in diabetic GK rats, we argue that at least the gross spatial association of vesicles with Ca2+ channels is not affected.
At first, the finding of unchanged RP pool sizes appears to be inconsistent with the reduced expression of t-SNAREs and Munc13-1/18-1, because in general these proteins are believed to be involved in determining RP size (Sörensen, 2004). However, mutations of SNAP-25 have been shown to directly interfere with Ca2+ sensing (Sörensen et al., 2002), and selective cleavage of SNAP-25 has recently been demonstrated to prominently reduce the Ca2+ sensitivity in neurons (Sakaba et al., 2005). Furthermore, synaptotagmin III is reported to be a high affinity Ca2+ sensor involved in insulin secretion from β cells (Brown et al., 2000; but see Iezzi et al., 2004 for alternative candidate). Accordingly, our findings are in line with the previously shown reduced expression of these proteins in GK rat β cells (Zhang et al., 2002). Coexpression of syntaxin-1A and B together with the α11.2 subunit of the Cav1.2 channel prominently depresses L-type Ca2+ currents (Wiser et al., 1996). Therefore, downregulation of syntaxin-1A in GK rat islets (Nagamatsu et al., 1999; Gaisano et al., 2002; Zhang et al., 2002) might not only be responsible for a secretory dysfunction but also for the upregulation of HVA currents.
Isolated rat β cells exposed to prolonged hyperglycemia have recently been reported to show a decrease in LDCV fusion events that effectively release their peptide cargo while the total number of membrane fusion events is not reduced (Tsuboi et al. 2006). If this also holds true for GK rats, our Cm measurements could even have underestimated the extent of the secretory defect in GK rat β cells since Cm measurements would still report these “empty” release events.
Nonnutrient Hypersecretion
The central references to which our findings have to be compared are the in vivo and in situ kinetics of insulin release in response to nutrient and nonnutrient stimulation. In this context, our observation of a decreased efficacy of Ca2+ to trigger secretion is challenged by the reported normo- or even hyperresponsiveness to K+ stimulation in GK rats (Abdel-Halim et al., 1996).
Nonetheless, as recently discussed by Kasai et al. (2005), one must take into account that glucose and high [K+]o stimulation exert a very distinct pattern of changes in membrane potential and subsequent increases in [Ca2+]i. Glucose stimulation leads to low- frequency and low-amplitude spiking (Antunes et al., 2000) and bursting electrical activity in rat β cells, resulting in oscillatory changes in [Ca2+]i, while high [K+]o stimulation gives rise to a pronounced plateau-like change in membrane potential and [Ca2+]i (Miura et al., 1997).
Here we report that repetitive strong depolarization with trains of depolarizing pulses leads to PKC-mediated increased LDCV release in diabetic GK rat β cells, whereas under the same conditions the efficacy of Ca2+ to trigger secretion remains unchanged in healthy Wistar rat control (Fig. 7). This intriguing behavior of GK rat β cells is remarkably similar to LDCV secretion from chromaffin cells where a similar stimulation and recording paradigm (repetitive train stimulation and Ca2+ charge-normalized Cm measurements) unravels a PKC- and activity-dependent increase of secretory efficacy after repetitive strong stimulation (Smith, 1999). This facilitation and the analogue phenomenon of “posttetanic potentiation” at neuronal synapses (Zucker and Regehr, 2002) is believed to result from a stimulus-evoked persistent increase in [Ca2+]i that triggers PKC activity and leads to an increase in the size and/or Ca2+ sensitivity of the RP of LDCVs or synaptic vesicels (Smith, 1999; Zucker and Regehr, 2002).
This mechanism of activity-dependent increase of secretory efficacy provides a possible alternative explanation for the previously observed hypersecretion in response to high [K+]o stimulation. A prolonged application of solutions containing a high K+ concentration could lead to tonic elevation of [Ca2+]i and enhancing vesicle replenishment mechanisms. Glucose stimulation, in turn, provides more moderate stimulus and fails to sufficiently elevate [Ca2+]i to activate the facilitatory mechanism.
Role of PKC
Several PKC isoenzymes are expressed in pancreatic β cells and it is known that PKC activation is important for the regulation of GSIS (Arkhammar et al., 1989; Jones and Persaud, 1998). The precise role of PKC-family proteins in β-cell physiology, however, is still controversial (Carpenter et al., 2004). Recently, it was demonstrated that several PKC isoenzymes show an abnormal pattern of expression and glucose-stimulated activation in β cells of diabetic GK rats (Warwar et al., 2006). Most PKC isoenzymes display decreased expression in diabetic β cells and are not activated by glucose stimulation. The “novel” isoenzyme PKCɛ, however, shows an unusually high expression level in GK rat β cells but also lacks glucose activation (Warwar et al., 2006). The secretory anomalies of diabetic GK rat β cells that we describe here appear to be dependent on enhanced PKC activity; broad-range inhibition of PKC isoenzymes by BIS or the structurally unrelated pseudosubstrate PKC inhibitory peptide PKC 19-31 both increased the exocytotic efficacy of Ca2+ to trigger secretion and inhibited the activity-dependent facilitation in GK rat β cells.
In general, studies reporting enhanced depolarization-induced secretion upon PKC inhibition are scarce (see Wu and Wu, 2001). By contrast, PKC activation was reported to result in enhanced exocytosis in many different preparations (Gillis et al., 1996; Hori et al., 1999). β-cell secretion, however, was repeatedly shown to be both inhibited as well as stimulated by PKC activation. Several reports in which glucose and K+-stimulated insulin release from rat β cells were measured demonstrated that inhibition of PKC results in a transient increase of exocytotic efficacy (first phase of insulin release). In the case of glucose, this is followed by a decrease in the sustained response (second phase of insulin release) to the sugar (Zawalich et al., 1991, 1998; Zawalich and Zawalich, 2001; Zhang et al., 2004). First phase GSIS is commonly attributed to the Ca2+-dependent release of a limited pool of LDCVs (Rorsman et al., 2000). Our finding that the decreased secretory efficacy of GK rat β cells can be significantly ameliorated by blocking PKC is thus in line with the notion of increased first phase release due to PKC inhibition.
Why then does PMA application in our hands not mimic the GK rat phenotype? One possibility is that the relative lack of specificity of PMA treatment on PKC activation results in a stimulation of secretion that is not dependent on kinase activity but on other effectors of phorbol esters such as Munc 13-1 (Betz et al., 1998). Thus, an inhibitory action of PKC in Wistar rats could have been masked by an enhanced priming rate resulting from Munc 13-1 activation (Sheu et al., 2003). The unusual expression pattern of PKCɛ in GK rat β cells (Warwar et al., 2006) suggests a further possibility. If the phenotype we observed in GK rats was due to the selective upregulation of a specific PKC isoenzyme, phorbol ester application in controls would not be expected to mimic the diabetic phenotype. Rather, PKC stimulation by PMA would activate multiple PKC isoenzymes of potentially opposing effects (Song et al., 2002). A further hint for a possible selective upregulation of the PKCɛ isoform in GK rat β cells comes from the recent observation in adrenal chromaffin cells that the analogue phenomenon to the activity-dependent facilitation of LDCV release we observe in diabetic β cells is critically dependent on the action of PKCɛ (Park et al., 2006).
To fully answer the question of a possible role of specific PKC isoenzymes in the secretory lesion of diabetic GK rat β cells was beyond the scope of the current report and awaits further studies. However, it is tempting to speculate that in T2D, enhanced PKC activity might not only participate in desensitizing the peripheral tissues to insulin (Inoguchi et al., 1992; Avignon et al., 1996; Clark et al., 2001; Idris et al., 2001) but might also be partly responsible for impaired insulin release.
In conclusion, our data clearly support the notion that events downstream of glucose metabolism are defective in β cells of diabetic GK rats. In agreement with the reported dysregulation of exocytotic proteins in both human and animal T2D, we found that coupling of the depolarization-evoked Ca2+ signal to the release of insulin-containing LDCVs is significantly impaired. So far, however, it is difficult to say if the secretory defect represents a primary lesion in β cells of diabetic GK rats or is the result of the deleterious effects of prolonged β-cell exposure to the prevailing hyperglycemia (Poitout and Robertson, 2002). The pancreatic tissue slice preparation of rat pancreas that we used in the present study is arguably the most acute preparation to date. Since studies using less acute preparations could not show any defect in Ca2+–secretion coupling in this model, one may speculate that glucotoxicity indeed plays an important role; whereas glucotoxic effects could be lost during the time of islet or β-cell isolation and culture, the short preparation time of acute tissue slices offers a method of choice to resolve these phenomena.
Supplemental Material
Acknowledgments
We thank E. Neher for critical reading of an earlier version of the manuscript and valuable suggestions. We also thank Heiko Röhse for excellent technical support.
Part of the work was financed by the Growbeta EU grant (fifth framework, no. QLG1-CT-2001-02233) and Slovenian Research Agency grant J3-7618-2334 (to M. Rupnik). The European Neuroscience Institute Göttingen is jointly funded by the Göttingen University Medical School, the Max-Planck-Society, and Schering AG. T. Rose was supported by the Boehringer Ingelheim Fonds.
Olaf S. Andersen served as editor.
T. Rose's present address is Friedrich Miescher Institute for Bio-medical Research, Maulbeerstraße 66, CH-4058, Basel, Switzerland.
M. Rupnik's present address is Institute of Physiology, Faculty of Medicine, University of Maribor, Slomškov trg 15, 2000 Maribor, Slovenia.
Abbreviations used in this paper: BIS, bisindolylmaleimide I; ES, extracellular solution; GK, Goto Kakizaki; GSIS, glucose-stimulated insulin secretion; HVA, high-voltage activated; IRP, immediately releasable pool; LDCV, large dense-core vesicle; LVA, low-voltage activated; n.s., not significant; RP, release-ready pool; SNARE, N-ethylmaleimide–sensitive factor attachment protein receptor; T2D, type-2 diabetes; VACC, voltage-activated Ca2+ current.
References
- Abdel-Halim, S.M., A. Guenifi, A. Khan, O. Larsson, P.O. Berggren, C.G. Ostenson, and S. Efendic. 1996. Impaired coupling of glucose signal to the exocytotic machinery in diabetic GK rats: a defect ameliorated by cAMP. Diabetes. 45:934–940. [DOI] [PubMed] [Google Scholar]
- Ahmed, M., and E. Grapengiesser. 2002. Ca2+ handling of rat pancreatic β cells exposed to ryanodine, caffeine, and glucagon. Endocrine. 17:103–108. [DOI] [PubMed] [Google Scholar]
- Antunes, C.M., A.P. Salgado, L.M. Rosario, and R.M. Santos. 2000. Differential patterns of glucose-induced electrical activity and intracellular calcium responses in single mouse and rat pancreatic islets. Diabetes. 49:2028–2038. [DOI] [PubMed] [Google Scholar]
- Arkhammar, P., T. Nilsson, M. Welsh, N. Welsh, and P.O. Berggren. 1989. Effects of protein kinase C activation on the regulation of the stimulus-secretion coupling in pancreatic β cells. Biochem. J. 264:207–215. [DOI] [PMC free article] [PubMed] [Google Scholar]
- Ashcroft, F.M., and P. Rorsman. 1989. Electrophysiology of the pancreatic β-cell. Prog. Biophys. Mol. Biol. 54:87–143. [DOI] [PubMed] [Google Scholar]
- Ashcroft, S.J., L.C. Weerasinghe, and P.J. Randle. 1973. Interrelationship of islet metabolism, adenosine triphosphate content and insulin release. Biochem. J. 132:223–231. [DOI] [PMC free article] [PubMed] [Google Scholar]
- Avignon, A., K. Yamada, X. Zhou, B. Spencer, O. Cardona, S. Saba-Siddique, L. Galloway, M.L. Standaert, and R.V. Farese. 1996. Chronic activation of protein kinase C in soleus muscles and other tissues of insulin-resistant type II diabetic Goto-Kakizaki (GK), obese/aged, and obese/Zucker rats. A mechanism for inhibiting glycogen synthesis. Diabetes. 45:1396–1404. [DOI] [PubMed] [Google Scholar]
- Barg, S., X. Ma, L. Eliasson, J. Galvanovskis, S.O. Gopel, S. Obermuller, J. Platzer, E. Renstrom, M. Trus, D. Atlas, et al. 2001. Fast exocytosis with few Ca2+ channels in insulin-secreting mouse pancreatic B cells. Biophys. J. 81:3308–3323. [DOI] [PMC free article] [PubMed] [Google Scholar]
- Barry, P. 1994. JPCalc, a software package for calculating liquid junction potential corrections in patch-clamp, intracellular, epithelial and bilayer measurements and for correcting junction potential measurements. J. Neurosci. Methods. 51:107–116. [DOI] [PubMed] [Google Scholar]
- Bergman, R.N., M. Ader, K. Huecking, and G. Van Citters. 2002. Accurate assessment of β-cell function: the hyperbolic correction. Diabetes. 51(Suppl. 1):S212–S220. [DOI] [PubMed] [Google Scholar]
- Betz, A., U. Ashery, M. Rickmann, I. Augustin, E. Neher, T.C. Südhof, J. Rettig, and N. Brose. 1998. Munc13-1 is a presynaptic phorbol ester receptor that enhances neurotransmitter release. Neuron. 21:123–136. [DOI] [PubMed] [Google Scholar]
- Bonner-Weir, S., D. Deery, J.L. Leahy, and G.C. Weir. 1989. Compensatory growth of pancreatic β cells in adult rats after short-term glucose infusion. Diabetes. 38:49–53. [DOI] [PubMed] [Google Scholar]
- Brown, H., B. Meister, J. Deeney, B.E. Corkey, S.N. Yang, O. Larsson, C.J. Rhodes, S. Seino, P.O. Berggren, and G. Fried. 2000. Synaptotagmin III isoform is compartmentalized in pancreatic β cells and has a functional role in exocytosis. Diabetes. 49:383–391. [DOI] [PubMed] [Google Scholar]
- Carpenter, L., C.J. Mitchell, Z.Z. Xu, P. Poronnik, G.W. Both, and T.J. Biden. 2004. PKCα is activated but not required during glucose-induced insulin secretion from rat pancreatic islets. Diabetes. 53:53–60. [DOI] [PubMed] [Google Scholar]
- Chan, C.B., R.M. MacPhail, L. Sheu, M.B. Wheeler, and H.Y. Gaisano. 1999. β-cell hypertrophy in fa/fa rats is associated with basal glucose hypersensitivity and reduced SNARE protein expression. Diabetes. 48:997–1005. [DOI] [PubMed] [Google Scholar]
- Chan, C.B., M.C. Saleh, A. Purje, and R.M. MacPhail. 2002. Glucose-inducible hypertrophy and suppression of anion efflux in rat β cells. J. Endocrinol. 173:45–52. [DOI] [PubMed] [Google Scholar]
- Clark, A., L.C. Jones, E. de Koning, B.C. Hansen, and D.R. Matthews. 2001. Decreased insulin secretion in type 2 diabetes: a problem of cellular mass or function? Diabetes. 50(Suppl. 1):S169–S171. [DOI] [PubMed] [Google Scholar]
- Dinkelacker, V., T. Voets, E. Neher, and T. Moser. 2000. The readily releasable pool of vesicles in chromaffin cells is replenished in a temperature-dependent manner and transiently overfills at 37°C. J. Neurosci. 20:8377–8383. [DOI] [PMC free article] [PubMed] [Google Scholar]
- Gaisano, H.Y., C.G. Ostenson, L. Sheu, M.B. Wheeler, and S. Efendic. 2002. Abnormal expression of pancreatic islet exocytotic soluble N-ethylmaleimide-sensitive factor attachment protein receptors in Goto-Kakizaki rats is partially restored by phlorizin treatment and accentuated by high glucose treatment. Endocrinology. 143:4218–4226. [DOI] [PubMed] [Google Scholar]
- Gerich, J.E. 2002. Is reduced first-phase insulin release the earliest detectable abnormality in individuals destined to develop type 2 diabetes? Diabetes. 51(Suppl. 1):S117–S121. [DOI] [PubMed] [Google Scholar]
- Gillis, K.D., R. Mossner, and E. Neher. 1996. Protein kinase C enhances exocytosis from chromaffin cells by increasing the size of the readily releasable pool of secretory granules. Neuron. 16:1209–1220. [DOI] [PubMed] [Google Scholar]
- Giordano, E., V. Cirulli, D. Bosco, D. Rouiller, P. Halban, and P. Meda. 1993. B-cell size influences glucose-stimulated insulin secretion. Am. J. Physiol. 265:C358–C364. [DOI] [PubMed] [Google Scholar]
- Giroix, M.H., B. Portha, M. Kergoat, D. Bailbe, and L. Picon. 1983. Glucose insensitivity and amino-acid hypersensitivity of insulin release in rats with non-insulin-dependent diabetes. A study with the perfused pancreas. Diabetes. 32:445–451. [DOI] [PubMed] [Google Scholar]
- Göpel, S., T. Kanno, S. Barg, J. Galvanovskis, and P. Rorsman. 1999. Voltage-gated and resting membrane currents recorded from β cells in intact mouse pancreatic islets. J. Physiol. 521:717–728. [DOI] [PMC free article] [PubMed] [Google Scholar]
- Goto, Y., M. Kakizaki, and N. Masaki. 1976. Production of spontaneous diabetic rats by repetition of selective breeding. Tohoku J. Exp. Med. 119:85–90. [DOI] [PubMed] [Google Scholar]
- Gromada, J., M. Hoy, E. Renstrom, K. Bokvist, L. Eliasson, S. Gopel, and P. Rorsman. 1999. CaM kinase II-dependent mobilization of secretory granules underlies acetylcholine-induced stimulation of exocytosis in mouse pancreatic B cells. J. Physiol. 518:745–759. [DOI] [PMC free article] [PubMed] [Google Scholar]
- Grynkiewicz, G., M. Poenie, and R.Y. Tsien. 1985. A new generation of Ca2+ indicators with greatly improved fluorescence properties. J. Biol. Chem. 260:3440–3450. [PubMed] [Google Scholar]
- Guenifi, A., S.M. Abdel-Halim, A. Hoog, S. Falkmer, and C.G. Ostenson. 1995. Preserved β-cell density in the endocrine pancreas of young, spontaneously diabetic Goto-Kakizaki (GK) rats. Pancreas. 10:148–153. [DOI] [PubMed] [Google Scholar]
- Hayek, A., and W. Woodside. 1979. Correlation between morphology and function in isolated islets of the Zucker rat. Diabetes. 28:565–569. [DOI] [PubMed] [Google Scholar]
- Hiriart, M., and D.R. Matteson. 1988. Na channels and two types of Ca channels in rat pancreatic B cells identified with the reverse hemolytic plaque assay. J. Gen. Physiol. 91:617–639. [DOI] [PMC free article] [PubMed] [Google Scholar]
- Hori, T., Y. Takai, and T. Takahashi. 1999. Presynaptic mechanism for phorbol ester-induced synaptic potentiation. J. Neurosci. 19:7262–7267. [DOI] [PMC free article] [PubMed] [Google Scholar]
- Horrigan, F.T., and R.J. Bookman. 1994. Releasable pools and the kinetics of exocytosis in adrenal chromaffin cells. Neuron. 13:1119–1129. [DOI] [PubMed] [Google Scholar]
- House, C., and E. Kemp. 1987. Protein kinase C contains a pseudosubstrate prototope in its regulatory domain. Science. 238:1726–1728. [DOI] [PubMed] [Google Scholar]
- Hughes, S.J., M. Faehling, C.W. Thorneley, P. Proks, F.M. Ashcroft, and P.A. Smith. 1998. Electrophysiological and metabolic characterization of single β cells and islets from diabetic GK rats. Diabetes. 47:73–81. [DOI] [PubMed] [Google Scholar]
- Idris, I., S. Gray, and R. Donnelly. 2001. Protein kinase C activation: isozyme-specific effects on metabolism and cardiovascular complications in diabetes. Diabetologia. 44:659–673. [DOI] [PubMed] [Google Scholar]
- Iezzi, M., G. Kouri, M. Fukuda, and C.B. Wollheim. 2004. Synaptotagmin V and IX isoforms control Ca2+-dependent insulin exocytosis. J. Cell Sci. 117:3119–3127. [DOI] [PubMed] [Google Scholar]
- Inoguchi, T., R. Battan, E. Handler, J.R. Sportsman, W. Heath, and G.L. King. 1992. Preferential elevation of protein kinase C isoform β II and diacylglycerol levels in the aorta and heart of diabetic rats: differential reversibility to glycemic control by islet cell transplantation. Proc. Natl. Acad. Sci. USA. 89:11059–11063. [DOI] [PMC free article] [PubMed] [Google Scholar]
- Jones, P.M., and S.J. Persaud. 1998. Protein kinases, protein phosphorylation, and the regulation of insulin secretion from pancreatic β cells. Endocr. Rev. 19:429–461. [DOI] [PubMed] [Google Scholar]
- Kasai, K., M. Ohara-Imaizumi, N. Takahashi, S. Mizutani, S. Zhao, T. Kikuta, H. Kasai, S. Nagamatsu, H. Gomi, and T. Izumi. 2005. Rab27a mediates the tight docking of insulin granules onto the plasma membrane during glucose stimulation. J. Clin. Invest. 115:388–396. [DOI] [PMC free article] [PubMed] [Google Scholar]
- Katayama, N., S.J. Hughes, S.J. Persaud, P.M. Jones, and S.L. Howell. 1995. Insulin secretion from islets of GK rats is not impaired after energy generating steps. Mol. Cell. Endocrinol. 111:125–128. [DOI] [PubMed] [Google Scholar]
- Kato, S., H. Ishida, Y. Tsuura, K. Tsuji, M. Nishimura, M. Horie, T. Taminato, S. Ikehara, H. Odaka, I. Ikeda, et al. 1996. Alterations in basal and glucose-stimulated voltage-dependent Ca2+ channel activities in pancreatic β cells of non-insulin-dependent diabetes mellitus GK rats. J. Clin. Invest. 97:2417–2425. [DOI] [PMC free article] [PubMed] [Google Scholar]
- Kits, K.S., and H.D. Mansvelder. 2000. Regulation of exocytosis in neuroendocrine cells: spatial organization of channels and vesicles, stimulus-secretion coupling, calcium buffers and modulation. Brain Res. Brain Res. Rev. 33:78–94. [DOI] [PubMed] [Google Scholar]
- Kocmur, L., and R. Zorec. 1993. A new approach to separation of voltage-activated Ca currents in rat melanotrophs. Pflugers Arch. 425:172–174. [DOI] [PubMed] [Google Scholar]
- Leahy, J.L., S. Bonner-Weir, and G.C. Weir. 1992. β-cell dysfunction induced by chronic hyperglycemia. Current ideas on mechanism of impaired glucose-induced insulin secretion. Diabetes Care. 15:442–455. [DOI] [PubMed] [Google Scholar]
- Leung, Y.M., I. Ahmed, L. Sheu, R.G. Tsushima, N.E. Diamant, M. Hara, and H.Y. Gaisano. 2005. Electrophysiological characterization of pancreatic islet cells in the MIP-GFP mouse. Endocrinology. 146:4766–4775. [DOI] [PubMed] [Google Scholar]
- Liu, J., and S. Misler. 1998. α-Latrotoxin alters spontaneous and depolarization-evoked quantal release from rat adrenal chromaffin cells: evidence for multiple modes of action. J. Neurosci. 18:6113–6125. [DOI] [PMC free article] [PubMed] [Google Scholar]
- Lou, X.L., X. Yu, X.K. Chen, K.L. Duan, L.M. He, A.L. Qu, T. Xu, and Z. Zhou. 2003. Na+ channel inactivation: a comparative study between pancreatic islet β cells and adrenal chromaffin cells in rat. J. Physiol. 548:191–202. [DOI] [PMC free article] [PubMed] [Google Scholar]
- MacDonald, P.E., S. Obermuller, J. Vikman, J. Galvanovskis, P. Rorsman, and L. Eliasson. 2005. Regulated exocytosis and kiss-and-run of synaptic-like microvesicles in INS-1 and primary rat β cells. Diabetes. 54:736–743. [DOI] [PubMed] [Google Scholar]
- Marie, J.C., D. Bailbe, E. Gylfe, and B. Portha. 2001. Defective glucose-dependent cytosolic Ca2+ handling in islets of GK and nSTZ rat models of type 2 diabetes. J. Endocrinol. 169:169–176. [DOI] [PubMed] [Google Scholar]
- Martin, F., J.A. Reig, and B. Soria. 1995. Secretagogue-induced [Ca2+]i changes in single rat pancreatic islets and correlation with simultaneously measured insulin release. J. Mol. Endocrinol. 15:177–185. [DOI] [PubMed] [Google Scholar]
- Metz, S.A., M. Meredith, J. Vadakekalam, M.E. Rabaglia, and A. Kowluru. 1999. A defect late in stimulus-secretion coupling impairs insulin secretion in Goto-Kakizaki diabetic rats. Diabetes. 48:1754–1762. [DOI] [PubMed] [Google Scholar]
- Miura, Y., J.C. Henquin, and P. Gilon. 1997. Emptying of intracellular Ca2+ stores stimulates Ca2+ entry in mouse pancreatic β cells by both direct and indirect mechanisms. J. Physiol. 503:387–398. [DOI] [PMC free article] [PubMed] [Google Scholar]
- Moser, T., and E. Neher. 1997. Rapid exocytosis in single chromaffin cells recorded from mouse adrenal slices. J. Neurosci. 17:2314–2323. [DOI] [PMC free article] [PubMed] [Google Scholar]
- Nagy, G., U. Matti, R.B. Nehring, T. Binz, J. Rettig, E. Neher, and J.B. Sorensen. 2002. Protein kinase C-dependent phosphorylation of synaptosome-associated protein of 25 kDa at Ser187 potentiates vesicle recruitment. J. Neurosci. 22:9278–9286. [DOI] [PMC free article] [PubMed] [Google Scholar]
- Nagamatsu, S., Y. Nakamichi, C. Yamamura, S. Matsushima, T. Watanabe, S. Ozawa, H. Furukawa, and H. Ishida. 1999. Decreased expression of t-SNARE, syntaxin 1, and SNAP-25 in pancreatic β cells is involved in impaired insulin secretion from diabetic GK rat islets: restoration of decreased t-SNARE proteins improves impaired insulin secretion. Diabetes. 48:2367–2373. [DOI] [PubMed] [Google Scholar]
- Neher, E. 1998. Vesicle pools and Ca2+ microdomains: new tools for understanding their roles in neurotransmitter release. Neuron. 20:389–399. [DOI] [PubMed] [Google Scholar]
- Neher, E., and A. Marty. 1982. Discrete changes of cell membrane capacitance observed under conditions of enhanced secretion in bovine adrenal chromaffin cells. Proc. Natl. Acad. Sci. USA. 79:6712–6716. [DOI] [PMC free article] [PubMed] [Google Scholar]
- Ohara-Imaizumi, M., C. Nishiwaki, T. Kikuta, S. Nagai, Y. Nakamichi, and S. Nagamatsu. 2004. a. TIRF imaging of docking and fusion of single insulin granule motion in primary rat pancreatic β cells: different behaviour of granule motion between normal and Goto-Kakizaki diabetic rat β cells. Biochem. J. 381:13–18. [DOI] [PMC free article] [PubMed] [Google Scholar]
- Ohara-Imaizumi, M., C. Nishiwaki, Y. Nakamichi, T. Kikuta, S. Nagai, and S. Nagamatsu. 2004. b. Correlation of syntaxin-1 and SNAP-25 clusters with docking and fusion of insulin granules analysed by total internal reflection fluorescence microscopy. Diabetologia. 47:2200–2207. [DOI] [PubMed] [Google Scholar]
- Okamoto, Y., H. Ishida, Y. Tsuura, K. Yasuda, S. Kato, H. Matsubara, M. Nishimura, N. Mizuno, H. Ikeda, and Y. Seino. 1995. Hyperresponse in calcium-induced insulin release from electrically permeabilized pancreatic islets of diabetics GK rats and its defective augmentation by glucose. Diabetologia. 38:772–778. [DOI] [PubMed] [Google Scholar]
- Ostenson, C.-G. 2000. The Goto-Kakizaki rat. In Animal Models of Diabetes. A.A.F. Sima, and E. Shafrir, editors. Taylor and Francis, London. 197–212.
- Ostenson, C.G., H. Gaisano, L. Sheu, A. Tibell, and T. Bartfai. 2006. Impaired gene and protein expression of exocytotic soluble N-ethylmaleimide attachment protein receptor complex proteins in pancreatic islets of type 2 diabetic patients. Diabetes. 55:435–440. [DOI] [PubMed] [Google Scholar]
- Patton, C., S. Thompson, and D. Epel. 2004. Some precautions in using chelators to buffer metals in biological solutions. Cell Calcium. 35:427–431. [DOI] [PubMed] [Google Scholar]
- Park, Y.S., E.M. Hur, B.H. Choi, E. Kwak, D.J. Jun, S.J. Park, and K.T. Kim. 2006. Involvement of protein kinase C-ɛ in activity-dependent potentiation of large dense-core vesicle exocytosis in chromaffin cells. J. Neurosci. 26:8999–9005. [DOI] [PMC free article] [PubMed] [Google Scholar]
- Pipeleers, D., P.I. in't Veld, E. Maes, and M. Van De Winkel. 1982. Glucose-induced insulin release depends on functional cooperation between islet cells. Proc. Natl. Acad. Sci. USA. 79:7322–7325. [DOI] [PMC free article] [PubMed] [Google Scholar]
- Poitout, V., and R.P. Robertson. 2002. Minireview: secondary β-cell failure in type 2 diabetes–a convergence of glucotoxicity and lipotoxicity. Endocrinology. 143:339–342. [DOI] [PubMed] [Google Scholar]
- Portha, B. 2005. Programmed disorders of β-cell development and function as one cause for type 2 diabetes? The GK rat paradigm. Diabetes Metab. Res. Rev. 21:495–504. [DOI] [PubMed] [Google Scholar]
- Portha, B., P. Serradas, D. Bailbe, K. Suzuki, Y. Goto, and M.H. Giroix. 1991. β-Cell insensitivity to glucose in the GK rat, a spontaneous nonobese model for type II diabetes. Diabetes. 40:486–491. [DOI] [PubMed] [Google Scholar]
- Rorsman, P., L. Eliasson, E. Renstrom, J. Gromada, S. Barg, and S. Göpel. 2000. The cell physiology of biphasic insulin secretion. News Physiol. Sci. 15:72–77. [DOI] [PubMed] [Google Scholar]
- Sakaba, T., A. Stein, R. Jahn, and E. Neher. 2005. Distinct kinetic changes in neurotransmitter release after SNARE protein cleavage. Science. 309:491–494. [DOI] [PubMed] [Google Scholar]
- Sala, S., R.V. Parsey, A.S. Cohen, and D.R. Matteson. 1991. Analysis and use of the perforated patch technique for recording ionic currents in pancreatic beta-cells. J. Membr. Biol. 122:177–187. [DOI] [PubMed] [Google Scholar]
- Sedej, S., T. Tsujimoto, R. Zorec, and M. Rupnik. 2004. Voltage-activated Ca2+ channels and their role in the endocrine function of the pituitary gland in newborn and adult mice. J. Physiol. 555:769–782. [DOI] [PMC free article] [PubMed] [Google Scholar]
- Sedej, S., T. Rose, and M. Rupnik. 2005. cAMP increases Ca2+- dependent exocytosis through both PKA and Epac2 in mouse melanotrophs from pituitary tissue slices. J. Physiol. 567:799–813. [DOI] [PMC free article] [PubMed] [Google Scholar]
- Seward, E.P., and M.C. Nowycky. 1996. Kinetics of stimulus-coupled secretion in dialyzed bovine chromaffin cells in response to trains of depolarizing pulses. J. Neurosci. 16:553–562. [DOI] [PMC free article] [PubMed] [Google Scholar]
- Sheu, L., E.A. Pasyk, J. Ji, X. Huang, X. Gao, F. Varoqueaux, N. Brose, and H.Y. Gaisano. 2003. Regulation of insulin exocytosis by Munc13-1. J. Biol. Chem. 278:27556–27563. [DOI] [PubMed] [Google Scholar]
- Smith, C. 1999. A persistent activity-dependent facilitation in chromaffin cells is caused by Ca2+ activation of protein kinase C. J. Neurosci. 19:589–598. [DOI] [PMC free article] [PubMed] [Google Scholar]
- Song, J.C., P.K. Rangachari, and J.B. Matthews. 2002. Opposing effects of PKCα and PKCɛ on basolateral membrane dynamics in intestinal epithelia. Am. J. Physiol. Cell Physiol. 283:C1548–C1556. [DOI] [PubMed] [Google Scholar]
- Sörensen, J.B. 2004. Formation, stabilisation and fusion of the readily releasable pool of secretory vesicles. Pflugers Arch. 448:347–362. [DOI] [PubMed] [Google Scholar]
- Sörensen, J.B., U. Matti, S.H. Wei, R.B. Nehring, T. Voets, U. Ashery, T. Binz, E. Neher, and J. Rettig. 2002. The SNARE protein SNAP-25 is linked to fast calcium triggering of exocytosis. Proc. Natl. Acad. Sci. USA. 99:1627–1632. [DOI] [PMC free article] [PubMed] [Google Scholar]
- Speier, S., and M. Rupnik. 2003. A novel approach to in situ characterization of pancreatic β cells. Pflugers Arch. 446:553–558. [DOI] [PubMed] [Google Scholar]
- Speier, S., S.B. Yang, K. Sroka, T. Rose, and M. Rupnik. 2005. KATP-channels in β cells in tissue slices are directly modulated by millimolar ATP. Mol. Cell. Endocrinol. 230:51–58. [DOI] [PubMed] [Google Scholar]
- Speier, S., A. Gjinovci, A. Charollais, P. Meda, and M. Rupnik. 2007. Cx-36-mediated coupling reduces β-cell heterogeneity, confines the stimulating glucose concentration range, and affects insulin release kinetics. Diabetes. 56:1078–1086. [DOI] [PubMed] [Google Scholar]
- Straub, S.G., G. Shanmugam, and G.W. Sharp. 2004. Stimulation of insulin release by glucose is associated with an increase in the number of docked granules in the β cells of rat pancreatic islets. Diabetes. 53:3179–3183. [DOI] [PubMed] [Google Scholar]
- Svensson, A.M., C.G. Ostenson, and L. Jansson. 2000. Age-induced changes in pancreatic islet blood flow: evidence for an impaired regulation in diabetic GK rats. Am. J. Physiol. Endocrinol. Metab. 279:E1139–E1144. [DOI] [PubMed] [Google Scholar]
- Toullec, D., P. Pianetti, H. Coste, P. Bellevergue, T. Grand-Perret, M. Ajakane, V. Baudet, P. Boissin, E. Boursier, F. Loriolle, et al. 1991. The bisindolylmaleimide GF 109203X is a potent and selective inhibitor of protein kinase C. J. Biol. Chem. 266:15771–15781. [PubMed] [Google Scholar]
- Tsuboi, T., M.A. Ravier, L.E. Parton, and G.A. Rutter. 2006. Sustained exposure to high glucose concentrations modifies glucose signaling and the mechanics of secretory vesicle fusion in primary rat pancreatic β cells. Diabetes. 55:1057–1065. [DOI] [PubMed] [Google Scholar]
- Vorndran, C., A. Minta, and M. Poenie. 1995. New fluorescent calcium indicators designed for cytosolic retention or measuring calcium near membranes. Biophys. J. 69:2112–2124. [DOI] [PMC free article] [PubMed] [Google Scholar]
- Wan, Q.F., Y. Dong, H. Yang, X. Lou, J. Ding, and T. Xu. 2004. Protein kinase activation increases insulin secretion by sensitizing the secretory machinery to Ca2+. J. Gen. Physiol. 124:653–662. [DOI] [PMC free article] [PubMed] [Google Scholar]
- Warwar, N., S. Efendic, C.G. Ostenson, E.P. Haber, E. Cerasi, and R. Nesher. 2006. Dynamics of glucose-induced localization of PKC isoenzymes in pancreatic β cells: diabetes-related changes in the GK rat. Diabetes. 55:590–599. [DOI] [PubMed] [Google Scholar]
- Wheeler, M.B., L. Sheu, M. Ghai, A. Bouquillon, G. Grondin, U. Weller, A.R. Beaun, M.K. Bennett, W.S. Trimble, and H.Y. Gaisano. 1996. Characterization of SNARE protein expression in β-cell lines and pancreatic islets. Endocrinology. 137:1340–1348. [DOI] [PubMed] [Google Scholar]
- Wiser, O., M.K. Bennett, and D. Atlas. 1996. Functional interaction of syntaxin and SNAP-25 with voltage-sensitive L- and N-type Ca2+ channels. EMBO J. 15:4100–4110. [PMC free article] [PubMed] [Google Scholar]
- Wu, X.S., and L.G. Wu. 2001. Protein kinase c increases the apparent affinity of the release machinery to Ca2+ by enhancing the release machinery downstream of the Ca2+ sensor. J. Neurosci. 21:7928–7936. [DOI] [PMC free article] [PubMed] [Google Scholar]
- Zaitsev, S., I. Efanova, C.G. Ostenson, S. Efendic, and P.O. Berggren. 1997. Delayed Ca2+ response to glucose in diabetic GK rat. Biochem. Biophys. Res. Commun. 239:129–133. [DOI] [PubMed] [Google Scholar]
- Zawalich, W.S., M. Bonnet-Eymard, K.C. Zawalich, and G.C. Yaney. 1998. Chronic exposure to TPA depletes PKCα and augments Ca-dependent insulin secretion from cultured rat islets. Am. J. Physiol. 274:C1388–C1396. [DOI] [PubMed] [Google Scholar]
- Zawalich, W.S., and K.C. Zawalich. 2001. Effects of protein kinase C inhibitors on insulin secretory responses from rodent pancreatic islets. Mol. Cell. Endocrinol. 177:95–105. [DOI] [PubMed] [Google Scholar]
- Zawalich, W.S., K.C. Zawalich, S. Ganesan, R. Calle, and H. Rasmussen. 1991. Influence of staurosporine on glucose-mediated and glucose-conditioned insulin secretion. Biochem. J. 279:807–813. [DOI] [PMC free article] [PubMed] [Google Scholar]
- Zhang, H., M. Nagasawa, S. Yamada, H. Mogami, Y. Suzuki, and I. Kojima. 2004. Bimodal role of conventional protein kinase C in insulin secretion from rat pancreatic β cells. J. Physiol. 561:133–147. [DOI] [PMC free article] [PubMed] [Google Scholar]
- Zhang, W., A. Khan, C.G. Ostenson, P.O. Berggren, S. Efendic, and B. Meister. 2002. Down-regulated expression of exocytotic proteins in pancreatic islets of diabetic GK rats. Biochem. Biophys. Res. Commun. 291:1038–1044. [DOI] [PubMed] [Google Scholar]
- Zucker, R., and W. Regehr. 2002. Short-term synaptic plasticity. Annu. Rev. Physiol. 64:355–405. [DOI] [PubMed] [Google Scholar]
Associated Data
This section collects any data citations, data availability statements, or supplementary materials included in this article.
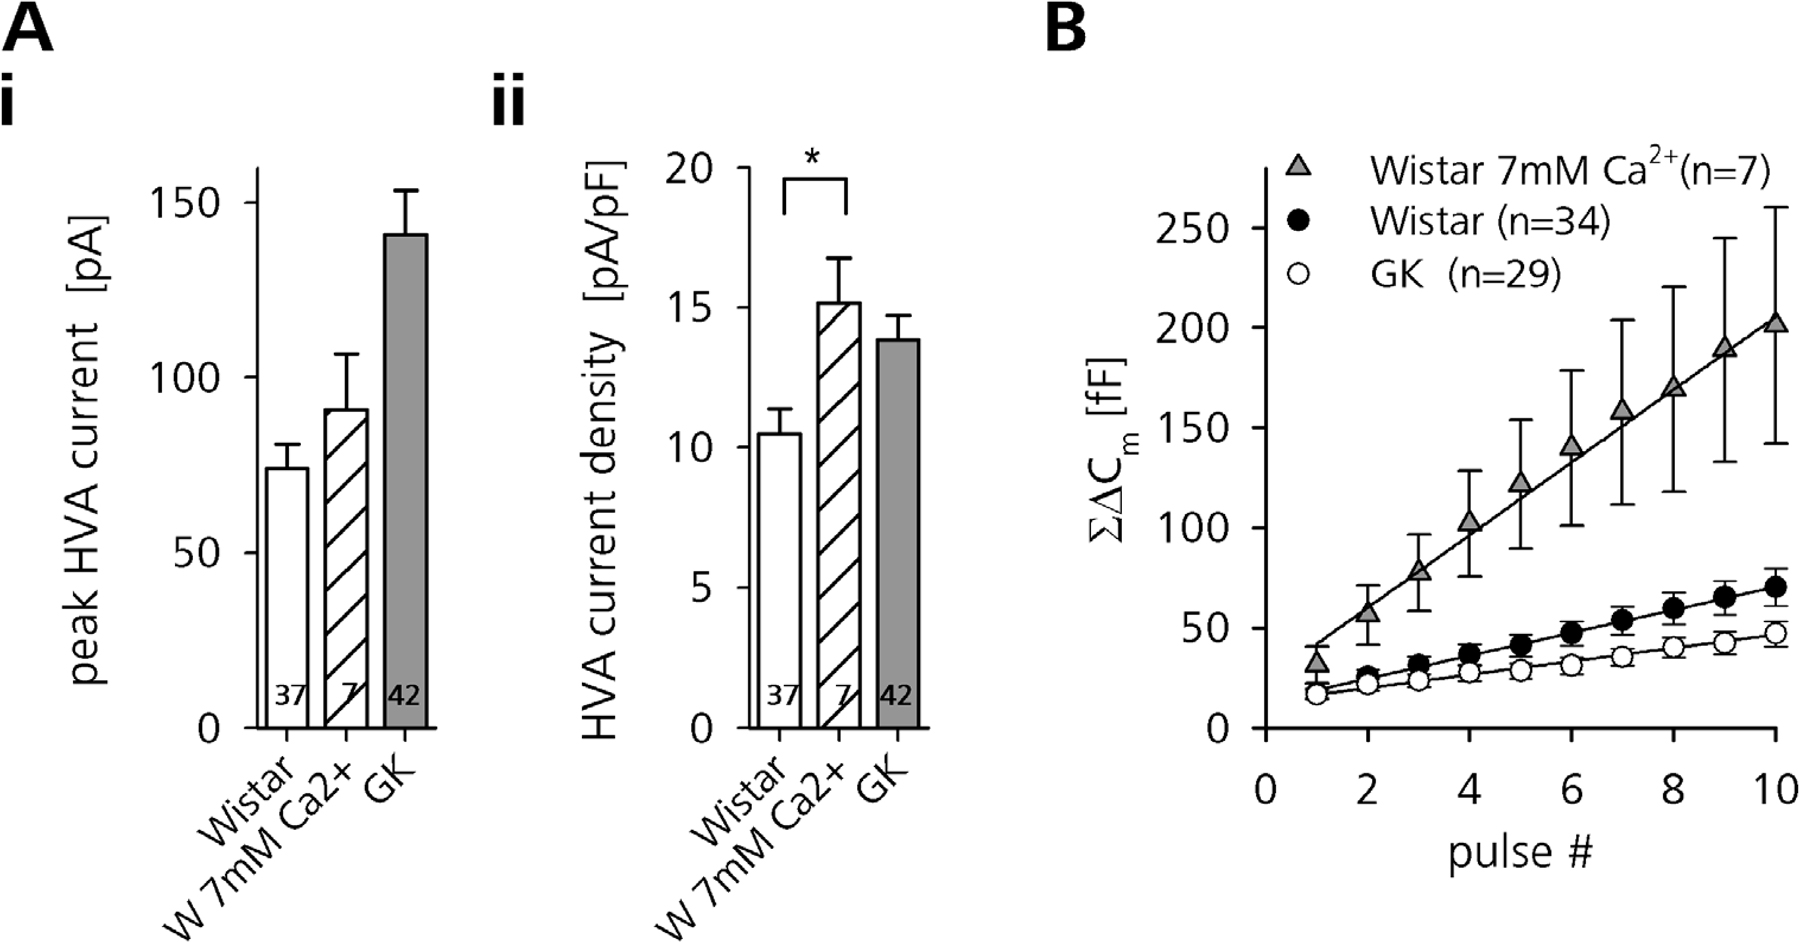
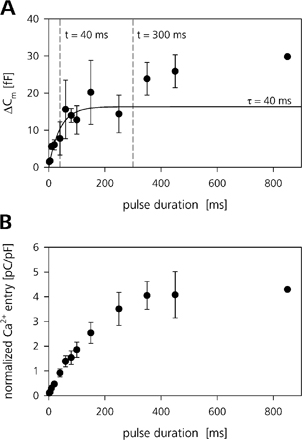
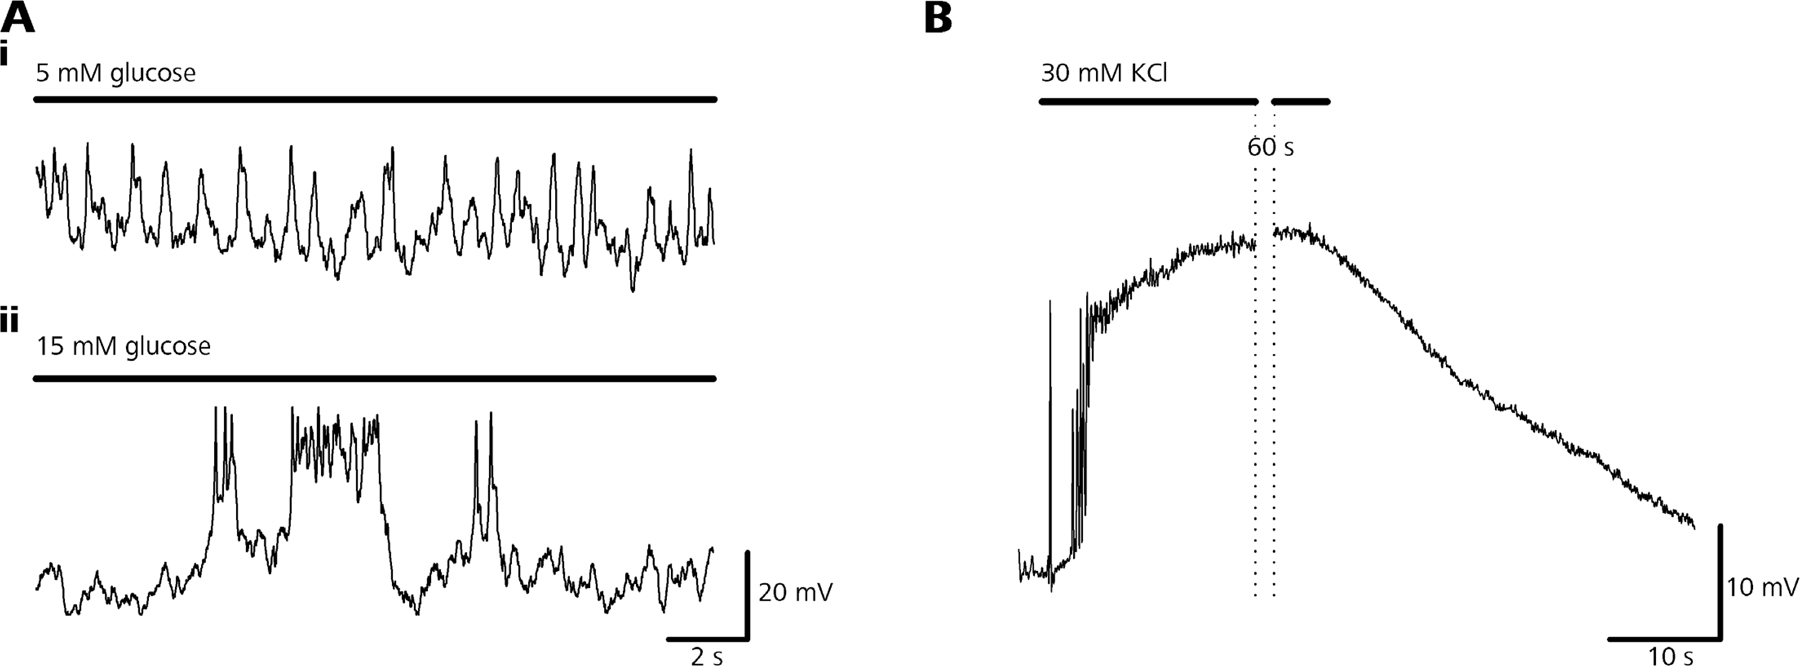