

Abstract
Studies involving pharmacologic inhibition or transient reduction of Group VIA phospholipase A2 (iPLA2β) expression have suggested that it is a housekeeping enzyme that regulates cell 2-lysophosphatidylcholine (LPC) levels, rates of arachidonate incorporation into phospholipids, and degradation of excess phosphatidylcholine (PC). In insulin-secreting islet β-cells and some other cells, in contrast, iPLA2β signaling functions have been proposed. Using retroviral vectors, we prepared clonal INS-1 β-cell lines in which iPLA2β expression is stably suppressed by small interfering RNA. Two such iPLA2β knockdown (iPLA2β-KD) cell lines express less than 20% of the iPLA2β of control INS-1 cell lines. The iPLA2β-KD INS-1 cells exhibit impaired insulin secretory responses and reduced proliferation rates. Electrospray ionization mass spectrometric analyses of PC and LPC species that accumulate in INS-1 cells cultured with arachidonic acid suggest that 18:0/20:4-glycerophosphocholine (GPC) synthesis involves sn-2 remodeling to yield 16:0/20:4-GPC and then sn-1 remodeling via a 1-lyso/20:4-GPC intermediate. Electrospray ionization mass spectrometric analyses also indicate that the PC and LPC content and composition of iPLA2β-KD and control INS-1 cells are nearly identical, as are the rates of arachidonate incorporation into PC and the composition and remodeling of other phospholipid classes. These findings indicate that iPLA2β plays signaling or effector roles in β-cell secretion and proliferation but that stable suppression of its expression does not affect β-cell GPC lipid content or composition even under conditions in which LPC is being actively consumed by conversion to PC. This calls into question the generality of proposed housekeeping functions for iPLA2β in PC homeostasis and remodeling.
Phospholipases A2 (PLA2)2 catalyze hydrolysis of the sn-2 fatty acid substituent from glycerophospholipid substrates to yield a free fatty acid (e.g. arachidonic acid) and a 2-lysophospholipid (1, 2) that have intrinsic mediator functions (3, 4) and can initiate synthesis of other mediators (5). Arachidonic acid, for example, is converted to prostaglandins, leukotrienes, and epoxytrienes, and acetylation of 2-lysoplasmanylcholine yields platelet-activating factor (PAF) (5).
Secretory PLA2 (sPLA2) are low molecular weight enzymes that require millimolar [Ca2+] for catalysis and affect inflammation and other processes, and the PAF-acetylhydrolase PLA2 family exhibits substrate specificity for PAF and oxidized phospholipids (1). Of Group IV cytosolic PLA2 (cPLA2) family members (1), cPLA2α was the first identified and prefers substrates with sn-2 arachidonoyl residues, catalyzes arachidonate release for subsequent metabolism, associates with its substrates in membranes upon rises in cytosolic [Ca2+], and is also regulated by phosphorylation (6). There are additional members of the cPLA2 family that arise from separate genes (7–10).
The Group VI PLA2 (iPLA2) enzymes (11–13) do not require Ca2+ for catalysis and are inhibited by a bromoenol lactone (BEL) suicide substrate (14) that does not inhibit sPLA2 or cPLA2 at similar concentrations (14–17). The Group VIA PLA2 (iPLA2β) resides in the cytoplasm of resting cells, but Group VIB PLA2 contains a peroxisomal targeting sequence and is membrane-associated (18, 19). These enzymes belong to a larger class of serine lipases that are encoded by multiple genes (20, 21). The iPLA2β enzymes cloned from various species are 84–88-kDa proteins that contain a GXSXG lipase consensus sequence and eight stretches of a repetitive motif homologous to that in the protein-binding domain of ankyrin (11–13).
It has been proposed that iPLA2β plays housekeeping roles in phospholipid metabolism (22, 23), such as generating lysophospholipid acceptors for incorporating arachidonic acid into phosphatidylcholine (PC) of murine P388D1 macrophage-like cells, based on studies involving reducing iPLA2 activity with BEL or an antisense oligonucleotide, which suppresses [3H]arachidonate incorporation into PC and reduces [3H]lysophosphatidylcholine (LPC) levels (24, 25). Arachidonate incorporation involves a deacylation/reacylation cycle of phospholipid remodeling (26, 27), and the level of LPC is thought to limit the [3H]arachidonic acid incorporation rate into P388D1 cell PC (24, 25).
Another housekeeping function for iPLA2β in PC homeostasis has been proposed from studies of overexpression of CTP:phosphocholine cytidylyltransferase (28, 29), which catalyzes the rate-limiting step in PC synthesis. Cells that overexpress CTP:phosphocholine cytidylyltransferase exhibit increased rates of PC biosynthesis and degradation and little net change in PC levels, suggesting that PC degradation is up-regulated to prevent excess PC accumulation. Increased PC degradation in CTP:phosphocholine cytidylyltransferase-overexpressing cells is prevented by BEL, and iPLA2β protein and activity increase, suggesting that iPLA2β is up-regulated (28, 29).
If general, this could be important, because PC synthesis is involved in regulating the cell cycle and apoptosis (30, 31), but studies involving iPLA2β overexpression give a different perspective on this issue (32, 33). The activity of iPLA2β has been reported to vary with the cell cycle, to be required for proliferative responses in lymphocyte cell lines (34, 35), and to play a role in membrane biogenesis (36).
Many other iPLA2β functions have been proposed (37–50), and the facts that multiple splice variants are differentially expressed among cells and form hetero-oligomers with distinct properties suggest that iPLA2β gene products might have multiple functions (49–51). Proposed functions include signaling in secretion (47, 48, 52–57), and BEL attenuates glucose-induced insulin secretion, arachidonate release, and rises in cytosolic [Ca2+] in pancreatic islet β-cells and insulinoma cells (48, 52–57).
Many cells, including β-cells, express multiple distinct PLA2 enzymes (13, 16, 17, 58–60), which might reflect redundancy or specific functions of individual PLA2. The mechanism-based iPLA2 inhibitor BEL and its enantiomers inhibit iPLA2 at concentrations lower than those required to inhibit sPLA2 or cPLA2 (14–17, 39), and this has been widely exploited to discern potential biological roles for iPLA2 (37–57, 61–63). BEL also inhibits enzymes other than iPLA2β, however, including serine proteases (64) and phosphatidate phosphohydrolase-1 (65), which accounts for some of its biological effects (66). In addition, BEL inhibits Group VIB PLA2 (18) and at least four other serine lipases (20, 21).
The ambiguity of pharmacologic studies with BEL makes manipulating iPLA2β expression by molecular biologic means an attractive alternative to study iPLA2β functions. Transient suppression of iPLA2β activity with antisense oligonucleotides has been useful in monocytemacrophages and vascular myocytes (25, 37, 41, 42, 47), but substantial suppression of expression is not readily achieved in all cells in this way. Insulinoma cell lines experience toxicity from antisense oligonucleotides at concentrations that fail to reduce iPLA2β activity (66).
Physiological roles for PLA2 can also be studied with genetic gain- or loss-of-function manipulations. Transgenic overexpression of iPLA2β in cardiac myocytes indicates a role in ventricular arrhythmias (67), and stable iPLA2β overexpression in insulinoma cells has provided evidence for participation in exocytosis, cell proliferation, and apoptosis (32, 68, 69). Transient suppression of Group VI PLA2 expression has been achieved with small interfering RNA (siRNA) in some cells (48, 59), and we have now prepared stably transfected insulinoma cells in which siRNA directed against iPLA2β mRNA suppresses iPLA2β expression. These cell lines have been used to examine iPLA2β participation in insulin secretion, cell proliferation, and regulation of phospholipid content and composition.
Experimental Procedures
Materials
1-Palmitoyl-2-hydroxy-sn-glycerophosphocholine (16:0-LPC), 18:0-LPC, 1,2-dimyristoyl-sn-glycerophosphocholine (14:0/14:0-GPC), 20:4/20:4-GPC, 18:0/22:6-GPC, and other phospholipids were obtained from Avanti Polar Lipids (Birmingham, AL). (1–20:4, 2-lyso)-GPC was prepared from 20:4/20:4-GPC with phospholipase A2 from Naja naja (Sigma). Arachidonic acid was obtained from Nu-Chek Prep (Elysian, MN); [5,6,8,9,11,12,14,15-3H]arachidonic acid (100 Ci/mmol) was from Amersham Biosciences; BEL ((E)-6-(bromomethylene) tetrahydro-3-(1-naphthalenyl)-2H-pyran-2-one was from Cayman Chemical (Ann Arbor, MI); culture media (PRMI-1066 and Dulbecco's modified Eagle's medium), penicillin, streptomycin, Hanks' balanced salt solution, and l-glutamine were from Invitrogen (Carlsbad, CA); fetal bovine serum was from Hyclone (Logan, UT); Pentex bovine serum albumin (fatty acid-free, fraction V) was from ICN Biomedical (Aurora, OH); ATP, ampicillin, and kanamycin were from Sigma; and forskolin was from Calbiochem. Krebs-Ringer bicarbonate buffer (KRB) contained 25 mm HEPES (pH 7.4), 115 mm NaCl, 24 mm NaHCO3, 5 mm KCl, and 1 mm MgCl2.
Cell Culture
INS-1 insulinoma cells were cultured as described (66, 68) in RPMI 1640 medium. RetroPack PT 67 cells (Clontech) were maintained in Dulbecco's modified Eagle's medium (4.5 mg/ml glucose) containing 10% fetal bovine serum, 4mm l-Gln, 100 units/ml penicillin, and 100 μg/ml streptomycin.
Establishing iPLA2β Knockdown INS-1 Insulinoma Cell Lines Using siRNA (70)
Two hairpin-forming oligonucleotides directed against iPLA2β mRNA were cloned into RNAi-Ready pSIREN Retro-Q as per the manufacturer's protocol (BD Biosciences Clontech). Targeting sequences within the synthetic oligonuceotides are italicized and underlined below. The sequence of the first was gatccAACAGCACAGAGAATGAGGAGTTCAAGAGACTCCTCATTCTCTGTGCTGTTTTTTTTg. The second oligonucleotide was gatccGCCTGAACCAGGTGAACAATTCAAGAGATTGTTACCTGGTTCAGGCTTTTTTg. Constructs that express the siRNAs are pSIREN-iPLA2-1 and pSIREN-iPLA2-2. Retroviruses were packaged in PT67 cells and used to infect INS-1 cells. Cells were selected with 0.4 μg/ml puromycin. A construct that encoded scrambled RNA was used to prepare control INS-1 cell lines.
Analyses of INS-1 Cell iPLA2β mRNA
Northern blots of iPLA2β mRNA were performed as described (71). For quantitative real time reverse transcription-PCR, total RNA was isolated with an RNeasy kit (Qiagen Inc.). The SuperScript First Strand Synthesis System (Invitrogen) was used to synthesize cDNA in 20-μl reactions that contained DNase I-treated total RNA (2 μg). The cDNA product was treated (20 min, 37 °C) with RNase H (2 units; Invitrogen) and heat-inactivated (70 °C for 15 min). A reaction without reverse transcriptase was performed to verify the absence of genomic DNA. PCR amplifications were performed using SYBR Green dye in an ABI 7000 detection system (Applied Biosystems). Product sizes were determined on 3% (w/v) agarose-TAE gels.
Assay of INS-1 Cell iPLA2 Activity
Ca2+-independent PLA2-specific activity was determined in cytosol by monitoring hydrolysis of 16:0/[14C]18:2-GPC [14C]linoleate as measured by TLC and liquid scintillation spectrometry as described (55).
Determination of Insulin Secretion by INS-1 Cells
At confluence, INS-1 cells were detached from T75 flasks, and aliquots (105 cells) were added to 24-well plates. Culture medium was removed the next day, and cells were washed twice in KRB containing 1 mm glucose and 0.1% bovine serum albumin. Cells were preincubated (1 h, 37 °C, under 95% air, 5% CO2), and medium was replaced with KRB containing glucose (3 or 20mm) with or without forskolin (2.5 μm). Cells were incubated (1 h, 37 °C, under 95% air, 5% CO2), and medium was then removed to measure insulin by radioimmunoassay. Secretion was normalized to cell protein measured with Coomassie reagent (Pierce) (72).
Determination of INS-1 Cell Proliferation Rate
One assay used to measure INS-1 cell proliferation rates is based on fluorescence enhancement when CyQuant GR binds to nucleic acids, which reflects the amount of cell DNA (73). Cells were seeded onto 96-well plates (3×10³ cells/well). Medium was removed after 1 or 3 days, and cells were frozen (−20 °C). DNA was measured with a CyQuant assay kit (Molecular Probes, Inc., Eugene, OR) with reference to a standard curve. CyQuant GR solution (200 μl) was added to each well and incubated (5 min, room temperature). Fluorescence was measured on a microplate fluorimeter (excitation, 480 nm; emission, 538 nm). A second assay is based on incorporation of thymidine analog 5-bromo-2′-deoxyurindine (BrdUrd) into DNA in proliferating cells (74). Cells were seeded (104 cells/well) and cultured (3 days) before assay with BrdUrd labeling and an enzyme-linked immunoassay detection kit III (Roche Applied Science).
Extraction INS-1 Cell Phospholipids and Quantitation of Phosphorus
Lipids were extracted (75), and their lipid phosphorus content was measured (76), as described.
Incubation of INS-1 Cells with [3H]Arachidonic Acid
Incorporation studies involved [3H]arachidonic acid addition (final concentration 0.5μCi/ml, 5 nm) to medium and incubation (10–60 min, 37 °C). Cells were washed three times in KRB containing 5.5 mm glucose and 0.1% bovine serum albumin to remove unincorporated [3H]arachidonate. Cell viability exceeded 98% by trypan blue exclusion. [3H]Arachidonate incorporation into phospholipid extracts was then determined by TLC and liquid scintillation spectrometry (66).
Electrospray Ionization Mass Spectrometric Analyses of Glycerophosphocholine Lipids
PC and LPC were analyzed as Li+ adducts by positive ion ESI/MS on a Finnigan (San Jose, CA) TSQ-7000 triple stage quadrupole mass spectrometer with an ESI source controlled by Finnigan ICIS software. Phospholipids were dissolved in methanol/chloroform (2/1, v/v) containing LiOH (10 pmol/μl), infused (1 μl/min) with a Harvard syringe pump, and analyzed as described (77–79). For tandem MS, precursor ions selected in the first quadrupole were accelerated (32–36-eV collision energy) into a chamber containing argon (2.3–2.5 millitorrs) to induce collisionally activated dissociation (CAD), and product ions were analyzed in the final quadrupole. The identities of GPC species were determined from their tandem spectra (77–79), and their quantities were determined relative to the internal standards 14:0/14:0-GPC and 18:0/22:6-GPC by interpolation from a standard curve (66, 80). To quantitate LPC species, constant neutral loss of 59 scanning was performed. The intensity of the ion for the 14:0/14:0-GPC internal standard (m/z 684) was compared with intensities of ions for endogenous 16:0-LPC (m/z 502), 18:1-LPC (m/z 528), 18:0-LPC (m/z 530), and 20:4-LPC (m/z 550). Standard curve studies in which a constant amount of 14:0/14:0-GPC and varied amounts of 16:0-, 18:1-, and 18:0-LPC were added to a series of tubes and analyzed as Li+ adducts by ESI/MS/MS were linear over a wide range that included levels in INS-1 cells.
Incubating INS-1 Cells with Arachidonic Acid to Induce Phospholipid Remodeling
INS-1 cells (1.2 × 10⁶/condition) were cultured in RPMI containing penicillin, streptomycin, fungizone, and gentamicin (0.1% (w/v) each). Cells were then cultured (37 °C) in fresh medium containing no other supplements or containing various concentrations of arachidonic acid (0, 1, 5, 10, 30, or 70 μm). After 0, 6, or 24 h, cells were washed twice with PBS, suspended in homogenization buffer, and disrupted by sonication. Lipids were extracted (75) and analyzed by ESI/MS/MS.
INS-1 Cell Lysophosphatidylcholine Analyses
INS-1 cells were washed twice, resuspended, and incubated (30 min, 37 °C) in KRB containing 5.5mm glucose and 0.1% bovine serum albumin. Cells were then placed in fresh medium, incubated (30 min, 37 °C), washed twice with phosphate-buffered saline, and extracted (75). The aqueous phase contained 150 mm LiCl, and the chloroform phase contained a 14:0/14:0-GPC internal standard. Concentrated extracts were analyzed by silica gel G TLC on heat-activated (30 min, 80 °C) plates with chloroform/methanol/ammonium hydroxide (65/30/0.8) to separate LPC (RF = 0.38), LPE (RF = 0.46), and PC (RF = 0.60). LPC was analyzed by ESI/MS/MS as described (77–79).
ESI/MS(/MS) Analyses of Anionic Phospholipids
Glycerophosphoethanolamine (GPE), glycerophosphoglycerol (GPG), and glycerophosphoinositol (GPI) were analyzed as [M − H]− ions by negative ion ESI/MS(/MS) relative to a 14:0/14:0-GPE internal standard (80), and their tandem spectra were obtained as described (69, 72).
Statistical Analyses
Two groups were compared by Student's t test, and multiple groups were compared by one-way analysis of variance with post hoc Newman-Keul's analyses.
Results
Establishing iPLA2β Knockdown Cell Lines
INS-1 insulinoma cells were infected with retroviral constructs containing inserts that produced either scrambled RNA (control) or siRNA directed against sequences in iPLA2β mRNA. Selection of puromycin-resistant cells resulted in isolation of two clones that had stably incorporated knockdown constructs and expressed less than 20% of the control cell iPLA2β mRNA content when analyzed by Northern blots (Fig. 1A) or by real time PCR (Fig. 1B). The iPLA2β activity in control INS-1 cells was stimulated by 1 mm ATP and inhibited by 10 μm BEL (Fig. 1C), as is iPLA2β activity in islets and other insulinoma cells (13). The iPLA2β knockdown (iPLA2β-KD) cell lines exhibited reduced iPLA2β activity, and the reduction of activity was comparable with that of iPLA2β mRNA. The iPLA2β expression level was a stable property of control and iPLA2β-KD INS-1 cells that persisted on serial passage in culture.
FIGURE 1. Suppression of iPLA2β expression in iPLA2β knockdown INS-1 cells.

INS-1 cell lines were prepared with retroviral vectors containing an insert encoding scrambled RNA (control) or siRNA against iPLA2β mRNA to generate iPLA2β knockdown cell lines, and iPLA2β mRNA was analyzed by Northern blots (A, lane 1, vector control; lane 2, iPLA2β-KD1; lane 3, iPLA2β-KD2; lane 4, parental cells) and real time PCR (B). Activity of iPLA2β (C) was measured without Ca2+ in the presence of EGTA and without (open bars) or with 1 mm ATP alone (cross-hatched bars) or with ATP and 10μm BEL (solid bars). The leftmost bar (B) or set of bars (C) reflects control cells, and the center and rightmost bar or set of bars reflects iPLA2β-KD1 and iPLA2β-KD2 cells, respectively.
Insulin Secretion Is Attenuated in iPLA2β Knockdown Cells
Glucose is the dominant insulin secretagogue, and pancreatic islets and insulinoma cells exhibit greater insulin secretory responses in the presence of forskolin (32, 68). When treated with forskolin (2.5 μm), control INS-1 cells secreted more insulin than either iPLA2β-KD INS-1 cell line (Fig. 2). This effect increased with the medium glucose concentration over the range of 3–20 mm. Reduced insulin secretory responses were observed with both iPLA2β-KD cell lines under all conditions, supporting the proposal that iPLA2β participates in insulin secretion (2, 32, 68).
FIGURE 2. Effects of glucose and the adenylyl cyclase activator forskolin on insulin secretion from iPLA2β knockdown and control INS-1 cells.

Insulin secretion by control, iPLA2β-KD1, and iPLA2β-KD2 INS-1 cells was measured after a 1-h incubation in medium containing 3 or 20mm glucose without or with 2.5 μm forskolin. Mean values ± S.E. (n = 6) normalized to cell protein content are displayed. Values for iPLA2β-KD INS-1 cells were significantly lower (p < 0.05) than control under all conditions.
Cell Proliferation Rate in iPLA2β Knockdown Cells
Pharmacologic inhibition of iPLA2β reduces cell proliferation rates, and iPLA2β overexpression results in increased proliferation (32, 34, 35). It might thus be predicted that iPLA2β-KD cells would proliferate less rapidly than control INS-1 cells. To test this possibility, INS-1 cell proliferation was measured using an indicator that exhibits strong fluorescence enhancement upon association with nucleic acids (73). Identical numbers of INS-1 cells were seeded at time 0, and their growth rates were monitored for 1–3 days. INS-1 iPLA2β-KD lines proliferated at rates that were significantly lower than those for control INS-1 cells (Fig. 3A). Proliferation was also measured by BrdUrd incorporation into DNA (74). INS-1 cells were again seeded in identical numbers at time 0, and the increase in BrdUrd signal was monitored for 3 days. INS-1 iPLA2β-KD lines were again found to proliferate more slowly than control INS-1 cells, and similar results were obtained when seeding was performed at either of two different initial cell densities at time 0 (Fig. 3B).
FIGURE 3. Rates of proliferation of control and iPLA2β knockdown INS-1 cells.
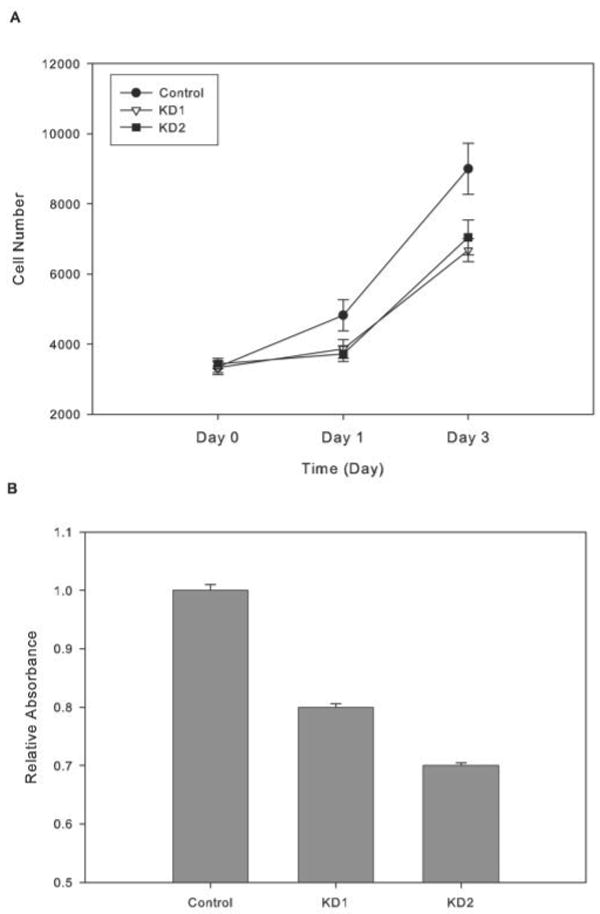
INS-1 cells (0.3 × 10⁶ cells/well) were cultured (37 °C) for various intervals and then detached with trypsin/EGTA solution, and cell number was determined from fluorescence enhancement upon association of CyQuant indicator with DNA (A) or from BrdUrd incorporation (B). Mean values ± S.E. are indicated (n = 6). Values for iPLA2β-KD1 and iPLA2β-KD2 cells were significantly lower (p < 0.05) than control at 1 and 3 days.
Incorporation of [3H]Arachidonic Acid into INS-1 Cell Phospholipids
[3H]arachidonate incorporation in murine macrophage-like P388D1 cells is reduced by pharmacologic inhibition of iPLA2β or by antisense suppression of its expression, suggesting that iPLA2β plays a housekeeping role in phospholipid remodeling (22–25). To determine whether iPLA2β plays this role in β-cells, we compared [3H]arachidonic acid incorporation into control and iPLA2β-KD INS-1 cells and observed indistinguishable time courses (Fig. 4).
FIGURE 4. Time course of [3H]arachidonic acid incorporation into INS-1 cell phospholipids.
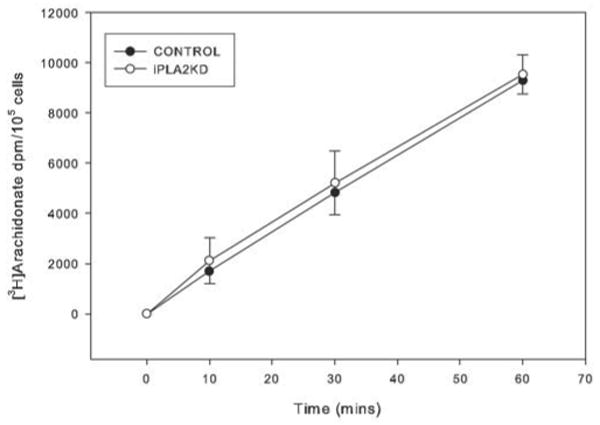
Control (closed symbols) or iPLA2β-KD (open symbols) INS-1 cells were preincubated (30 min, 37 °C) and then incubated with [3H]arachidonic acid for 10–60 min. The 3H content of extracted phospholipids was then determined and expressed as dpm/105 cells (n = 6).
ESI/MS Analyses of INS-1 Cell GPC Lipids
iPLA2β has been proposed to regulate GPC lipid fatty acid composition (22–25) and to cooperate with CTP:phosphocholine cytidylyltransferase to maintain cell PC content at appropriate levels (28, 29). This suggests that suppressing iPLA2β expression might perturb the amount or composition of PC, and we evaluated this possibility with quantitative ESI/MS analyses of GPC lipids from control and iPLA2β-KD INS-1 cells as Li+ adducts (77–79), using both 14:0/14:0-GPC and 18:0–22:6 as internal standards to correct for the effects of fatty acid chain length and unsaturation on ESI/MS ion intensity (81).
The most abundant ion in mass spectra of control INS-1 cell GPC lipids is m/z 766 (Fig. 5A) and represents 16:0/18:1-GPC [M + Li]+, as shown by ions in its tandem spectrum (77–79). Identities of other GPC lipids represented by ions in Fig. 5A were similarly determined and include 18:0/18:1-GPC (m/z 794), 18:1/18:1-GPC (m/z 792), 16:0/18:1-GPC (m/z 764), and 16:0/16:1-GPC (m/z 738). The ions of m/z 684 and m/z 840 represent the internal standards 14:0/14:0-GPC and 18:0/22:6-GPC, respectively. Fig. 5B shows the ESI/MS spectrum of GPC lipid Li+ adducts from iPLA2β-KD cells and is virtually identical to that for control INS-1 cells (Fig. 5A). Table 1 shows that amounts of GPC lipid species are nearly identical in control and iPLA2β-KD INS-1 cells.
FIGURE 5. Electrospray ionization mass spectrometric analyses of INS-1 cell glycerophosphocholine lipids.
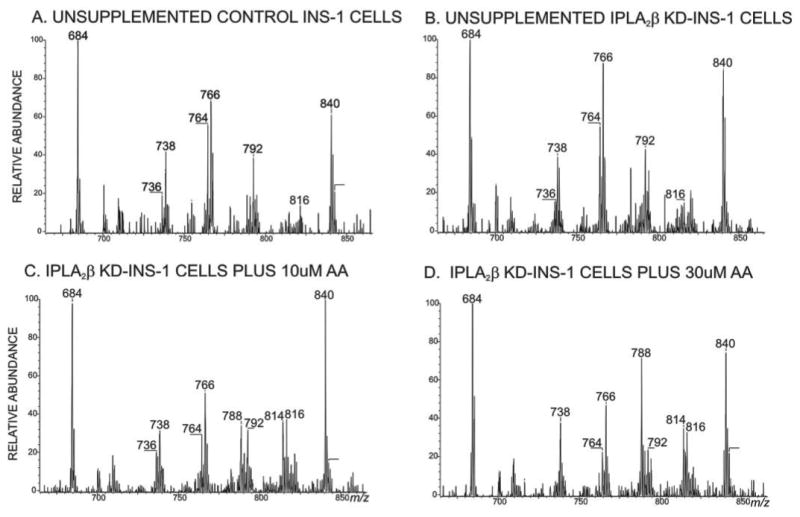
Phospholipids from control (A) or iPLA2β-KD1 INS-1 cells (B) were analyzed as Li+ adducts by positive ion ESI/MS. In C and D, iPLA2β-KD1 INS-1 cells were incubated for 24 h with 10 or 30 μm supplemental arachidonic acid, respectively, in the culture medium before lipids were extracted and analyzed.
TABLE 1. Amounts of glycerophosphocholine lipid species in INS-1 cells with different levels of iPLA2β expression.
Phospholipids were extracted from control or iPLA2β-KD INS-1 cells, and lipid phosphorus (P) was measured. Internal standard 14:0/14:0-GPC was added, and GPC lipid-Li+ adducts were analyzed by ESI/MS. GPC species identities were determined by MS/MS, and their quantities were determined relative to 14:0/14:0-GPC with a standard curve. Mean values ± S.E. (n = 6) are tabulated.
| Value of m/z | Predominant GPC species | Control amount | iPLA2β-KD amount |
|---|---|---|---|
| pmol/nmol lipid P | pmol/nmol lipid P | ||
| 738 | 16:0/16:1-GPC | 366 ± 37 | 322 ± 32 |
| 764 | 16:1/18:1-GPC | 115 ± 11 | 107 ± 11 |
| 766 | 16:0/18:1-GPC | 234 ± 24 | 214 ± 21 |
| 788 | 16:0/20:4-GPC | 19 ± 2 | 19 ± 2 |
| 792 | 18:1/18:1-GPC | 152 ± 15 | 121 ± 12 |
| 794 | 18:0/18:1-GPC | 70 ± 7 | 72 ± 7 |
| 814 | 18:1/20:4-GPC | 19 ± 2 | 20 ± 2 |
| 816 | 18:0/20:4-GPC | 14 ± 1 | 14 ± 1 |
ESI/MS/MS Analyses of Arachidonic Acid Incorporation into INS-1 Cell GPC Lipids
Arachidonic acid-containing GPC lipids are not abundant in INS-1 cells cultured in standard medium, as reflected by the low abundance of ions at m/z 788 and 816 (Figs. 5, A and B) that correspond to 16:0/20:4-GPC and 18:0/20:4-GPC [M + Li]+, respectively. Fig. 4 shows that [3H]arachidonic acid is readily incorporated into INS-cell phospholipids at nanomolar concentrations within minutes, and the possibility that suppressing iPLA2β expression in iPLA2β-KD cells might impair GPC lipid remodeling and synthesis of arachidonate-containing species, as suggested for some cells (22–25), was examined rigorously by ESI/MS (Figs. 5–8).
FIGURE 8. Time course and concentration dependence of appearance of arachidonate-containing glycerophosphocholine lipids in INS-1 cells incubated with arachidonic acid.

Control (closed symbols) or iPLA2β-KD INS-1 cells (open symbols) were incubated with 70 μm arachidonic acid for 0, 6, or 24 h (A) or with varied concentrations (0, 1, 5, 10, 30, or 70 μm) arachidonic acid for 24 h (B). Extracted GPC lipids were analyzed as Li+ adducts by positive ion ESI/MS. The fraction of total ion current represented by 16:0/20:4-GPC (m/z 788), 18:1/20:4-GPC (m/z 814), and 18:0/20:4-GPC (m/z 816) was then determined for each condition. Displayed values are mean ± S.E. (n = 6). No values were significantly different between control and iPLA2β-KD INS-1 cells except for the arachidonate incorporation value at 5 μm arachidonate in B (p < 0.05).
Li+ adducts of GPC lipids from control and iPLA2β-KD INS-1 cells incubated with various concentrations of arachidonic acid for 24 h were analyzed by ESI/MS/MS scanning for parent ions that undergo loss of 183, reflecting net elimination of phosphocholine. This facilitates visualizing accumulation of arachidonate-containing GPC lipids because they eliminate phosphocholine in preference to its Li+ salt (Fig. 6), but the converse is true for GPC lipids with shorter side chains or fewer double bonds (77–79). Such MS/MS scans indicate that 16:0/20:4-GPC (m/z 788) and 18:0/20:4-GPC (m/z 816) are not abundant in unsupplemented INS-1 cells (Fig. 5, A and B), but the abundances of [MLi]+ ions of these compounds increased after 24 h of culture with 10 μm arachidonic acid (Fig. 5C) and increased further upon culture with 30 μm arachidonic acid (Fig. 5D).
FIGURE 6. Tandem mass spectra of arachidonate-containing glycerophosphocholine lipids in INS-1 cells cultured with arachidonic acid.
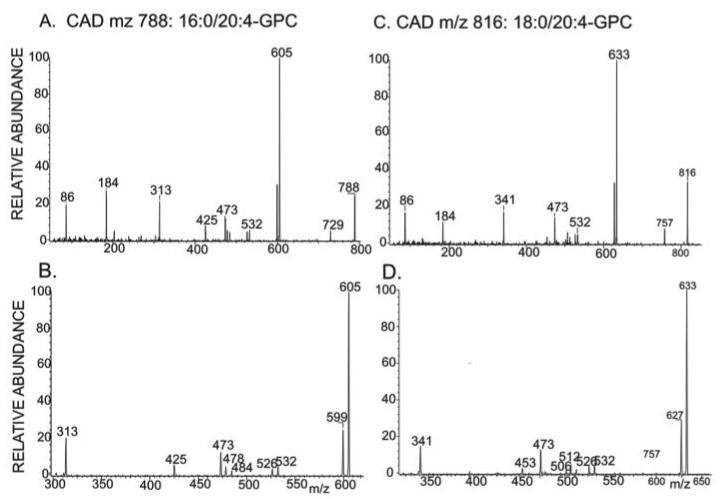
GPC lipid-Li+ adducts from control or iPLA2β-KD1 INS-1 cells incubated for 24 h with arachidonic acid were analyzed by positive ion ESI/MS/MS. In A and B, the ion m/z 788 was subjected to CAD, and product ions were analyzed. A, ions from m/z 50 to 800; B, displays ions from m/z 300 to 620. In C and D, the ion at m/z 816 was subjected to CAD, and product ions were analyzed and displayed as above.
That ions m/z 788 and 816 represent 16:0/20:4- and 18:0/20:4-GPC rather than regioisomers or isobaric compounds is shown by their tandem spectra (Fig. 6). CAD of [MLi+] (m/z 788) of 16:0/20:4-GPC yields spectra (Fig. 6, A and B) that contain ions reflecting neutral losses of trimethylamine plus either the sn-1 substituent (MLi+ − 315) or the sn-2 substituent (MLi+ − 363) as free fatty acids at m/z 473 and 425, respectively. The former is more abundant than the latter, indicating that palmitate and arachidonate are the sn-1 and sn-2 substituents, respectively. Fig. 6, A and B, also shows neutral losses of the sn-1 substituent as a free fatty acid (MLi+ − 284) or as a Li+ salt (MLi+ − 290) at m/z 532 and 526, respectively. Neutral losses of the sn-2 substituent as a free fatty acid (MLi+ − 304) or as a Li+ salt (MLi+ − 310) are seen at m/z 484 and 478, respectively.
The ion m/z 313 (MLi+ − 475) in Fig. 6, A and B, reflects net elimination of LiPO4(CH2)2N(CH3)3 and loss of the sn-2 substituent as a ketene. An analogous m/z 341 ion (MLi+ − 475) is seen in the tandem spectrum 18:0/20:4-GPC-Li+ (Fig. 6, C and D). Other diagnostic ions include those for loss of trimethylamine (m/z 729) or net loss of phosphocholine or its Li+ salt from [M + Li]+ at m/z 605 and 599, respectively; loss of the sn-1 substituent as a free fatty acid or a Li+ salt (m/z 532 and 526, respectively); loss of trimethylamine plus the sn-1 substituent as a free fatty acid (m/z 473); and loss of trimethylamine plus the sn-2 substituent as a free fatty acid (m/z 506).
Upon culture with arachidonic acid, the abundances of [MLi]+ ions of 16:0/20:4-GPC (m/z 788) and 18:0/20:4-GPC (m/z 816) increase after 6 h (Fig. 7B) and are the most abundant in the spectra after 24 h (Fig. 7C). The time course of accumulation is virtually identical in iPLA2β-KD (Fig. 7, D–F) and control INS-1 cells (Figs. 7, A–C), which rigorously confirms radiochemical evidence (Fig. 4) that stable suppression of iPLA2β expression does not impair arachidonate incorporation into iPLA2β-KD INS-1 cells.
FIGURE 7. Electrospray ionization mass spectrometric analyses of glycerophosphocholine lipids in iPLA2β knockdown and control INS-1 cells incubated with arachidonic acid for various intervals.
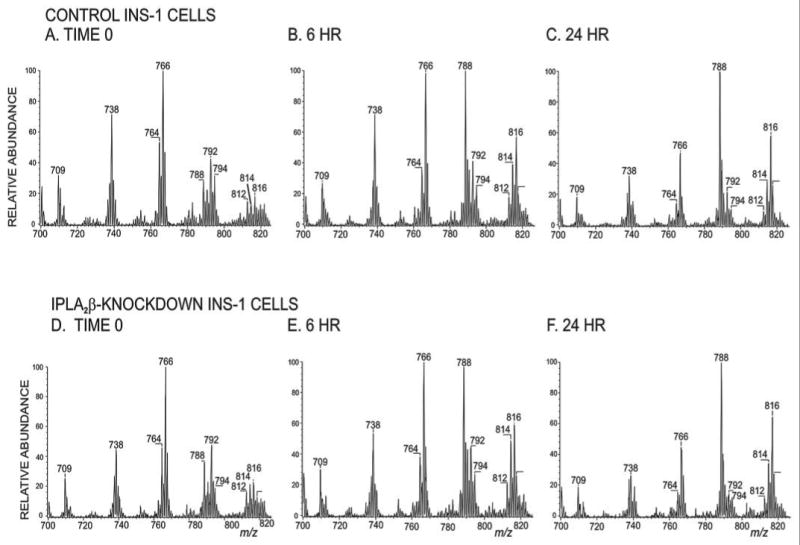
Control (A–C) or iPLA2β-KD (D–F) INS-1 cells were incubated with arachidonic acid for 0 h (A and D), 6 h (B and E), or 24 h (C and F). Extracted GPC lipid-Li+ adducts were analyzed by positive ion ESI/MS/MS scanning for constant neutral loss of 183.
Expressing accumulation of 20:4-containing GPC species as the sum of ion currents for m/z 788 (16:0/20:4-GPC), m/z 814 (18:1/20:4-GPC), and m/z 816 (18:0/20:4-GPC) divided by the total ion current shows that such species accumulate at least as rapidly in iPLA2β-KD as in control INS-1 cells (Fig. 8A). Similarly, the concentration dependence of arachidonate incorporation into GPC lipids indicates that iPLA2β-KD cells incorporate arachidonate at least as readily as do control INS-1 cells (Fig. 8B). The findings illustrated in Fig. 8 confirm over a wide range of concentrations and incubation periods the radiochemical evidence (Fig. 4) that stable suppression of iPLA2β does not impair arachidonate incorporation into iPLA2β-KD INS-1 cells.
ESI/MS Analyses of LPC Species in INS-1 Cell Lines Incubated with Arachidonic Acid
It has been proposed that iPLA2β both regulates levels of 2-LPC, which serves as precursor to 20:4-GPC lipids (22–25) and degrades excess PC to maintain homeostasis (29, 30). It might thus be predicted that suppressing iPLA2β expression would reduce LPC levels, as reported in P388D1 cells after decreasing iPLA2β activity (24, 25).
INS-1 cell LPC levels were thus measured with an internal standard by ESI/MS/MS scanning for loss of trimethylamine, which greatly increases the signal/noise ratio (66, 78, 79) and permits LPC measurement under conditions where total ion current ESI/MS tracings are overwhelmed by chemical noise (66). PC species also yield signal in such scans, and the 14:0/14:0-GPC internal standard can be used to measure LPC (Fig. 9).
FIGURE 9. Electrospray ionization mass spectrometric analyses of INS-1 cell lysophosphatidylcholine species.
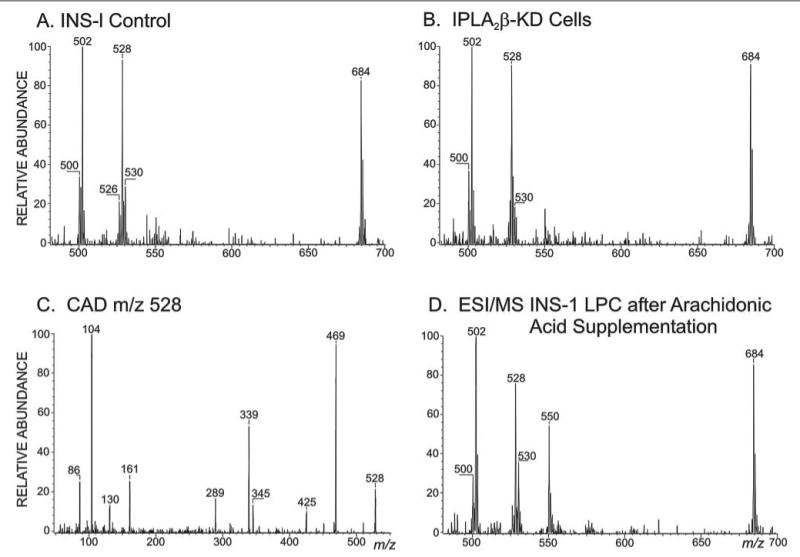
Extracted lipids from control (A) or iPLA2β-KD1 INS-1 cells (B) at time 0 or after 24 h (D) of incubation with arachidonic acid were analyzed as Li+ adducts by positive ion ESI/MS/MS for neutral loss of 59. In C, the ion m/z 528 from ESI/MS analyses in A or B was subjected to CAD, and product ions were analyzed. D, the ESI/MS/MS constant neutral loss of 59 scan for LPC from INS-1 cells incubated for 24 h with arachidonic acid.
The most abundant ions in such scans of LPC Li+ adducts from resting control (Fig. 9A) and iPLA2β-KD (Fig. 9B) INS-1 cells correspond to 16:0-LPC (m/z 502) and 18:1-LPC (m/z 528), respectively. The ion m/z 530 (18:0-LPC) is of low abundance, although in such scans from pancreatic islets, the most abundant ions are m/z 502 and 530 (66). This is consistent with the facts that 18:0-GPC species in INS-1 cells (Table 1) are less abundant than in islets (81). INS-1 cells cultured in standard medium contain little polyunsaturated fatty acid in GPC lipids and express high levels of stearoyl-CoA desaturase-1, which converts 16:0 and 18:0 to 16:1 and 18:1, respectively (72, 82). Culturing INS-1 cells with arachidonic acid suppresses SCD-1 expression, reduces 16:1-and 18:1-GPC lipids, and increases 16:0- and 18:0-GPC lipids (72, 82).
Fig. 9C is the tandem spectrum of m/z 528 in Fig. 9, A or B, and shows that the ion represents 18:1/2-lyso-GPC-Li+ rather than the regioisomer 1-lyso/18:1-GPC or the isobar 1-O-hexadecenyl/2-acetyl-GPC (16:1-PAF). That the ion represents 2-LPC rather than 1-LPC is reflected by the relative abundance of m/z 469 (loss of trimethylamine) and m/z 339 (net loss of Li+ phosphocholine via initial loss of trimethylamine) (78, 79). The latter loss is favored by an sn-2 α-hydrogen atom, which is present in 1-LPC but not 2-LPC (78, 79). This also accounts for the greater abundance in 2-LPC spectra of the head group-derived ion m/z 104 compared with ions from losses of phosphocholine (m/z 345 and 339), whereas the converse is true for 1-LPC (78, 79). That 16:1-PAF does not account for m/z 528 in Fig. 9, A–C, is reflected by the absence of an ion for loss of Li+-acetate and of a charge-remote ion series for 1-O-alkyl chain fragmentation, which are strong ions in PAF-Li+ adduct spectra (79).
Little difference in the LPC content of resting control and iPLA2β-KD INS-1 cells was observed (Fig. 9, A and B), indicating that iPLA2β expression level is not the major regulator of their LPC content. Interestingly, incubating either control or iPLA2β-KD INS-1 cells with arachidonic acid caused accumulation of material represented by an ion of m/z 550 (Fig. 9D).
That m/z value is consistent with 20:4-LPC-Li+, but, in attempts to obtain a CAD spectrum, the ion of m/z 550 was resistant to fragmentation at a collision energy of 32 eV, which produced ready fragmentation of other LPC species (Fig. 9C), or at higher values. There was modest attenuation of the parent ion and limited production of fragment ions (Fig. 10A). When this material was stored for several days or heated for 2 h, the CAD spectrum in Fig. 10B was obtained, which is similar to that reported for 1–20:4/2-lyso-GPC (79) and to that obtained from standard 1–20:4/2-lyso-GPC prepared from 20:4/20:4-GPC with an sPLA2 from N. naja venom (Fig. 10C).
FIGURE 10. Tandem mass spectra of arachidonate containing lysophosphatidylcholine species from INS-1 cells cultured with arachidonic acid and of standard (1-arachidonoyl, 2-lyso)-sn-glycerophosphocholine.

Extracted lipids from control or iPLA2β-KD1 INS-1 cells incubated for 24 h with arachidonic acid were analyzed as Li+ adducts by positive ion ESI/MS/MS, the ion m/z 550 was subjected to CAD, and its product ions were analyzed. A, the spectrum obtained with fresh extracts; B, the spectrum obtained after the extract had been stored for 2 weeks. C, the tandem spectrum of standard 1-arachidonoyl, 2-lyso-GPC prepared from 20:4/20:4-GPC with N. naja phospholipase A2
Fig. 10, B and C, identifies the parent ions as 1–20:4/2-lyso-GPC-Li+, because they contain the Li+-arachidonic acid ion (m/z 311) that identifies the fatty acid substituent; ions reflecting losses of trimethylamine (m/z 491) and of phosphocholine with H+ or Li+ (m/z 367 and 361, respectively) that identify the head group; and ions characteristic of acyl-LPC species, including choline ion (m/z 104), loss of choline to yield a cyclized phosphate diester ([MLi-103]+, m/z 447), loss of arachidonate as a substituted ketene from m/z 447 to yield m/z 161, and a Li+-cyclic ethylene phosphate ion (m/z 131) (80). The relative abundance of ions m/z 104 and 367 reveal an sn-1 fatty acid substituent (79). It is believed that the material represented in Fig. 10A is 1-lyso/2–20:4-GPC and that it isomerizes upon storage or heating to yield 1–20:4/2-lyso-GPC. Acyl migration readily occurs in 2-monoacylphosphoglycerides to form the more stable primary ester (83).
Culturing INS-1 cells with arachidonic acid caused accumulation of 20:4-LPC by 6 h in both control and iPLA2β-KD INS-1 cells that was not associated with a decline in other LPC species (Fig. 11A), although synthesis and accumulation of 20:4-GPC species occurred during this period (Figs. 5–8), presumably via consumption of 16:0-LPC, 18:1-LPC, and 18:0-LPC. INS-1 cells must thus have mechanisms to replenish LPC not affected by suppressing iPLA2β expression, because 16:0-LPC, 18:1-LPC, and 18:0-LPC levels are maintained in iPLA2β-KD INS-1 cells at values no less than those for control cells (Fig. 11A).
FIGURE 11. Time course of appearance of lysophosphatidylcholine species in INS-1 cells incubated with arachidonic acid.
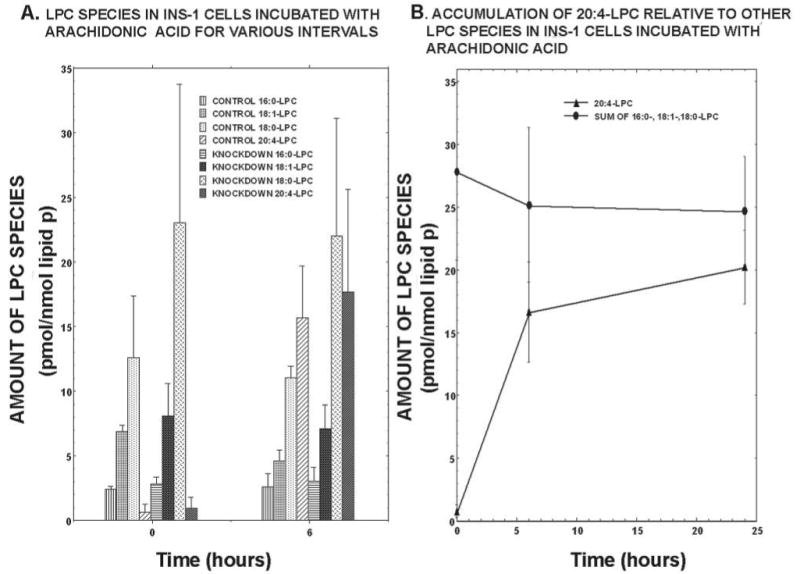
The phosphorus contents of lipid extracts from control or iPLA2β-KD1 INS-1 cells after 0, 6, or 24 h of incubation with arachidonic acid were measured, and internal standard 14:0/14:0-GPC was added. LPC-Li+ adducts were analyzed by positive ion ESI/MS/MS for constant neutral loss of 59. LPC species were measured by determining the ion current for 16:0-LPC (m/z 502), 18:1-LPC (m/z 528), 18:0-LPC (m/z 530), and 20:4-LPC (m/z 550) relative to that for the internal standard (m/z 684) and interpolating from a standard curve. Values are normalized to lipid phosphorus. In A, the leftmost four bars at 0 and 6 h represent LPC analytes in control INS-1 cells, and the rightmost four bars at each time represent those from iPLA2β-KD cells. In B, the closed triangles represent 20:4-LPC, and the closed circles represent the sum of 16:0-, 18:1-, and 18:0-LPC.
Continued culture of INS-1 cells with arachidonic acid for 24 h causes some further rise in 20:4-LPC levels, but other LPC species remain nearly constant (Fig. 11B), despite the fact that continued accumulation of 20:4-GPC species, and presumably consumption of LPC, occurs between 6 and 24 h (Figs. 5–8). The increasing abundance of 20:4-LPC (Fig. 11) must reflect its more rapid generation than consumption in synthetic or degradative reactions. No accumulation of 20:4/20:4-GPC (m/z 836 for MLi+) was observed.
ESI/MS Analyses of GPE, GPG, and GPI Lipids in INS-1 Cells Incubated with Arachidonic Acid
Arachidonic acid first incorporated into PC is then transferred to other phospholipids (66, 84). When cultured with arachidonic acid, both control and iPLA2β-KD INS-1 cells replaced GPE, GPG, and GPI species that contained sn-2 18:1 with species that contained sn-2 20:4 without obvious differences between the cell lines (Fig. 12).
FIGURE 12. Negative ion electrospray ionization mass spectrometric analyses of anionic glycerophospholipids in iPLA2β knockdown and control INS-1 cells incubated with arachidonic acid.

The lipid phosphorus content was measured in extracts from iPLA2β-KD (A and B) or control (C and D) INS-1 cells incubated with arachidonic acid for 0 h (A and C) or 24 h (B and D); internal standard 14:0/14:0-GPE was added; and the mixture was analyzed by negative ion ESI/MS.
In resting iPLA2β-KD (Fig. 12A) and control (Fig. 12C) INS-1 cells, negative ion ESI/MS analyses of lipid extracts revealed abundant ions for 16:0/18:1-GPE (m/z 716), 18:0/20:4-GPE (m/z 766), 16:1/18:1-GPG (m/z 745), 16:0/18:1-GPG (m/z 747), 18:1/18:1-GPG (m/z 773), 16:1/18:1-GPI (m/z 835), 18:1/18:1-GPI (m/z 863), and 18:0/20:4-GPI (m/z 885). Upon culture with arachidonate, ions representing 18:1-containing phospholipids declined markedly, and ions representing 20:4-containing species increased (e.g. m/z 795 (18:1/20:4-GPG), m/z 817 (20:4/20:4-GPG), and m/z 885 (18:0/20:4-GPI) (Fig. 12, B and D). Lipid identities were assigned from tandem mass spectra (85, 86).
Discussion
We have generated clonal INS-1 iPLA2β-KD cell lines that stably express siRNA that reduces iPLA2β expression to less than 20% of control INS-1 cell levels, and this property is stable on serial passage. This provides a tool to study β-cell iPLA2β function, which is important because the best iPLA2β pharmacologic inhibitor (BEL) also inhibits other enzymes (17, 18, 20, 21, 64, 65) and because antisense oligonucleotides are toxic to β-cells at concentrations that fail to reduce iPLA2β expression (66).
Although iPLA2β has been proposed to play the housekeeping role of maintaining membrane phospholipid homeostasis by degrading excess PC (28, 29), stable suppression of iPLA2β expression in INS-1 cells does not result in a significant change in their PC content or composition. Another proposed iPLA2β housekeeping role is to provide LPC acceptors for incorporating arachidonic acid into PC (22–25), but we also observe no change in LPC content or composition or in arachidonate incorporation rates into iPLA2β-KD INS-1 cells.
Rather, we find that INS-1 iPLA2β-KD cells incorporate arachidonate into GPC lipids as readily as control cells when cultured with arachidonic acid. In both control and iPLA2β-KD INS-1 cells cultured in standard medium, GPC lipids contain primarily sn-2 oleate or palmitoleate, and such species are also abundant in anionic phospholipids. Upon culture with arachidonic acid, all of these lipids are remodeled, and species with sn-2 arachidonate become their most abundant components.
In INS-1 cells cultured with arachidonic acid, 16:0/20:4-GPC accumulation precedes that of 18:0-GPC (66, 68), and 16:0/20:4-GPC is thought to be a primary remodeling product, which is then remodeled at sn-1 to generate 18:0/20:4-GPC (87). Synthesis of 18:0/20:4-GPC in β-cells is potentially important, because that is the most abundant GPC lipid in pancreatic islet β-cell secretory granule membranes (88).
The predicted intermediate in that pathway is 1-lyso/2–20:4-GPC, which is produced from 16:0/20:4-GPC by iPLA2γ (89), a distinct enzyme that arises from a gene different from that for iPLA2β (18). We do observe 1-lyso/2–20:4-GPC accumulation in iPLA2β-KD and control INS-1 cells incubated with arachidonate under conditions in which 16:0/20:4-GPC and 18:0/20:4-GPC are produced. This could reflect a role for iPLA2γ in phospholipid remodeling that is consistent with its phospholipase A1 action on 16:0/20:4-GPC (89), and this might explain part of the BEL sensitivity of arachidonate incorporation into P388D1 cells (18, 24). Our findings here argue against a major role for iPLA2β in such remodeling. Accumulation of 20:4/20:4-GPG also occurs in INS-1 cells cultured with arachidonic acid and might be generated via a short lived 1-lyso/20:4-glycerophosphatidic acid intermediate produced from 1-lyso/20:4-GPC by a lysophospholipase D (90).
Our ESI/MS findings that the PC and LPC content and composition and the arachidonate incorporation rates into phospholipids of iPLA2β-KD and control INS-1 cells are virtually identical are consistent with effects of pharmacologic inhibition (57, 66) and molecular biologic overexpression (32, 68) of iPLA2β on these parameters in INS-1 cells and islets.
Our findings do indicate that iPLA2β-KD INS-1 cells exhibit impaired insulin secretory responses and reduced proliferation rates compared with control INS-1 cells. Other evidence also indicates that iPLA2β participates in insulin secretion. Pharmacologic inhibition of iPLA2β with BEL impairs stimulated insulin secretion from rat (54) and human (88) pancreatic islets and from several clonal β-cell lines (55–57, 72). Because BEL affects several targets in addition to iPLA2β (17, 18, 20, 21, 64, 65), it is important to use molecular biologic manipulation of iPLA2β activity to complement pharmacologic findings. Stable overexpression of iPLA2β in INS-1 cells amplifies stimulated insulin secretion (32, 68), and transiently suppressing iPLA2β expression impairs it (48), consistent with the effects of stable suppression reported here.
In glucose-induced insulin secretion, glucose enters β-cells via GLUT-II transporters and is phosphorylated by glucokinase, which results in generation of metabolic signals that include increased [ATP]/[ADP] (91). This inactivates plasma membrane ATP-sensitive K+ channels (KATP) (92), causing membrane depolarization, activation of plasma membrane voltage-operated Ca2+ channels, Ca2+ influx, a rise in [Ca2+] (93), and triggering of insulin exocytosis by Ca2+-sensitive effectors, including Ca2+/calmodulin-dependent protein kinase IIβ (94).
Phospholipid hydrolysis catalyzed by iPLA2β and accumulation of the products nonesterified arachidonate and LPC in β-cell membranes (95–98) have been proposed to amplify the glucose-induced rise in β-cell [Ca2+] and insulin secretion by several mechanisms. These include facilitating Ca2+ entry (95, 98), perhaps by arachidonate effects on voltage-operated Ca2+ channels (99), effects of LPC and arachidonate on KATP (100), effects of an arachidonate 12-lipoxygenase product on a plasma membrane Na+/K+-ATPase (52), and effects of LPC (43) on plasma membrane store-operated cation channels (101).
Our findings also contribute to evidence that iPLA2β, the activity of which varies with the cell cycle (34, 35), is involved in cell proliferation. Phytohemagglutinin-induced lymphocyte proliferation (35) and thrombin-induced vascular myocyte proliferation (42) are suppressed by BEL or by reducing iPLA2β expression with antisense oligonucleotides (35). The reduced proliferation rates reported here for INS-1 cells in which iPLA2β expression is stably suppressed complement the finding that stable iPLA2β overexpression in INS-1 cells increases the proliferation rate (32).
Although we find no evidence that iPLA2β plays the proposed housekeeping roles in PC homeostasis (28, 29) and remodeling (22–25) in β-cells, iPLA2β is widely expressed and might have multiple functions that vary among tissues and cell types, perhaps dependent in part on which splice variants (49–52) and proteolytic processing products (38, 57) of iPLA2β are expressed in a given cell and on what interacting proteins (102) are present in the cell compartment (68, 103) in which the iPLA2β isoform resides. Our findings do indicate that iPLA2β plays signaling or effector role(s) in stimulated insulin secretion from β-cells, and these results with molecular biologic suppression of iPLA2β expression provide an important independent test of inferences from studies with pharmacologic inhibition of iPLA2β activity (54–58, 72, 88).
Acknowledgments
We thank Dr. Mary Wohltmann and Min Tan for excellent technical assistance, Dr. Christopher Newgard (Duke University) for INS-1 cells, and Debra Zboray for help with the manuscript.
Footnotes
This work was supported by United States Public Health Service Grants R37-DK34388, P01-HL57278, P41-RR00954, P60-DK20579, RO1-69455, and P30-DK56341.
The abbreviations used are: PLA2; phospholipase A2; sPLA2, secretory PLA2; cPLA2, cytosolic PLA2; BEL, bromoenol lactone suicide substrate; CAD, collisionally activated dissociation; ESI, electrospray ionization; GPC, glycerophosphocholine; GPE, glycerophosphoethanolamine; GPI, glycerophosphatidylinositol; GPG, glycerophosphoglycerol; iPLA2β, Group VIA phospholipase A2; KD, knockdown; KRB, Krebs-Ringer bicarbonate buffer; LPC, lysophosphatidylcholine; MS, mass spectrometry; MS/MS, tandem mass spectrometry; PAF, platelet-activating factor; PC, phosphatidylcholine; siRNA, small interfering RNA.
References
- 1.Six DA, Dennis EA. Biochim Biophys Acta. 2000;1488:1–19. doi: 10.1016/s1388-1981(00)00105-0. [DOI] [PubMed] [Google Scholar]
- 2.Ma Z, Turk J. Prog Nucleic Acids Res Mol Biol. 2001;67:1–33. doi: 10.1016/s0079-6603(01)67023-5. [DOI] [PubMed] [Google Scholar]
- 3.Brash AR. J Clin Invest. 2001;107:1339–1345. doi: 10.1172/JCI13210. [DOI] [PMC free article] [PubMed] [Google Scholar]
- 4.Radu CG, Yang LV, Riedinger M, Au M, Witte ON. Proc Natl Acad Sci U S A. 2004;101:245–250. doi: 10.1073/pnas.2536801100. [DOI] [PMC free article] [PubMed] [Google Scholar]
- 5.Murphy RC, Sala A. Methods Enzymol. 1990;187:90–98. doi: 10.1016/0076-6879(90)87013-s. [DOI] [PubMed] [Google Scholar]
- 6.Gijon MA, Spencer DM, Kaiser AL, Leslie CC. J Cell Biol. 1999;145:1219–1232. doi: 10.1083/jcb.145.6.1219. [DOI] [PMC free article] [PubMed] [Google Scholar]
- 7.Underwood KW, Song C, Kriz RW, Chang XJ, Knopf JL, Lin LL. J Biol Chem. 1998;273:21926–21932. doi: 10.1074/jbc.273.34.21926. [DOI] [PubMed] [Google Scholar]
- 8.Pickard RT, Strifler BA, Kramer RM, Sharp JD. J Biol Chem. 1999;274:8823–8831. doi: 10.1074/jbc.274.13.8823. [DOI] [PubMed] [Google Scholar]
- 9.Song C, Chang XJ, Bean KM, Proia MS, Knopf JL, Kriz RW. J Biol Chem. 1999;274:17063–17067. doi: 10.1074/jbc.274.24.17063. [DOI] [PubMed] [Google Scholar]
- 10.Ohto T, Uozumi N, Hirabayashi T, Shimizu T. J Biol Chem. 2005;280:24576–24583. doi: 10.1074/jbc.M413711200. [DOI] [PubMed] [Google Scholar]
- 11.Tang J, Kriz RW, Wolfman N, Shaffer M, Seehra J, Jones SS. J Biol Chem. 1997;272:8567–8575. doi: 10.1074/jbc.272.13.8567. [DOI] [PubMed] [Google Scholar]
- 12.Balboa MA, Balsinde J, Jones SS, Dennis EA. J Biol Chem. 1997;272:8576–8580. doi: 10.1074/jbc.272.13.8576. [DOI] [PubMed] [Google Scholar]
- 13.Ma Z, Ramanadham S, Kempe K, Chi XS, Ladenson J, Turk J. J Biol Chem. 1997;272:11118–11127. [PubMed] [Google Scholar]
- 14.Hazen SL, Zupan LA, Weiss RH, Getman DP, Gross RW. J Biol Chem. 1991;266:7227–7232. [PubMed] [Google Scholar]
- 15.Balsinde J, Dennis EA. J Biol Chem. 1997;272:16069–16072. doi: 10.1074/jbc.272.26.16069. [DOI] [PubMed] [Google Scholar]
- 16.Ma Z, Ramanadham S, Hu Z, Turk J. Biochim Biophys Acta. 1998;1391:384–400. doi: 10.1016/s0005-2760(98)00027-7. [DOI] [PubMed] [Google Scholar]
- 17.Balsinde J, Dennis EA. J Biol Chem. 1996;271:6758–6765. doi: 10.1074/jbc.271.12.6758. [DOI] [PubMed] [Google Scholar]
- 18.Mancuso DJ, Jenkins CM, Gross RW. J Biol Chem. 2000;275:9937–9945. doi: 10.1074/jbc.275.14.9937. [DOI] [PubMed] [Google Scholar]
- 19.Tanaka H, Takeya R, Sumimoto H. Biochem Biophys Res Commun. 2000;272:320–326. doi: 10.1006/bbrc.2000.2776. [DOI] [PubMed] [Google Scholar]
- 20.van Tienhoven M, Atkins J, Li Y, Glynn P. J Biol Chem. 2002;277:20942–20948. doi: 10.1074/jbc.M200330200. [DOI] [PubMed] [Google Scholar]
- 21.Jenkins CM, Mancuso DJ, Yan W, Sims HF, Gibson B, Gross RW. J Biol Chem. 2004;279:48968–48975. doi: 10.1074/jbc.M407841200. [DOI] [PubMed] [Google Scholar]
- 22.Balsinde J. Biochem J. 2002;364:695–702. doi: 10.1042/BJ20020142. [DOI] [PMC free article] [PubMed] [Google Scholar]
- 23.Balsinde J, Balboa MA. Cell Signal. 2005;17:1052–1062. doi: 10.1016/j.cellsig.2005.03.002. [DOI] [PubMed] [Google Scholar]
- 24.Balsinde J, Bianco ID, Ackermann EJ, Conde-Frieboes K, Dennis EA. Proc Natl Acad Sci U S A. 1995;92:8527–8531. doi: 10.1073/pnas.92.18.8527. [DOI] [PMC free article] [PubMed] [Google Scholar]
- 25.Balsinde J, Balboa MA, Dennis EA. J Biol Chem. 1997;272:29317–29321. doi: 10.1074/jbc.272.46.29317. [DOI] [PubMed] [Google Scholar]
- 26.Lands WEM, Crawford CG. The Enzymes of Biological Membranes. Vol. 2. Plenum Press; New York: 1997. [Google Scholar]
- 27.Chilton FH, Fonteh AN, Surette ME, Triggiani M, Winkler JD. Biochim Biophys Acta. 1996;1299:1–15. doi: 10.1016/0005-2760(95)00169-7. [DOI] [PubMed] [Google Scholar]
- 28.Baburina I, Jackowski S. J Biol Chem. 1999;274:9400–9408. doi: 10.1074/jbc.274.14.9400. [DOI] [PubMed] [Google Scholar]
- 29.Barbour SE, Kapur A, Deal CL. Biochim Biophys Acta. 1999;1439:77–88. doi: 10.1016/s1388-1981(99)00078-5. [DOI] [PubMed] [Google Scholar]
- 30.Northwood IC, Tong AH, Crawford B, Drobnies AE, Cornell RB. J Biol Chem. 1999;274:26240–26248. doi: 10.1074/jbc.274.37.26240. [DOI] [PubMed] [Google Scholar]
- 31.Cui Z, Houweling M, Chen MH, Record M, Chap H, Vance DE, Terce F. J Biol Chem. 1996;271:14668–14671. doi: 10.1074/jbc.271.25.14668. [DOI] [PubMed] [Google Scholar]
- 32.Ma Z, Bohrer A, Wohltmann M, Ramanadham S, Hsu FF, Turk J. Lipids. 2001;36:689–700. doi: 10.1007/s11745-001-0774-9. [DOI] [PubMed] [Google Scholar]
- 33.Chiu CH, Jackowski S. Biochem Biophys Res Commun. 2001;287:600–606. doi: 10.1006/bbrc.2001.5632. [DOI] [PubMed] [Google Scholar]
- 34.Manguikian AD, Barbour SE. J Biol Chem. 2004;279:52881–52892. doi: 10.1074/jbc.M410659200. [DOI] [PubMed] [Google Scholar]
- 35.Roshak AK, Capper EA, Stevenson C, Eichman C, Marshall LA. J Biol Chem. 2000;275:35692–35698. doi: 10.1074/jbc.M002273200. [DOI] [PubMed] [Google Scholar]
- 36.Seashols SJ, del Castillo Olivares A, Gil G, Barbour SE. Biochim Biophys Acta. 2004;1684:29–37. doi: 10.1016/j.bbalip.2004.05.003. [DOI] [PubMed] [Google Scholar]
- 37.Akiba S, Mizunaga S, Kume K, Hayama M, Sato T. J Biol Chem. 1999;274:19906–19912. doi: 10.1074/jbc.274.28.19906. [DOI] [PubMed] [Google Scholar]
- 38.Atsumi G, Murakami M, Kojima K, Hadano A, Tajima M, Kudo I. J Biol Chem. 2000;275:18248–18258. doi: 10.1074/jbc.M000271200. [DOI] [PubMed] [Google Scholar]
- 39.Jenkins CM, Han X, Mancuso DJ, Gross RW. J Biol Chem. 2002;277:32807–32814. doi: 10.1074/jbc.M202568200. [DOI] [PubMed] [Google Scholar]
- 40.Seegers HC, Gross RW, Boyle WA. J Pharmacol Exp Ther. 2002;302:918–923. doi: 10.1124/jpet.302.3.918. [DOI] [PubMed] [Google Scholar]
- 41.Perez R, Melero R, Balboa MA, Balsinde J. J Biol Chem. 2004;279:40385–40391. doi: 10.1074/jbc.M402562200. [DOI] [PubMed] [Google Scholar]
- 42.Yellaturu CR, Rao GN. J Biol Chem. 2003;278:43831–43837. doi: 10.1074/jbc.M301472200. [DOI] [PubMed] [Google Scholar]
- 43.Smani T, Zakharov SI, Csutora P, Leno E, Trepakova ES, Bolotina VM. Nat Cell Biol. 2004;6:113–120. doi: 10.1038/ncb1089. [DOI] [PubMed] [Google Scholar]
- 44.Martinson BD, Albert CJ, Corbett JA, Wysolmerski RB, Ford DA. J Lipid Res. 2003;44:1686–1691. doi: 10.1194/jlr.M300018-JLR200. [DOI] [PubMed] [Google Scholar]
- 45.Moran JM, Buller RM, McHowat J, Turk J, Wohltmann M, Gross RW, Corbett JA. J Biol Chem. 2005;280:28162–28168. doi: 10.1074/jbc.M500013200. [DOI] [PubMed] [Google Scholar]
- 46.Guo Z, Su W, Ma Z, Smith GM, Gong MC. J Biol Chem. 2003;278:1856–1863. doi: 10.1074/jbc.M211075200. [DOI] [PubMed] [Google Scholar]
- 47.Balboa MA, Saez Y, Balsinde J. J Immunol. 2003;170:5276–5280. doi: 10.4049/jimmunol.170.10.5276. [DOI] [PubMed] [Google Scholar]
- 48.Song K, Zhang X, Zhao C, Ang NT, Ma ZA. Mol Endocrinol. 2005;19:504–515. doi: 10.1210/me.2004-0169. [DOI] [PMC free article] [PubMed] [Google Scholar]
- 49.Larsson Forsell PK, Kennedy BP, Claesson HE. Eur J Biochem. 1999;262:575–585. doi: 10.1046/j.1432-1327.1999.00418.x. [DOI] [PubMed] [Google Scholar]
- 50.Ma Z, Wang X, Nowatzke W, Ramanadham S, Turk J. J Biol Chem. 1999;274:9607–9616. doi: 10.1074/jbc.274.14.9607. [DOI] [PMC free article] [PubMed] [Google Scholar]
- 51.Larsson PK, Claesson HE, Kennedy BP. J Biol Chem. 1998;273:207–214. doi: 10.1074/jbc.273.1.207. [DOI] [PubMed] [Google Scholar]
- 52.Owada S, Larsson O, Arkhammar P, Katz AI, Chibalin AV, Berggren PO, Bertorello AM. J Biol Chem. 1999;274:2000–2008. doi: 10.1074/jbc.274.4.2000. [DOI] [PubMed] [Google Scholar]
- 53.Simonsson E, Ahren B. Int J Pancreatol. 2000;27:1–11. doi: 10.1385/IJGC:27:1:01. [DOI] [PubMed] [Google Scholar]
- 54.Ramanadham S, Gross RW, Han X, Turk J. Biochemistry. 1993;32:337–346. doi: 10.1021/bi00052a042. [DOI] [PubMed] [Google Scholar]
- 55.Ramanadham S, Wolf MJ, Jett PA, Gross RW, Turk J. Biochemistry. 1994;33:7442–7452. doi: 10.1021/bi00189a052. [DOI] [PubMed] [Google Scholar]
- 56.Ramanadham S, Wolf MJ, Li B, Bohrer A, Turk J. Biochim Biophys Acta. 1997;1344:153–164. doi: 10.1016/s0005-2760(96)00139-7. [DOI] [PubMed] [Google Scholar]
- 57.Ramanadham S, Song H, Hsu FF, Zhang S, Crankshaw M, Grant GA, Newgard CB, Bao S, Ma Z, Turk J. Biochemistry. 2003;42:13929–13940. doi: 10.1021/bi034843p. [DOI] [PMC free article] [PubMed] [Google Scholar]
- 58.Ramanadham S, Ma Z, Arita H, Zhang S, Turk J. Biochim Biophys Acta. 1998;1390:301–312. doi: 10.1016/s0005-2760(97)00189-6. [DOI] [PubMed] [Google Scholar]
- 59.Su X, Mancuso DJ, Bickel PE, Jenkins CM, Gross RW. J Biol Chem. 2004;279:21740–21748. doi: 10.1074/jbc.M314166200. [DOI] [PubMed] [Google Scholar]
- 60.Shirai Y, Balsinde J, Dennis EA. Biochim Biophys Acta. 2005;1735:119–129. doi: 10.1016/j.bbalip.2005.05.005. [DOI] [PubMed] [Google Scholar]
- 61.Akiba S, Sato T. Biol Pharm Bull. 2004;27:1174–1178. doi: 10.1248/bpb.27.1174. [DOI] [PubMed] [Google Scholar]
- 62.Larsson Forsell PK, Runarsson G, Ibrahim M, Bjorkholm M, Claesson HE. FEBS Lett. 1998;434:295–299. doi: 10.1016/s0014-5793(98)00999-5. [DOI] [PubMed] [Google Scholar]
- 63.Murakami M, Kambe T, Shimbara S, Kudo I. J Biol Chem. 1999;274:3103–3115. doi: 10.1074/jbc.274.5.3103. [DOI] [PubMed] [Google Scholar]
- 64.Daniels S, Cooney E, Sofia M, Chakravarty P, Katzenellenbogen J. J Biol Chem. 1983;258:15046–15053. [PubMed] [Google Scholar]
- 65.Fuentes L, Perez R, Nieto ML, Balsinde J, Balboa MA. J Biol Chem. 2003;278:44683–44690. doi: 10.1074/jbc.M307209200. [DOI] [PubMed] [Google Scholar]
- 66.Ramanadham S, Hsu FF, Bohrer A, Ma Z, Turk J. J Biol Chem. 1999;274:13915–13927. doi: 10.1074/jbc.274.20.13915. [DOI] [PubMed] [Google Scholar]
- 67.Mancuso DJ, Abendschein DR, Jenkins CM, Han X, Saffitz JE, Schuessler RB, Gross RW. J Biol Chem. 2003;278:22231–22236. doi: 10.1074/jbc.C300033200. [DOI] [PubMed] [Google Scholar]
- 68.Ma Z, Ramanadham S, Wohltmann M, Bohrer A, Hsu FF, Turk J. J Biol Chem. 2001;276:13198–13208. doi: 10.1074/jbc.M010423200. [DOI] [PubMed] [Google Scholar]
- 69.Ramanadham S, Hsu FF, Zhang S, Jin C, Bohrer A, Song H, Bao S, Ma Z, Turk J. Biochemistry. 2004;43:918–930. doi: 10.1021/bi035536m. [DOI] [PMC free article] [PubMed] [Google Scholar]
- 70.Bantounas I, Phylactou LA, Uney JB. J Mol Endocrinol. 2004;33:545–557. doi: 10.1677/jme.1.01582. [DOI] [PubMed] [Google Scholar]
- 71.Bao S, Miller DJ, Ma Z, Wohltmann M, Eng G, Ramanadham S, Moley K, Turk J. J Biol Chem. 2004;279:38194–38200. doi: 10.1074/jbc.M406489200. [DOI] [PMC free article] [PubMed] [Google Scholar]
- 72.Ramanadham S, Hsu F, Zhang S, Bohrer A, Ma Z, Turk J. Biochim Biophys Acta. 2000;1484:251–266. doi: 10.1016/s1388-1981(00)00022-6. [DOI] [PubMed] [Google Scholar]
- 73.Jones LJ, Gray M, Yue ST, Haugland RP, Singer VL. J Immunol Methods. 2001;254:85–98. doi: 10.1016/s0022-1759(01)00404-5. [DOI] [PubMed] [Google Scholar]
- 74.Hawker JR., Jr J Immunol Methods. 2003;274:77–82. doi: 10.1016/s0022-1759(02)00437-4. [DOI] [PubMed] [Google Scholar]
- 75.Bligh EG, Dyer WJ. Can J Biochem Physiol. 1959;37:911–917. doi: 10.1139/o59-099. [DOI] [PubMed] [Google Scholar]
- 76.Hallberg A. Biochim Biophys Acta. 1984;796:328–335. doi: 10.1016/0005-2760(84)90134-6. [DOI] [PubMed] [Google Scholar]
- 77.Hsu FF, Bohrer A, Turk J. J Am Soc Mass Spectrom. 1998;9:516–526. doi: 10.1016/S1044-0305(98)00012-9. [DOI] [PubMed] [Google Scholar]
- 78.Hsu FF, Turk J. J Am Soc Mass Spectrom. 2003;14:352–363. doi: 10.1016/S1044-0305(03)00064-3. [DOI] [PubMed] [Google Scholar]
- 79.Hsu FF, Turk J. J Am Soc Mass Spectrom. 2001;12:1036–1043. doi: 10.1016/S1044-0305(00)00194-X. [DOI] [PubMed] [Google Scholar]
- 80.Nowatzke W, Ramanadham S, Ma Z, Hsu FF, Bohrer A, Turk J. Endocrinology. 1998;139:4073–4085. doi: 10.1210/endo.139.10.6225. [DOI] [PubMed] [Google Scholar]
- 81.Brugger B, Erben G, Sandhoff R, Wieland FT, Lehmann WD. Proc Natl Acad Sci U S A. 1997;94:2339–2344. doi: 10.1073/pnas.94.6.2339. [DOI] [PMC free article] [PubMed] [Google Scholar]
- 82.Ramanadham S, Zhang S, Ma Z, Wohltmann M, Bohrer A, Hsu FF, Turk J. Biochim Biophys Acta. 2002;1580:40–56. doi: 10.1016/s1388-1981(01)00189-5. [DOI] [PubMed] [Google Scholar]
- 83.Gunstone FD, Harwood JL, Padley FB. The Lipid Handbook. Chapman & Hall; New York: 1994. p. 382. [Google Scholar]
- 84.Surette ME, Winkler JD, Fonteh AN, Chilton FH. Biochemistry. 1996;35:9187–9196. doi: 10.1021/bi9530245. [DOI] [PubMed] [Google Scholar]
- 85.Hsu FF, Turk J. J Am Soc Mass Spectrom. 2000;11:892–899. doi: 10.1016/S1044-0305(00)00159-8. [DOI] [PubMed] [Google Scholar]
- 86.Hsu FF, Turk J. J Am Soc Mass Spectrom. 2000;11:986–999. doi: 10.1016/S1044-0305(00)00172-0. [DOI] [PubMed] [Google Scholar]
- 87.Kuwae T, Schmid PC, Schmid HH. Biochim Biophys Acta. 1997;1344:74–86. doi: 10.1016/s0005-2760(96)00135-x. [DOI] [PubMed] [Google Scholar]
- 88.Ramanadham S, Bohrer A, Gross RW, Turk J. Biochemistry. 1993;32:13499–13509. doi: 10.1021/bi00212a015. [DOI] [PubMed] [Google Scholar]
- 89.Yan W, Jenkins CM, Han X, Mancuso DJ, Sims HF, Yang K, Gross RW. J Biol Chem. 2005;280:26669–26679. doi: 10.1074/jbc.M502358200. [DOI] [PubMed] [Google Scholar]
- 90.Tokumura A, Majima E, Kariya Y, Tominaga K, Kogure K, Yasuda K, Fukuzawa K. J Biol Chem. 2002;277:39436–39442. doi: 10.1074/jbc.M205623200. [DOI] [PubMed] [Google Scholar]
- 91.Meglasson MD, Matschinsky FM. Diabetes Metab Rev. 1986;2:163–214. doi: 10.1002/dmr.5610020301. [DOI] [PubMed] [Google Scholar]
- 92.Cook DL, Satin LS, Ashford ML, Hales CN. Diabetes. 1988;37:495–498. doi: 10.2337/diab.37.5.495. [DOI] [PubMed] [Google Scholar]
- 93.Arkhammar P, Nilsson T, Rorsman P, Berggren PO. J Biol Chem. 1987;262:5448–5454. [PubMed] [Google Scholar]
- 94.Easom RA. Diabetes. 1999;48:675–684. doi: 10.2337/diabetes.48.4.675. [DOI] [PubMed] [Google Scholar]
- 95.Wolf BA, Pasquale SM, Turk J. Biochemistry. 1991;30:6372–6379. doi: 10.1021/bi00240a004. [DOI] [PubMed] [Google Scholar]
- 96.Wolf BA, Colca JR, Comens PG, Turk J, McDaniel ML. J Biol Chem. 1986;261:16284–16287. [PubMed] [Google Scholar]
- 97.Turk J, Mueller M, Bohrer A, Ramanadham S. Biochim Biophys Acta. 1992;1125:280–291. doi: 10.1016/0005-2760(92)90057-3. [DOI] [PubMed] [Google Scholar]
- 98.Ramanadham S, Gross R, Turk J. Biochem Biophys Res Commun. 1992;184:647–653. doi: 10.1016/0006-291x(92)90638-2. [DOI] [PubMed] [Google Scholar]
- 99.Vacher P, McKenzie J, Dufy B. Am J Physiol. 1989;257:E203–E211. doi: 10.1152/ajpendo.1989.257.2.E203. [DOI] [PubMed] [Google Scholar]
- 100.Eddlestone GT. Am J Physiol. 1995;268:C181–C190. doi: 10.1152/ajpcell.1995.268.1.C181. [DOI] [PubMed] [Google Scholar]
- 101.Roe MW, Worley JF, III, Qian F, Tamarina N, Mittal AA, Dralyuk F, Blair NT, Mertz RJ, Philipson LH, Dukes ID. J Biol Chem. 1998;273:10402–10410. doi: 10.1074/jbc.273.17.10402. [DOI] [PubMed] [Google Scholar]
- 102.Wang Z, Ramanadham S, Ma ZA, Bao S, Mancuso DJ, Gross RW, Turk J. J Biol Chem. 2005;280:6840–6849. doi: 10.1074/jbc.M405287200. [DOI] [PMC free article] [PubMed] [Google Scholar]
- 103.Bao S, Jin C, Zhang S, Turk J, Ma Z, Ramanadham S. Diabetes. 2004;53 1:186–189. doi: 10.2337/diabetes.53.2007.s186. [DOI] [PMC free article] [PubMed] [Google Scholar]