

SUMMARY
Autophagy is a catabolic process that is negatively regulated by growth and has been implicated in cell death. We find that autophagy is induced following growth arrest, and precedes developmental autophagic cell death of Drosophila salivary glands. Maintaining growth by expression of either activated Ras or positive regulators of the class I phosphoinositide 3-kinase (PI3K) pathway inhibits autophagy and blocks salivary gland cell degradation. Developmental degradation of salivary glands is also inhibited in autophagy gene (atg) mutants. Caspases are active in PI3K-expressing and atg mutant salivary glands, and combined inhibition of both autophagy and caspases increases suppression of gland degradation. Further, induction of autophagy is sufficient to induce premature cell death in a caspase-independent manner. Our results provide in vivo evidence that growth arrest, autophagy, and atg genes are required for physiological autophagic cell death, and that multiple degradation pathways cooperate in the efficient clearance of cells during development.
Keywords: autophagy, cell death, apoptosis, growth, Drosophila, development
INTRODUCTION
Cell and tissue homeostasis is maintained by an intricate balance of metabolic and catabolic processes. Tissue and organ size is genetically determined through the regulation of cell growth, cell division and cell death; yet these processes are further influenced by environmental factors, neighboring cells and the availability of nutrients (Conlon and Raff, 1999). The balance between cell growth and cell death is critical for tissue homeostasis, and disruption of this balance can lead to a variety of disorders including cancer (Lowe et al., 2004).
The class I PI3K pathway is an important regulator of cell growth. Mis-regulation of positive regulators of the PI3K pathway, including p110 and Akt/PKB, can lead to overgrowth, while negative regulators of PI3K have been characterized as tumor suppressors (Cantley and Neel, 1999). In nutrient rich conditions, PI3K is activated, leading to increased growth and protein synthesis with reduced protein degradation (Kozma and Thomas, 2002). Activated PI3K signals through p110 and Akt to activate the target-of-rapamycin (TOR) kinase. TOR mediates a balance between cell growth and protein degradation; activated TOR increases protein synthesis and reduces protein catalysis (Arsham and Neufeld, 2006). Growth factors and their receptors also influence the Ras/mitogen activated protein kinase (MAPK) pathway. Activation of the Ras pathway induces regulators of the cell cycle including Myc, E2F, and cyclin-dependent kinases (Cdks), as well as the class I PI3K pathway (Prober and Edgar, 2002). Cell death restricts tissue growth under conditions of cell competition during development (de la Cova et al., 2004; Moreno and Basler, 2004), but the influence that growth may have on the regulation of cell death unclear.
The two most prominent forms of developmental cell deaths are Type I cell death, or apoptosis, and Type II autophagic cell death (Clarke, 1990; Schweichel and Merker, 1973). While the biochemical mechanisms that regulate apoptosis have been extensively characterized, little is known about the mechanisms and genes that regulate autophagic cell death. Apoptosis is characterized by caspase activation, DNA fragmentation, cytoplasmic blebbing and phagocyte engulfment of the apoptotic cell such that complete degradation of the cell requires the engulfing cell’s lysosomal machinery (Clarke, 1990; Kerr et al., 1972). In contrast, cells that die with an autophagic cell death morphology are capable of digesting their own contents without the aid of engulfing phagocytes (Clarke, 1990; Martin and Baehrecke, 2004). The morphological hallmark of autophagic cell death is the presence of autophagosomes in the dying cell (Clarke, 1990; Schweichel and Merker, 1973), which has led to speculation that macroautophagy contributes to cell death (Baehrecke, 2002).
Macroautophagy (hereafter referred to as autophagy) is a conserved catabolic process for the removal of long lived proteins, organelles and bulk cytoplasm (Klionsky and Emr, 2000). Cytoplasmic cargo is sequestered into a double-membrane autophagosome, then translocated and deposited into the lysosome for degradation. This cargo is an important source of resources to maintain homeostasis and to sustain cell viability under starvation conditions. Studies in yeast have identified more than 20 atg genes that are each required for autophagy and many of these atg genes are functionally conserved from yeast to humans (Harding et al., 1996; Harding et al., 1995; Klionsky et al., 2003; Thumm et al., 1994; Tsukada and Ohsumi, 1993). In multi-cellular organisms, autophagy is negatively regulated by class I PI3K signaling via TOR (Petiot et al., 2000; Scott et al., 2004). Activated TOR inhibits Atg1 (Kamada et al., 2000), a critical positive regulator of autophagy. The connection between class I PI3K and growth is clear; however, it has not been determined if the association of autophagy with cell death could be related to growth arrest.
The mechanistic role of autophagy in type II cell death is a subject of debate (Levine and Yuan, 2005). As autophagy is required for cell survival during starvation, it has been speculated that the induction of autophagy during cell death is a survival response intended to block cell death. Alternatively, the induction of this catabolic process in dying cells could allow self-digestion in the absence of phagocytes. Autophagy has been shown to be required for caspase-independent cell death in vitro (Shimizu et al., 2004; Yu et al., 2004), and robust induction of autophagy leads to cell death associated with caspases (Scott et al., 2007). Although autophagy is required for phagocytosis signaling in an in vitro model of mouse embryonic cavitation (Qu et al., 2007), the function of autophagy and atg genes during developmental cell death in vivo remains unclear. Given the association of autophagy with degenerative diseases and cancer (Shintani and Klionsky, 2004), it is critical to understand the relationship between this catabolic process and its role in autophagic cell death.
Drosophila larval salivary glands are an ideal in vivo model system for studies of developmental autophagic cell death. Salivary gland cell death is induced by a rise in the steroid hormone 20-hydroxyecdysone (ecdysone) 10–12 hours after puparium formation (apf). Salivary glands are then rapidly degraded by 16 hours apf. The majority of the Drosophila atg and caspase genes are coordinately induced at the time of salivary gland cell death (Gorski et al., 2003; Lee et al., 2003). Dying salivary gland cells contain many autophagosomes, and self-degradation occurs in the absence of phagocytes (Lee and Baehrecke, 2001; Martin and Baehrecke, 2004). Caspases are traditionally associated with apoptotic cell death, but we observe processed caspase-3 and caspase-dependent DNA fragmentation and nuclear lamin cleavage during autophagic cell death of salivary glands (Lee and Baehrecke, 2001; Martin and Baehrecke, 2004). Although expression of the bacuolovirus inhibitor of caspases, p35, blocks DNA fragmentation and nuclear lamin cleavage, it does not completely inhibit salivary gland degradation (Lee and Baehrecke, 2001; Martin and Baehrecke, 2004). As such, additional caspase-independent degradation processes are also involved in salivary gland degradation.
Here we investigate the roles of growth arrest, autophagy, and the atg genes in the autophagic cell death of salivary glands. Growth arrest precedes and is required for salivary gland degradation. Maintenance of cell growth by expression of positive regulators of the class I PI3K pathway and activated Ras inhibits gland degradation. This cell over-growth did not prevent caspase activation, but did block autophagy. Autophagy is induced just prior to salivary gland cell death, and salivary glands are not properly degraded in atg gene mutants. Combined inhibition of caspases and autophagy further blocked gland degradation, suggesting they function as independent degradation pathways. Induction of autophagy by Atg1 expression caused premature capase-independent cell degradation. Together, these data are the first demonstration that growth arrest, autophagy and atg genes function in vivo in the regulation of autophagic cell death during development.
RESULTS
Growth arrest is required for destruction of salivary glands
The identification of several growth regulators and atg RNAs and proteins by DNA microarrays and proteomics (Lee et al., 2003; Martin et al., 2007) prompted us to investigate the relationship between growth and autophagy in salivary glands. We monitored PI3K activity during development of larval salivary glands using the phosphatidylinositol-3, 4, 5-P3 (PIP3) reporter tGPH (tubulin-GFP-Pleckstrin Homology) as an in vivo reporter for class I PI3K activity (Britton et al., 2002). PI3K activity is indicated by the recruitment of tGPH to the cell cortex. In wild-type feeding and growing larvae, tGPH is cortically localized in salivary gland cells (Figure 1A). Cortical localization of tGPH is lost at the onset of puparium formation when food is no longer consumed, and growth arrests (Figure 1B). Cortical tGPH is not detected at the time of salivary gland cell death (Figure 1C).
Figure 1. Loss of cortical tGPH coincides with growth arrest and the induction of autophagy.
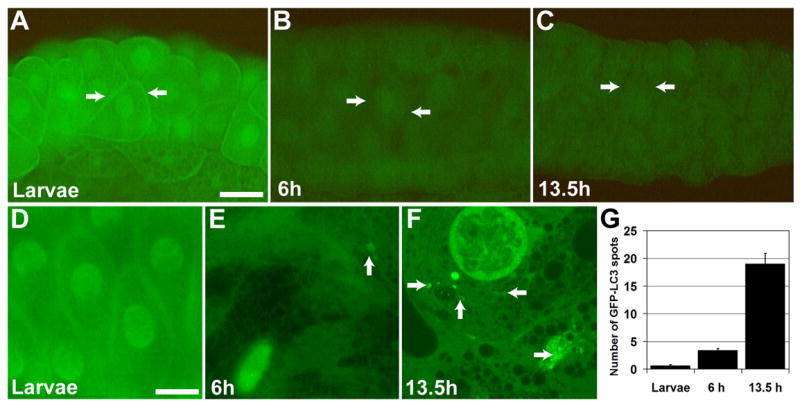
(A–C) Cortical localization of tGPH reflects PI3K activity during normal development of fkhGAL4; tGPH pupae. (A) Cortical tGPH is observed in the growing salivary glands of wandering larvae. (B) No cortical tGPH is observed in salivary glands 6 hours apf or (C) in dying 13.5-hour salivary glands. (D–G) Autophagy is indicated by GFP spots (autophagosomes) in salivary glands during normal development of fkhGAL4; UAS-GFP-LC3 pupae. (D) GFP-LC3 spots are rare in the growing salivary glands of feeding larvae. (E) GFP-LC3 spots were detected at low levels 6 hours apf, and were abundant in salivary glands 13.5 hours apf (F). (G) The number of GFP-LC3 spots per image was quantified in salivary glands of feeding larvae and of pupae 6 and 13.5 hours apf, and are represented as the mean ± SE. Scale bar in (A) is 100 μm, and (A–C) are same magnification. Arrows point to cell cortex in (A–C). Scale bar in (D) is 25 μm, and (D–F) are same magnification. Arrows point to GFP-LC3 spots in (D–F).
Class I PI3K signaling and growth have been shown to negatively regulate autophagy (Scott et al., 2004). We analyzed the temporal relationship between growth and autophagy in salivary glands using the autophagy reporter, GFP-LC3. The induction of autophagy leads to the association of GFP-LC3 with autophagosomal membranes that are visible as punctate GFP spots. In wild-type feeding larvae, very low numbers of GFP-LC3 spots are detected (Figures 1D and 1G). Subsequent to growth arrest, the number of GFP-LC3 spots increases by 6 hours apf (Figures 1E and 1G). Following the rise of ecdysone that triggers cell death, the number of GFP-LC3 spots increases dramatically (Figures 1F and 1G). The increase in GFP-LC3 spots correlates with the observation of autophagosomes by transmission electron microscopy at the time of gland cell death (Lee and Baehrecke, 2001).
The association of growth arrest with autophagy and salivary gland cell degradation led us to investigate whether maintaining PI3K-dependent growth could block cell degradation. Growth was increased in salivary glands by expression of the positive regulators of class I PI3K Dp110 (the active subunit of PI3K) and Akt, and activated RasV12. Expression of these growth regulators led to maintenance of cortically-localized tGPH at 13.5 hours apf, while tGPH was not associated with cell cortex in control salivary glands (Figures 2A–2D). Expression of Dp110, Akt and RasV12 each induced significant cell growth creating very large over-grown salivary glands (Figures 2A–2E, S1A–S1D, and S2A). In control animals, salivary glands begin to die at 12 hours apf, and are rapidly degraded over the next four hours such that little to no salivary gland tissue remains 24 hours apf (Figures 2F and 2J). Maintenance of growth by expression of either Dp110, Akt, or RasV12 prevented complete salivary gland degradation and salivary gland tissue remained at 24 hours apf (Figures 2G–2J). In RasV12-expressing salivary glands, degradation is almost completely blocked with intact salivary glands still visible 24 hours apf (Figures 2I and 2J). While Dp110- and Akt-expressing glands are always present 24 hours apf, they are partly degraded (Figures 2G, 2H and 2J). All other morphological and developmental events occur normally in these animals including the timing and morphology of future adult head eversion. Hence the inhibition of salivary gland degradation is not due either to a developmental delay or arrest associated with altered ecdysone signaling. Developmentally, growth and cortical tGPH correlated with low levels of autophagy, so we analyzed autophagy by GFP-LC3 in salivary glands that express growth regulators. Indeed, the induction of autophagy observed at 13.5h apf in wild-type glands does not occur in the Dp110-, Akt- and Ras-expressing glands (Figure 2K–2O).
Figure 2. Maintenance of growth prevents induction of autophagy and inhibits salivary gland degradation.
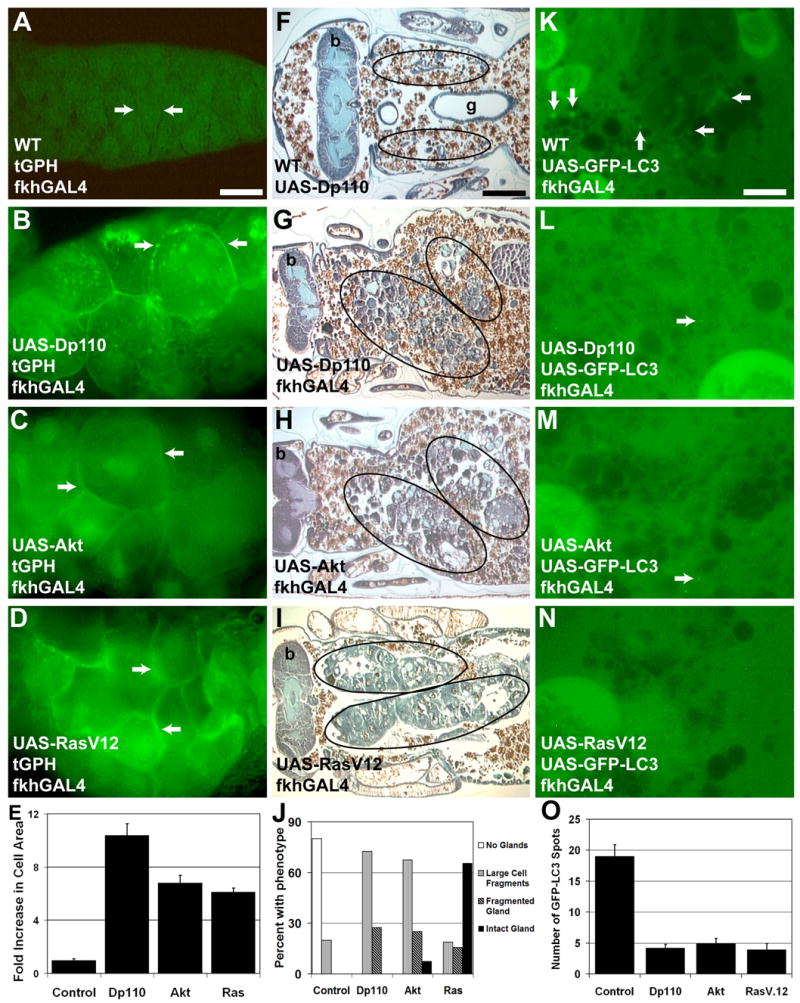
(A–D) Cortical localization of tGPH correlates with growth. (A) At 13.5 hours apf, no cortical tGPH is observed in control dying salivary glands. Expression of either (B) Dp110, (C) Akt or (D) RasV12 in the salivary glands results in increased growth and maintenance of cortically localized tGPH 13.5 hours apf. (E) Cell area measurements in the indicated genotypes 13.5 hours apf illustrate the increase in cell size in Dp110, Akt, and RasV12 expressing salivary glands. The data are presented as fold increase in cell area compared to cells from control fkhGAL4; Canton-S pupae and are represented as mean ± SE. (F–I) Paraffin sections of pupae 24 hours apf. (F) Salivary glands are completely degraded in control pupae (Canton-S/UAS-Dp110) 24 hours apf. The location where glands resided prior to degradation is encircled. Maintaining growth by expression of either (G) Dp110 (H), Akt, or (I) RasV12 in salivary glands inhibits degradation and tissue is present 24 hours apf. Circles outline the persistent salivary gland tissue in these pupae. (J) Paraffin sections of the above genotypes were evaluated for the amount and type of salivary gland tissue that was present in 24 hour pupae. The percentage of pupae with each phenotype is presented (n > 20 pupae/genotype). (K–N) GFP-LC3 spots are abundant in control salivary glands 13.5 hours apf (K), but are reduced in 13.5 hour salivary glands expressing (L) Dp110, (M) Akt, and (N) RasV12. (O) The number of GFP-LC3 spots per image was quantified for the indicated genotypes 13.5 hours apf. The data is represented as mean ± SE. Scale bar in (A) is 60 μm and (A–D) are the same magnification. Scale bar in (F) is 200 μm and (F–I) are the same magnification. Scale bar in (K) is 19 μm and (K–N) are the same magnification. Arrows point to the cell cortex in (A–D). Arrows point to GFP-LC3 spots in (K–N). Symbols are (b) brain and (g) gut.
Ras influences multiple signaling pathways including those involved in cell cycle and growth (Prober and Edgar, 2002). We investigated whether the inhibition in salivary gland degradation in RasV12-expressing salivary glands was due to either signaling through the class I PI3K pathway and TOR, or through MAPK effectors of the cell cycle. Induction of the cell cycle by expression of either Myc or CyclinD with Cdk4 significantly increased nuclear size in the endo-replicating salivary gland cells (Figure S2B). However, neither Myc nor CyclinD with Cdk4 expression lead to consistent over-growth (Figures S1E–S1F, and S2A) or blocked gland degradation (Figures 3A–3B). Thus, induction of the cell cycle alone is not sufficient to inhibit salivary gland degradation. PI3K is believed to mediate a balance between growth and autophagy through the regulation of TOR. To determine whether the RasV12- and PI3K-induced phenotypes were dependent on TOR, we co-expressed a dominant negative TOR (TORted) with either RasV12 or Dp110. Expression of TORted suppressed the Dp110-induced and partially suppressed the RasV12-induced over-growth phenotypes and the glands were predominantly degraded (Figure 3C–3F, and Figure S1G–S1I). Together, these data indicate that maintenance of growth via TOR blocks autophagy and inhibits salivary gland degradation.
Figure 3. Ras and PI3K inhibition of salivary gland degradation requires TOR.
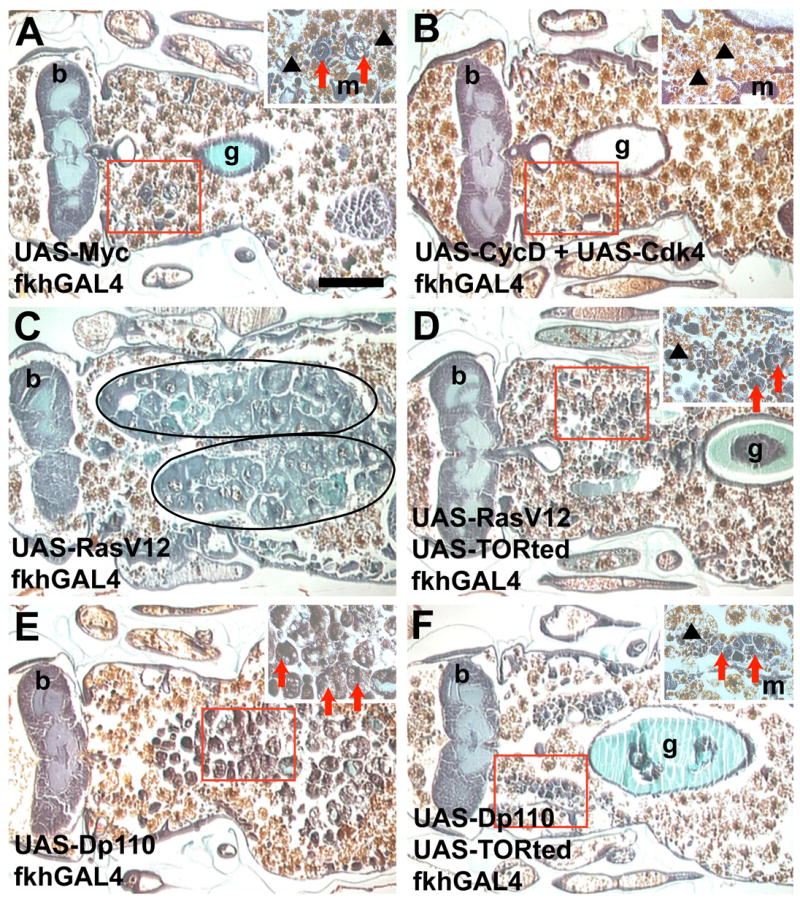
Paraffin sections 24 hours apf show that increasing the cell cycle by expression of either (A) Myc or (B) CycD with Cdk4 in the salivary gland does not prevent salivary gland degradation. Inhibition of salivary gland degradation by expression of (C) RasV12 in the salivary glands (circled) is ameliorated by co-expression of (D) RasV12 with TORted. Similarly, inhibition of salivary gland degradation by expression of (E) Dp110 in the salivary glands is ameliorated by co-expression of (F) Dp110 with TORted. Scale bar in (A) is 200 μm and (A–F) are the same magnification. Red boxes indicate the region of higher magnification shown in the insets for each image. Red arrows point to salivary gland fragments. Black arrowheads point to fat body that is present in the area after the salivary gland has degraded. Symbols are (b) brain, (m) muscle and (g) gut.
PI3K-dependent growth alters salivary gland destruction in the presence of caspase activity
Caspases are critical regulators of apoptosis, and function in type II autophagic cell death of salivary glands. The class I PI3K pathway has been shown to influence caspase regulators (Datta et al., 2002) and autophagy (Scott et al., 2004), so we tested if expression of growth regulators also influenced caspases in salivary glands. Caspase-dependent DNA fragmentation and cleavage of nuclear lamin occur in control salivary glands 13.5 hours apf (Figures 4D and 4G). No DNA fragmentation was detected by TUNEL in the endoreplicating nuclei of 6-hour salivary glands in either control, Dp110-, Akt-, or RasV12-expressing salivary glands (Figures 4A–4C and data not shown). DNA fragmentation was detected by TUNEL in the Dp110-, Akt-, and RasV12-expressing glands 13.5 hours apf (Figures 4E–4F and data not shown). Dp110-expressing salivary glands are also positively stained with an antibody to cleaved caspase-3 and show decreased nuclear lamin staining at 13.5 hours apf (Figure 4H). Further, we detected caspase-3 activity by cleavage of the substrate DEVD-AMC at 13.5 hours apf in Canton-S, and in Dp110-, Akt- and RasV12-expressing glands, but not in p35-expressing glands (Figure 4I). Together, these data indicate that caspases are active and capable of substrate cleavage in the presence of PI3K activity in salivary glands.
Figure 4. DNA is fragmented and caspases are active when salivary gland growth is maintained.
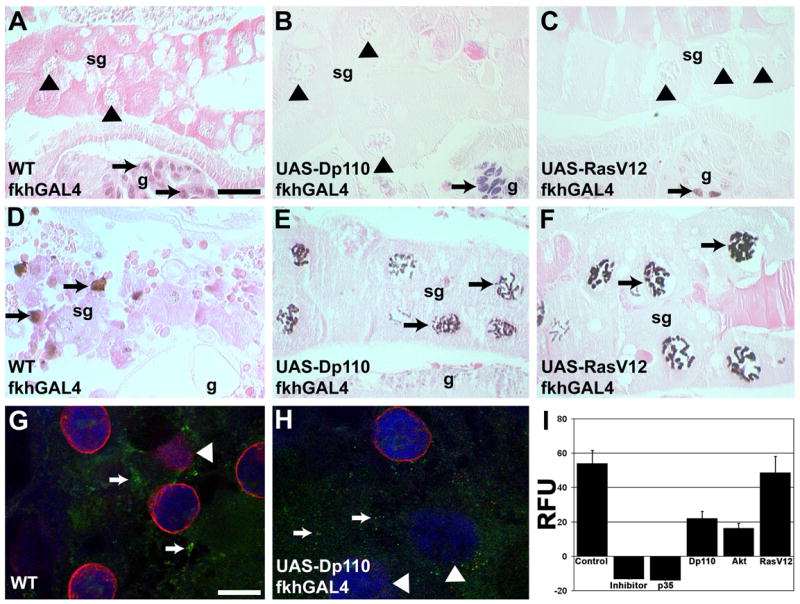
(A–F) Visualization of DNA fragmentation by the TUNEL assay. Nuclei of 6-hour apf (A) Canton-S control, (B) Dp110-, and (C) RasV12-expressing salivary glands are TUNEL negative (black triangles) while nuclei in nearby dying gut cells are TUNEL positive (black arrows). TUNEL positive nuclei were detected in salivary glands from 13.5-hour (D) Canton-S control, (E) Dp110- and (F) RasV12-expressing salivary glands. (G, H) Antibodies against processed caspase-3 (green) and nuclear lamins (red) indicate that processed caspase-3 is present (white arrows) and that the caspase substrate lamin is degrading (white arrowheads) in 13.5-hour (G) wild-type control glands and (H) Dp110-expressing glands (DNA is blue). (I) Cleavage of the caspase substrate Z-DEVD-AMC was measured in 13.5-hour salivary glands of Control Canton-S, Control Canton-S plus Ac-DEVD-CHO as an inhibitor, and of p35-, Dp110-, Akt- and RasV12-expressing salivary glands. Scale bar in (A) is 50 μm and (A–F) are the same magnification. Scale bar in (G) is 30 μm and (G–H) are the same magnification. Symbols are (sg) salivary gland, (g) gut, and (RFU) relative fluorescence units.
We further tested the role of caspases in autophagic cell death by analyzing salivary gland cell death in caspase loss-of-function mutants. We previously showed that salivary glands are partially degraded when caspases are inhibited by p35 expression, and are completely degraded in loss-of-function mutants in the effector caspase drice (Muro et al., 2006). Similarly, salivary glands are predominantly if not completely degraded in loss-of-function mutants in either the Apaf-1 orthologue ark or in the initiator caspase dronc that develop normally (Figures 5A–5B, S3E). We do observe a small percentage of ark and dronc mutant pupae that have salivary glands or partially degraded salivary glands, but in all cases these animals also possess defects indicative of a developmental arrest prior to the onset of normal salivary gland destruction (Figures S3A–S3B). To circumvent the developmental defects associated with global loss of caspase function, we selectively knocked-down ark and dronc in salivary glands using RNAi. Leulier et al. used a GFP reporter to show that salivary gland degradation is delayed in pupae expressing ark-IR and dronc-IR in salivary glands (Leulier et al., 2006), and we confirmed by histology that glands are predominantly if not completely degraded in these animals (Figures S3C–S3E). Finally, similar to p35, DIAP1-expressing salivary glands are partly degraded (S. Dutta and E.H.B., unpublished). As salivary glands are partially degraded when caspases are inhibited, additional caspase-independent factors must be required for type II autophagic cell death of salivary glands.
Figure 5. Multiple degradation pathways are required for complete salivary gland histolysis.
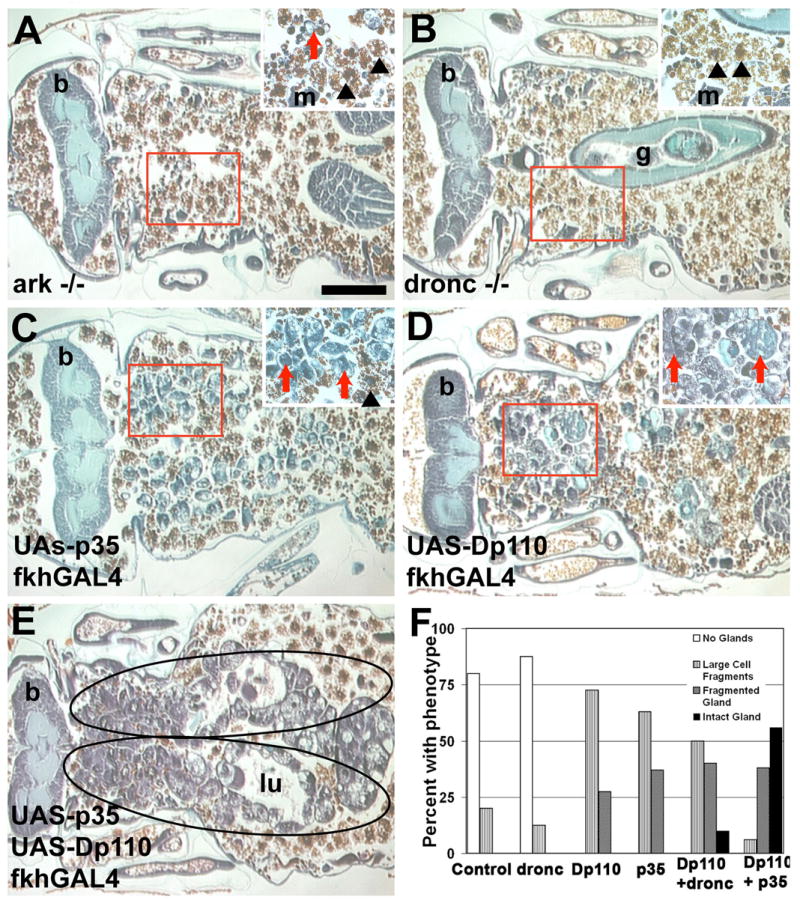
(A–E) Paraffin sections 24 hours apf. Salivary glands are degraded in (A) arkL46/N28 and (B) droncI24/I29 mutants that develop normally. Partial degradation occurs in salivary glands expressing (C) p35 and (D) Dp110. (E) Expression of p35 combined with Dp110 significantly increases the amount of persistent salivary gland tissue (encircled). (F) Histological sections of the indicated genotypes were evaluated for the amount and type of salivary gland tissue that was present in pupae 24 hours apf. The percentage of pupae with each phenotype is presented (n > 20 pupae/genotype). Scale bar in (A) is 200 μm and (A–E) are the same magnification. Red boxes indicate the region of higher magnification shown in the insets for each image. Red arrows point to salivary gland fragments. Black arrowheads point to fat body that is present in the area after the salivary gland has degraded. Symbols are (b) brain, (g) gut, (m) muscle, and (lu) lumen.
Since we detect caspase activity in Dp110-expressing glands, we tested whether combining PI3K-dependent growth with caspase inhibition would lead to an increased inhibition of salivary gland degradation. When Dp110 is either combined with p35 or expressed in dronc mutants, the persistence of salivary glands with intact lumen is significantly increased compared to either expression of Dp110 or p35, or in dronc mutants alone (Figures 5C–5F). These data indicate that it is the combined influences of caspases and growth arrest that leads to autophagic death of salivary glands.
Autophagy is required for proper salivary gland degradation
As PI3K-dependent growth inhibited autophagy and gland degradation, we analyzed available atg loss-of-function mutants to assess the role of autophagy in developmental cell death. Previous studies have demonstrated that autophagy is not induced in flies with mutations in either atg8 (atg8aKG07569) or atg18 (atg18KG03090), or in flies expressing an atg1 kinase dead mutant (Atg1KQ#5B) that functions as an atg1 dominant negative (Scott et al., 2007; Scott et al., 2004). Histological analyses show that unlike ark, dronc or drice mutants, all atg8aKG07569 mutant pupae develop normally through the time of salivary gland death (Figure 6B). Salivary glands appear normal in 6-hour atg mutant prepupal salivary glands and TUNEL-positive nuclei are not observed (data not shown), suggesting that autophagy is not required for cell survival in this tissue. However, complete salivary gland degradation is inhibited in atg8aKG07569mutants and vacuolated salivary gland cell fragments persist 24 hours apf (Figure 6B). Heat shock-induced expression of GFP-dAtg8a in atg8aKG07569 mutant pupae rescues the vacuolated salivary gland cell fragment phenotype indicating that the incomplete degradation of salivary glands is due to loss of atg8a (Figure 6C). Similarly, expression of dominant negative Atg1 lead to the presence of vacuolated salivary gland cell fragments 24 hours apf (Figure 6D). Further, reduction of atg gene function in either atg2, atg3 or atg18 mutants, or by knock-down of either atg3, atg6, atg7, or atg12 by RNAi consistently resulted in pupae that developed normally, but contained vacuolated salivary gland fragments 24 hours apf (Figures 6E, S4A–S4G). The incomplete degradation of salivary gland cells and the striking similarity of phenotypes among all 7 genotypes with altered atg gene function indicate that autophagy is required for proper salivary gland cell degradation.
Figure 6. Loss-of-function autophagy mutants inhibit salivary gland cell degradation in the presence of caspases.
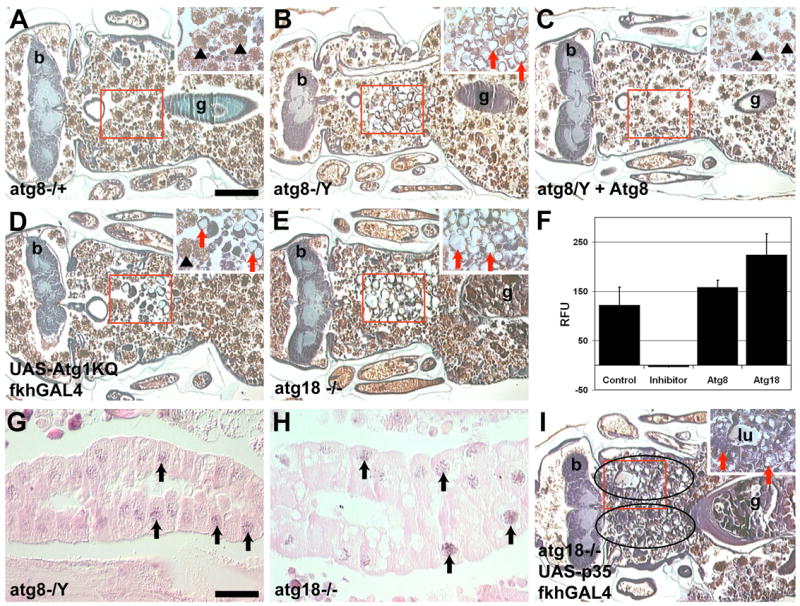
(A–E) Histological sections 24 hours apf. (A) Salivary glands are degraded in atg8aKG07569/Canton-S control pupae. (B) atg8aKG07569 mutant pupae contain vacuolated salivary gland cellular fragments. (C) Heat shock induced expression of hsdAtg8a-GFP rescued the vacuolated salivary gland phenotype of atg8aKG07569 mutant pupae. (D) Atg1KQ expression prevents complete salivary gland destruction and vacuolated salivary gland cell fragments persist. (E) atg18KG03090/Df(3L)66C-G28 mutant pupae contain vacuolated salivary gland cell fragments. (F) Cleavage of the caspase substrate DEVD-AMC was measured in whole pupae at 4 hours apf in: Canton-S control, Canton-S plus Ac-DEVD-CHO inhibitor, atg8aKG07569 mutant pupae and atg18KG03090/Df(3L)Exel6112 mutant pupae. Data is presented as the mean ± SE. (G–H) TUNEL positive nuclei (black arrows) are present in salivary glands of (G) atg8aKG07569 and (H) atg18KG03090/Df(3L)Exel6112 mutant pupae. (I) Expression of p35 in the salivary glands of atg18KG03090/Df(3L)Exel6112 mutant pupae leads to increased salivary gland persistence. Scale bar in (A) is 200 μm and (A–E and I) are the same magnification. Scale bar in (G) is 50 μm and (G–H) are the same magnification. Red boxes indicate the region of higher magnification shown in the insets for each image. Red arrows point to salivary gland fragments. Black arrowheads point to fat body that is present in the area after the salivary gland has degraded. Symbols are (b) brain, (g) gut and (lu) lumen.
Studies in cell lines have implicated autophagy in cell death (Shimizu et al., 2004; Yu et al., 2004); however, this promotion of cell death by autophagy has only been studied in the context of impaired apoptosis factors. We detect cleavage of the caspase substrate DEVD-AMC in atg8a and atg18 mutant pupae similar to control Canton-S pupae (Figure 6F). Further, we detect TUNEL-positive nuclei in intact 13.5-hour atg8a and atg18 mutant salivary glands (Figures 6G and 6H). Significantly, combined inhibition of caspases and autophagy by expression of p35 in the salivary glands of atg18 loss-of-function mutants, or with dominant negative Atg1KQ, results in an increase in the persistence of salivary gland tissue (Figures 6I, S5A). Similar to ark and dronc mutants, many of the p35-expressing atg18 mutants and p35-and Atg1KQ-expressing pupae display developmental arrest, however the salivary glands are more intact than those in ark or dronc mutants alone (Figures S3A, S3B, and S5B–C). Thus autophagy is required for salivary gland cell death and acts in combination with caspases for complete cell removal in the context of development.
We tested whether induction of autophagy was sufficient to induce cell death in salivary glands by expressing Atg1, which was previously shown to be sufficient to induce autophagy and ectopic cell death in fat (Scott et al., 2007). Lysotracker is an acidophilic dye that has been used to detect autophagy (Scott et al., 2004), and we used it as an alternative to GFP-LC3 because of a GFP reporter that is associated with the Atg1 transgene. Expression of UAS-Atg1GS10797results in the premature induction of high levels of lysotracker staining in the salivary glands of wandering larvae, and these glands are condensed and degraded compared to control glands at the same stage (Figures 7A and 7B). Continued expression of Atg1 in salivary glands leads to almost complete premature degeneration of this tissue by 6 hours apf using either a strong (UAS-Atg168) or weaker (UAS-Atg1GS10797) transgene (Figures 7C–7D, and data not shown). In contrast to previous findings in fat body where high levels of autophagy led to caspase induction and cell death, we observe significant salivary gland degradation in the absence of TUNEL-positive staining (Figure 7E). Consistent with the lack of TUNEL staining in the Atg1-expresssing pupae, inhibition of caspases by expression of p35 did not suppress the Atg1-induced premature cell death phenotype (Figure 7F). In contrast, inhibition of autophagy by expression of atg12-IR did suppress the Atg1-induced cell death (Figure 7G). Together these results indicate that Atg1 does not require caspases, but does require autophagy, for cell death in salivary glands. Finally, we proposed that over-expression of growth regulators prevented complete gland degradation by blocking the developmental induction of autophagy. To test this hypothesis, we co-expressed Dp110 with Atg1 to determine if induction of autophagy would suppress the Dp110 phenotype. Indeed, Dp110- and Atg1GS10797-expressing pupae have normal sized salivary glands 6 hours apf that are completely degraded by 24 hours apf (Figure 7H and data not shown). Together, the incomplete degradation of salivary glands in atg gene loss-of-function mutants, and the induction of premature salivary gland degradation in Atg1 gain-of-function animals, demonstrates that autophagy is both necessary and sufficient to mediate autophagic cell death during development.
Figure 7. Expression of Atg1 induces caspase-independent degradation of salivary glands.
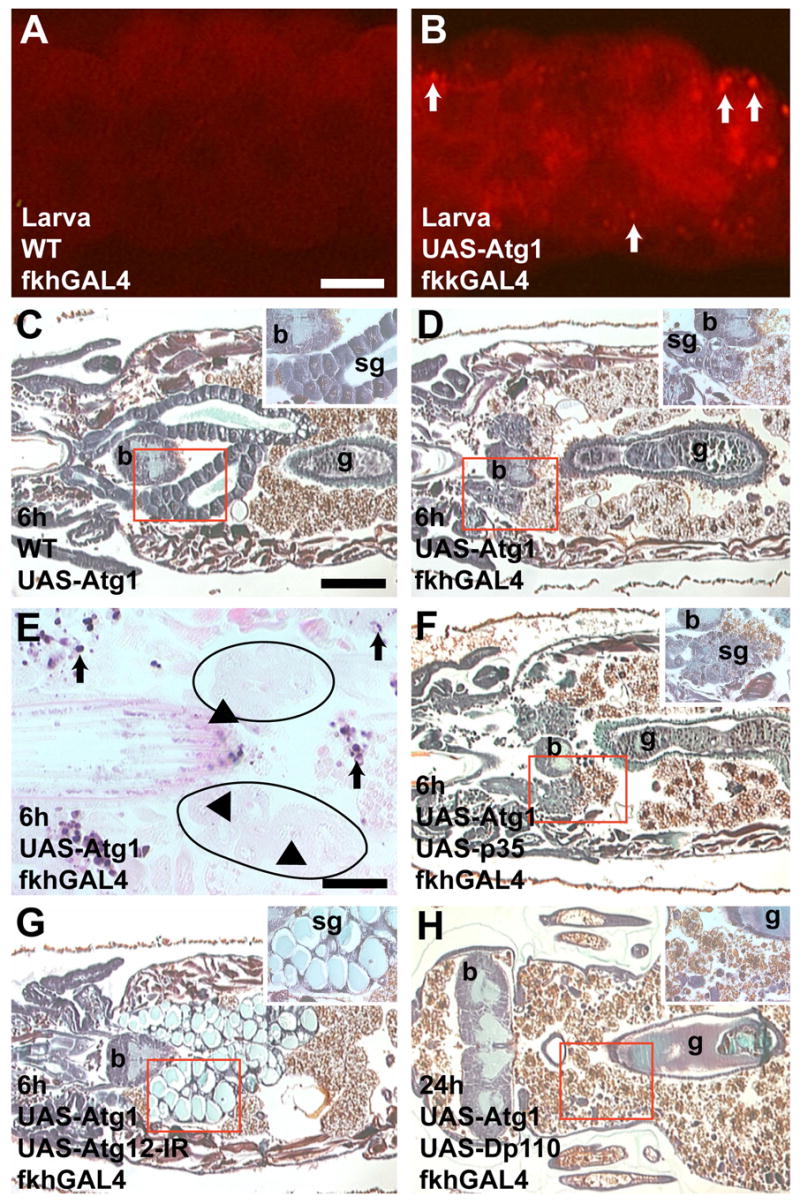
(A–B) Lysotracker staining detects autophagy. (A) Little to no lysotracker staining is observed in Canton-S; fkhGAL4 control salivary glands from feeding larvae. (B) Many lysotracker positive spots are detected in feeding larval salivary glands expressing Atg1GS10797 (white arrows). (C) Paraffin sections 6 hours apf show that intact glands are present in UAS-Atg1/Canton-S control pupae. (D) Atg1GS10797 expression causes premature degradation of salivary glands. (E) No TUNEL-positive nuclei are present 6 hours apf in Atg1GS10797-expressing salivary glands. Black arrowheads point to TUNEL-negative nuclei within the salivary glands. Black arrows indicate TUNEL-positive cells in adjacent tissues. (F) Inhibition of caspases by co-expression of p35 does not suppress the Atg1GS10797 cell degradation phenotype. (G) Inhibition of autophagy by co-expression of atg12-IR suppresses the Atg1GS10797 cell degradation phenotype. (H) Co-expression of Atg1GS10797 with Dp110 leads to complete salivary gland degradation. Scale bar in (A) is 75 μm and (A–B) are the same magnification. Scale bar in (C) is 200 μm and (C–D and F–H) are the same magnification. Scale bar in (E) is 50 μm. Red boxes indicate the region of higher magnification shown in the insets for each image. Symbols are (b) brain, (sg) salivary gland, and (g) gut.
DISCUSSION
Growth influences cell degradation and death
Our studies indicate that arrest of PI3K-dependent growth is an important determinant of autophagic cell death of salivary glands during Drosophila development. Maintenance of growth by expression of either activated Ras, Dp110, or Akt in salivary glands is sufficient to inhibit salivary gland degradation. It is possible that the larger Dp110-, Akt- and RasV12-expressing salivary glands simply have more material to degrade, and this is why they persist. We suspect this is not the case, however, as Dp110-expressing glands are larger than RasV12-expressing glands, yet RasV12-expressing glands are less degraded. Although PI3K-dependent growth inhibits autophagy, growth could influence other downstream targets. However, the Atg1-induced suppression of the Dp110 persistent salivary gland phenotype and the persistence of vacuolated salivary gland cell fragments in atg loss-of-function mutants support our conclusion that growth arrest and autophagy are required for proper salivary gland degradation.
Ras and class I PI3K signaling are complex, and cross-talk occurs between these pathways (Prober and Edgar, 2002). Although our data indicate that both activated Ras and PI3K have similar effects on salivary gland cell growth and inhibition of autophagy, we observe that Ras-expressing cells were more intact 24 hours apf. We detect caspase activity in Dp110-and Akt-expressing glands, and speculate that part of the degradation observed in Dp110 and Akt glands was due to caspases. Indeed, combining Dp110 expression with caspase inhibition resulted in intact salivary glands. This additive phenotype indicates that multiple degradation pathways are involved in autophagic cell death in vivo. Caspases were also active in Ras-expressing glands that were predominantly intact; thus activated Ras likely influences factors separate from caspases and the PI3K pathway. Ras regulates PI3K-independent pathways including MAPK and the cell cycle. Proliferating cells usually double in size prior to division, and because of this, cell growth and division are often considered synonymous. Our studies demonstrate that although expression of either Myc or CyclinD with Cdk4 was sufficient to induce nuclear size, they did not inhibit salivary gland degradation. These data support the conclusion that growth arrest, but not cell cycle arrest, is an important determinant of salivary gland autophagic cell death. While many studies have defined relationships between cell cycle arrest and cell death (Evan and Vousden, 2001), this study defines a unique relationship between cell growth arrest and cell death.
Caspase-independent degradation pathways are required for autophagic cell death
Given autophagy’s well established function in cell survival, a role for autophagy in cell death seems paradoxical (Baehrecke, 2005; Levine and Yuan, 2005). The discovery that caspases function in cells dying with a Type II autophagic morphology led to speculation that all programmed cell death is regulated by apoptosis factors. Further, the preponderance of in vitro evidence shows a role for autophagy in cell death when caspases or apoptosis factors are inhibited (Shimizu et al., 2004; Yu et al., 2004). We find that reduced function of any one of seven atg genes inhibits salivary gland degradation. The incomplete degradation of salivary glands in multiple atg loss-of-function mutants provides the first in vivo evidence that autophagy and atg genes are required for proper degradation of cells during developmental cell death. Caspase activity and caspase-dependent DNA fragmentation occurs in these atg mutants, indicating that autophagy is a caspase-independent degradation pathway required for complete cell degradation in autophagic cell death during development. Further, induction of autophagy by Atg1 expression leads to premature caspase-independent salivary gland degradation. Our data do not exclude a role for caspases in autophagic cell death. Either inhibition of caspases by p35 or reduced atg gene function result in delayed and incomplete degradation of salivary glands, and the combined inhibition of caspases with reduced atg function results in increased persistence of this tissue. These data suggest that autophagy and caspases function in parallel pathways during salivary gland cell death, and that both independently contribute to cell destruction. Further, the presence of both autophagy and caspases appears to be more typical of autophagic cell death that occurs under physiological conditions. Autophagic cell death models of mammary lumen formation and embryonic cavitation, as well as amphibian developmental cell death, all involve both processed caspase-3 and autophagy (Debnath et al., 2002; Mills et al., 2004; Qu et al., 2007; Schreiber and Brown, 2003).
The designations of type I apoptotic death and type II autophagic death are based on morphological criteria. Our studies indicate that cell morphology likely reflects difference in the factors that are used to activate cell death and degrade the dying cell. The degradation of salivary glands in caspase mutants indicate that caspase-independent factors are involved in autophagic cell death. The presence of autophagosomes in dying salivary glands led us to investigate cell death in atg gene mutants, and we observed stronger defects in salivary gland degradation with perturbed atg gene function than with drice (Muro et al., 2006), ark, and dronc mutants. These data indicate that cell morphology is informative given that it suggested autophagy is involved in the death of salivary glands. However, it is important to note that cell death classification that is based on morphology can be misleading, as salivary glands clearly use both caspases and autophagy, degradation mechanisms that had been speculated to be strictly associated with a single morphological form of cell death.
The role of autophagy is context-dependent
Now that it is clear that autophagy participates in cell death under some circumstances, it will be critical to determine how autophagy participates in cell killing and removal. A recent study showed that autophagy is required to generate the energy needed to promote phagocytosis signaling in an in vitro model of embryonic cavitation (Qu et al., 2007). We do not believe that this is the role of autophagy in salivary glands, as no phagocytosis is observed during salivary gland death (Martin and Baehrecke, 2004). Alternatively, autophagy may be used to recruit and degrade factors that promote cell survival, such as the degradation of cytoplasmic catalase in mouse L929 cells (Yu et al., 2006). Finally, extreme levels of autophagy may be sufficient to cause a metabolic catastrophe by degrading substrates and mitochondria that are needed for energy (Lum et al., 2005). The latter possibility does exist in salivary glands, as expression of the Atg1 kinase is sufficient to induce the death of fat (Scott et al., 2007) and salivary gland cells. Unlike fat cells, elevated autophagy does not induce caspase-dependent DNA fragmentation in salivary gland cells, and expression of p35 does not inhibit Atg1-induced death.
The prevalence of apoptosis and the potent killing potential of caspases raise the question of why autophagy participates in developmental cell death. In the context of Drosophila and other insects, larval cells have a modified endoreplication cell cycle that results in the production of gigantic cells. The number and size of cells may prohibit engulfment and digestion by phagocytes, and autophagy may be necessary for self-degradation. Further, the life history of the organism may inform us why autophagy participates in the destruction of tissues. Drosophila do not feed during the 3 day period of metamorphosis. Thus, the differentiation and morphogenesis of the entire adult occurs in the absence of food, and the resources to build the adult fly must come from reserves that are set aside during larval development. One important source of these resources is the fat that exhibits elevated levels of autophagy at the onset of metamorphosis (Rusten et al., 2004). Several other large larval tissues are destroyed by autophagic cell death during metamorphosis including the midgut (Lee et al., 2002) and salivary glands (Lee and Baehrecke, 2001). We speculate that like fat, catabolism of these tissues by autophagy provides resources that are needed to construct the adult. Similarly, we speculate that the large number of autophagosomes observed in dying amphibian cells may serve to recycle nutrients during metamorphosis when these animals do not feed (Fox, 1975; Shi and Ishizuya-Oka, 1996).
These studies indicate that we should be cautious when considering autophagy to be either a cell survival or cell death process. Perhaps it is useful to consider autophagy for what it is; a catabolic process that contributes to many cellular and biological processes. This is not that different from the caspase proteases that are widely considered to be apoptosis proteases, as it is now clear that caspases also function in cell differentiation (Kuranaga and Miura, 2007). Future studies are likely to show that autophagy functions in many cell types, and that its contribution to cell survival and cell death are dependent on the type and physiological context of the cell.
EXPERIMENTAL PROCEDURES
Histology
For all studies, flies were reared and maintained at 25°C. For controls, wild-type Canton-S Drosophila were crossed to either fkhGAL4/fkhGAL4, the experimental UAS-transgene line, or the mutant being analyzed. UAS-transgene lines were crossed to fkhGAL4/fkhGAL4 to drive transgene expression specifically in the salivary glands. Detailed genotype information describing the UAS-transgene strains and the loss-of-function mutants can be found in Supplemental Methods. Animals of the indicated genotypes were aged to 6, 13.5 or 24 hours apf, fixed in FAAG for paraffin embedding, sectioned and either stained with Weigert’s Hematoxylin and Pollack Trichrome as previously described (Muro et al., 2006) or analyzed by TUNEL using the Apoptag kit (Chemicon) as previously described (Lee and Baehrecke, 2001) and imaged on a Zeiss Axiophot II microscope. For all experiments, a minimum of 10 pupae were examined histologically for each genotype. Nuclear area was measured using ImageJ software (Abramoff et al., 2004). Area measurements represent the average nuclear size for each genotype; a minimum of 8 nuclei per gland were measured from 7 glands glands for each genotype.
Fluorescence microscopy
To detect PI3K activity, fkhGAL4/fkhGAL4; tGPH/tGPH flies were crossed to Canton-S as control, or to UAS-Dp110, UAS-Akt, or UAS-RasV12 as experimentals. Progeny were either picked from food as feeding L3 larvae or aged to 6 and 13.5 hours apf. Salivary glands were dissected and imaged immediately without fixation on a Zeiss Axiophot II microscope with fluorescence. Cell area was measured using ImageJ software. Area measurements represent the average cell size for each genotype; a minimum of 4 cells per gland were measured from 4 different glands for each genotype.
To assay autophagy, fkhGAL4/fkhGAL4; UAS-GFP-LC3/UAS-GFP-LC3 flies were crossed to Canton-S as control or to UAS-Dp110, UAS-Akt, or UAS-RasV12 as experimentals. Progeny were either picked from food as feeding L3 larvae or aged to 6 and 13.5 hours apf. Salivary glands were dissected and imaged immediately without fixation using a Zeiss Axiophot II microscope with fluorescence. The number of GFP-LC3 spots was counted per field imaged and a minimum of 10 fields were analyzed per genotype.
For lysotracker staining, salivary glands were dissected from the wandering larvae of either Canton-S; fkhGAL4 as controls or UAS-Atg1GS10797; fkhGAL4 as experimental and exposed to a 1/10,000 dilution of lysotracker-Red (Molecular Probes) in PBS for 5 minutes. Glands were rinsed twice in PBS, and imaged immediately using a Zeiss Axiophot II microscope with fluorescence.
Immunohistochemistry
Salivary glands were dissected from control (Canton-S) or experimental (w, fkhGAL4; UAS-Dp110) pupae at 6 and 13 hours apf, fixed and processed as previously described with primary antibodies to cleaved caspase-3 (Cell Signaling Technology) and nuclear lamin (Developmental Studies Hybridoma Bank) that were detected with appropriate secondary antibodies (Martin and Baehrecke, 2004). TOTO-3 was added to label nuclei (Molecular Probes) and the stained glands were imaged using a Zeiss Axiovert 100M confocal microscope.
Caspase Substrate Assays
Caspase assays were perfomed using the EnzChek Caspase-3 Assay Kit #1 (Molecular Probes). Briefly, whole pupae staged at 4 hours apf or salivary glands dissected at 13.5 hours apf were homogenized in lysis buffer, lysates were cleared by centrifugation and assayed with Z-DEVD-AMC to detect caspase-3 activity. Ac-DEVD-CHO was added to control Canton-S extracts as a competitive inhibitor to confirm specificity of the assay to measure caspase-3 activity. At least 3 replicates were performed for each genotype.
Supplementary Material
Acknowledgments
We thank A. Lee and N. Aita for technical assistance, T. Berry for statistical analyses, the Developmental Studies Hybridoma Bank for lamin antibodies, A. Bergmann, B. Edgar, S. Leevers, L. Johnston, T. Neufeld, T. Rusten, O. Schuldiner, M. Birinbaum, G. Rubin, and the Bloomington Stock Center for fly stocks, and D. Brown, T. Neufeld and members of the Baehrecke lab for helpful discussions and comments on the manuscript. This work was supported NIH grants GM59136 and GM079431 to EHB.
Footnotes
Publisher's Disclaimer: This is a PDF file of an unedited manuscript that has been accepted for publication. As a service to our customers we are providing this early version of the manuscript. The manuscript will undergo copyediting, typesetting, and review of the resulting proof before it is published in its final citable form. Please note that during the production process errors may be discovered which could affect the content, and all legal disclaimers that apply to the journal pertain.
References
- Abramoff MD, Magelhaes PJ, Ram SJ. Image Processing with ImageJ. Biophotonics Int. 2004;11:36–42. [Google Scholar]
- Arsham AM, Neufeld TP. Thinking globally and acting locally with TOR. Curr Opin Cell Biol. 2006;18:589–597. doi: 10.1016/j.ceb.2006.09.005. [DOI] [PubMed] [Google Scholar]
- Baehrecke EH. How death shapes life during development. Nature Reviews Mol Cell Biol. 2002;3:779–787. doi: 10.1038/nrm931. [DOI] [PubMed] [Google Scholar]
- Baehrecke EH. Autophagy: dual roles in life and death? Nature Reviews Mol Cell Biol. 2005;6:505–510. doi: 10.1038/nrm1666. [DOI] [PubMed] [Google Scholar]
- Britton JS, Lockwood WK, Li L, Cohen SM, Edgar BA. Drosophila’s insulin/PI3-kinase pathway coordinates cellular metabolism with nutritional conditions. Dev Cell. 2002;2:239–249. doi: 10.1016/s1534-5807(02)00117-x. [DOI] [PubMed] [Google Scholar]
- Cantley LC, Neel BG. New insights into tumor suppression: PTEN suppresses tumor formation by restraining the phosphoinositide 3-kinase/AKT pathway. Proc Natl Acad Sci USA. 1999;96:4240–4245. doi: 10.1073/pnas.96.8.4240. [DOI] [PMC free article] [PubMed] [Google Scholar]
- Clarke PGH. Developmental cell death: morphological diversity and multiple mechanisms. Anat Embryol. 1990;181:195–213. doi: 10.1007/BF00174615. [DOI] [PubMed] [Google Scholar]
- Conlon I, Raff M. Size control in animal development. Cell. 1999;96:235–244. doi: 10.1016/s0092-8674(00)80563-2. [DOI] [PubMed] [Google Scholar]
- Datta SR, Ranger AM, Lin MZ, Sturgill JF, Ma YC, Cowan CW, Dikkes P, Korsmeyer SJ, Greenberg ME. Survival factor-mediated BAD phosphorylation raises the mitochondrial threshold for apoptosis. Dev Cell. 2002;3:631–643. doi: 10.1016/s1534-5807(02)00326-x. [DOI] [PubMed] [Google Scholar]
- de la Cova C, Abril M, Bellosta P, Gallant P, Johnston LA. Drosophila myc regulates organ size by inducing cell competition. Cell. 2004;117:107–116. doi: 10.1016/s0092-8674(04)00214-4. [DOI] [PubMed] [Google Scholar]
- Debnath J, Mills KR, Collins NL, Reginato MJ, Muthuswamy SK, Brugge JS. The role of apoptosis in creating and maintaining luminal space within normal and oncogene-expressing mammary acini. Cell. 2002;111:29–40. doi: 10.1016/s0092-8674(02)01001-2. [DOI] [PubMed] [Google Scholar]
- Evan GI, Vousden KH. Proliferation, cell cycle and apoptosis in cancer. Nature. 2001;411:342–348. doi: 10.1038/35077213. [DOI] [PubMed] [Google Scholar]
- Fox H. Aspects of tail muscle ultrastructure and its degeneration in Rana temporaria. J Embryol Exp Morphol. 1975;34:191–207. [PubMed] [Google Scholar]
- Gorski SM, Chittaranjan S, Pleasance ED, Freeman JD, Anderson CL, Varhol RJ, Coughlin SM, Zuyderduyn SD, Jones SJ, Marra MA. A SAGE Approach to Discovery of Genes Involved in Autophagic Cell Death. Curr Biol. 2003;13:358–363. doi: 10.1016/s0960-9822(03)00082-4. [DOI] [PubMed] [Google Scholar]
- Harding TM, Hefner-Gravink A, Thumm M, Klionsky DJ. Genetic and phenotypic overlap between autophagy and the cytoplasm to vacuole protein. J Biol Chem. 1996;271:17621–17624. doi: 10.1074/jbc.271.30.17621. [DOI] [PubMed] [Google Scholar]
- Harding TM, Morano KA, Scott SV, Klionsky DJ. Isolation and characterization of yeast mutants in the cytoplasm to vacuole protein targeting pathway. J Cell Bio. 1995;131:591–602. doi: 10.1083/jcb.131.3.591. [DOI] [PMC free article] [PubMed] [Google Scholar]
- Kamada Y, Funakoshi T, Shintani T, Nagano K, Ohsumi M, Ohsumi Y. Tor-mediated induction of autophagy via an Apg1 protein kinase complex. J Cell Biol. 2000;150:1507–1513. doi: 10.1083/jcb.150.6.1507. [DOI] [PMC free article] [PubMed] [Google Scholar]
- Kerr JF, Wyllie AH, Currie AR. Apoptosis: a basic biological phenomenon with wide-ranging implications in tissue kinetics. Br J Cancer. 1972;26:239–257. doi: 10.1038/bjc.1972.33. [DOI] [PMC free article] [PubMed] [Google Scholar]
- Klionsky DJ, Cregg JM, Dunn WAJ, Emr SD, Sakai Y, Sandoval IV, Sibirny A, Subramani S, Thumm M, Veenhuis M, Ohsumi Y. A unified nomenclature for yeast autophagy-related genes. Dev Cell. 2003;5:539–545. doi: 10.1016/s1534-5807(03)00296-x. [DOI] [PubMed] [Google Scholar]
- Klionsky DJ, Emr SD. Autophagy as a regulated pathway of cellular degradation. Science. 2000;290:1717–1721. doi: 10.1126/science.290.5497.1717. [DOI] [PMC free article] [PubMed] [Google Scholar]
- Kozma SC, Thomas G. Regulation of cell size in growth, development and human disease: PI3K, PKB and S6K. Bioessays. 2002;24:65–71. doi: 10.1002/bies.10031. [DOI] [PubMed] [Google Scholar]
- Kuranaga E, Miura M. Nonapoptotic functions of caspases: caspases as regulatory molecules for immunity and cell-fate determination. Trends Cell Biol. 2007;17:135–144. doi: 10.1016/j.tcb.2007.01.001. [DOI] [PubMed] [Google Scholar]
- Lee CY, Baehrecke EH. Steroid regulation of autophagic programmed cell death during development. Development. 2001;128:1443–1455. doi: 10.1242/dev.128.8.1443. [DOI] [PubMed] [Google Scholar]
- Lee CY, Clough EA, Yellon P, Teslovich TM, Stephan DA, Baehrecke EH. Genome-wide analyses of steroid- and radiation-triggered programmed cell death in Drosophila. Curr Biol. 2003;13:350–357. doi: 10.1016/s0960-9822(03)00085-x. [DOI] [PubMed] [Google Scholar]
- Lee CY, Cooksey BAK, Baehrecke EH. Steroid regulation of midgut cell death during Drosophila development. Dev Biol. 2002;250:101–111. doi: 10.1006/dbio.2002.0784. [DOI] [PubMed] [Google Scholar]
- Leulier F, Ribeiro PS, Palmer E, Tenev T, Takahashi K, Robertson D, Zachariou A, Pichaud F, Ueda R, Meier P. Systematic in vivo RNAi analysis of putative components of the Drosophila cell death machinery. Cell Death Differ. 2006;13:1663–1674. doi: 10.1038/sj.cdd.4401868. [DOI] [PubMed] [Google Scholar]
- Levine B, Yuan J. Autophagy in cell death: an innocent convict? J Clin Invest. 2005;116:2679–2688. doi: 10.1172/JCI26390. [DOI] [PMC free article] [PubMed] [Google Scholar]
- Lowe SW, Cepero E, Evan G. Intrinsic tumour suppression. Nature. 2004;432:307–315. doi: 10.1038/nature03098. [DOI] [PubMed] [Google Scholar]
- Lum JJ, Bauer DE, Kong M, Harris MH, Li C, Lindsten T, Thompson CB. Growth factor regulation of autophagy and cell survival in the absence of apoptosis. Cell. 2005;120:237–248. doi: 10.1016/j.cell.2004.11.046. [DOI] [PubMed] [Google Scholar]
- Martin DN, Baehrecke EH. Caspases function in autophagic cell death in Drosophila. Development. 2004;131:275–284. doi: 10.1242/dev.00933. [DOI] [PubMed] [Google Scholar]
- Martin DN, Balgley B, Dutta S, Chen J, Rudnick P, Cranford J, Kantartzis S, DeVoe DL, Lee C, Baehrecke EH. Proteomic analysis of steroid-triggered autophagic programmed cell death during Drosophila development. Cell Death Differ. 2007;14:916–923. doi: 10.1038/sj.cdd.4402098. [DOI] [PubMed] [Google Scholar]
- Mills KR, Reginato M, Debnath J, Queenan B, Brugge JS. Tumor necrosis factor-related apoptosis-inducing ligand (TRAIL) is required for induction of autophagy during lumen formation in vitro. Proc Natl Acad Sci USA. 2004;101:3438–3443. doi: 10.1073/pnas.0400443101. [DOI] [PMC free article] [PubMed] [Google Scholar]
- Moreno E, Basler K. dMyc transforms cells into super-competitors. Cell. 2004;117:117–129. doi: 10.1016/s0092-8674(04)00262-4. [DOI] [PubMed] [Google Scholar]
- Muro I, Berry DL, Huh JR, Chen CH, Huang H, Yoo SJ, Guo M, Baehrecke EH, Hay BA. The Drosophila caspase Ice is important for many apoptotic cell deaths and for spermatid individualization, a nonapoptotic process. Development. 2006;133:3305–3315. doi: 10.1242/dev.02495. [DOI] [PubMed] [Google Scholar]
- Petiot A, Ogier-Denis E, Blommaart EF, Meijer AJ, Codogno P. Distinct classes of phosphatidylinositol 3′-kinases are involved in signaling pathways that control macroautophagy in HT-29 cells. J Biol Chem. 2000;275:992–998. doi: 10.1074/jbc.275.2.992. [DOI] [PubMed] [Google Scholar]
- Prober DA, Edgar BA. Interactions between Ras1, dMyc, and dPI3K signaling in the developing Drosophila wing. Genes Dev. 2002;16:2286–2299. doi: 10.1101/gad.991102. [DOI] [PMC free article] [PubMed] [Google Scholar]
- Qu X, Zou Z, Sun Q, Luby-Phelps K, Cheng P, Hogan RN, Gilpin C, Levine B. Autophagy gene-dependent clearance of apoptotic cells during embryonic development. Cell. 2007;128:931–946. doi: 10.1016/j.cell.2006.12.044. [DOI] [PubMed] [Google Scholar]
- Rusten TE, Lindmo K, Juhasz G, Sass M, Seglen PO, Brech A, Stenmark H. Programmed autophagy in the Drosophila fat body is induced by ecdysone through regulation of the PI3K pathway. Dev Cell. 2004;7:179–192. doi: 10.1016/j.devcel.2004.07.005. [DOI] [PubMed] [Google Scholar]
- Schreiber AM, Brown DD. Tadpole skin dies autonomously in response to thyroid hormone at metamorphosis. Proc Natl Acad Sci USA. 2003;100:1769–1774. doi: 10.1073/pnas.252774999. [DOI] [PMC free article] [PubMed] [Google Scholar]
- Schweichel JU, Merker HJ. The morphology of various types of cell death in prenatal tissues. Teratology. 1973;7:253–266. doi: 10.1002/tera.1420070306. [DOI] [PubMed] [Google Scholar]
- Scott RC, Juhasz G, Neufeld TP. Direct induction of autophagy by Atg1 inhibits cell growth and induces apoptotic cell death. Curr Biol. 2007;17:1–11. doi: 10.1016/j.cub.2006.10.053. [DOI] [PMC free article] [PubMed] [Google Scholar]
- Scott RC, Schuldiner O, Neufeld TP. Role and regulation of starvation-induced autophagy in the Drosophila fat body. Dev Cell. 2004;7:167–178. doi: 10.1016/j.devcel.2004.07.009. [DOI] [PubMed] [Google Scholar]
- Shi YB, Ishizuya-Oka A. Biphasic intestinal development in amphibians: Embryogenesis and remodeling during metamorphosis. Current Topics Dev Biol. 1996;32:205–235. doi: 10.1016/s0070-2153(08)60429-9. [DOI] [PubMed] [Google Scholar]
- Shimizu S, Kanaseki T, Mizushima N, Mizuta T, Arakawa-Kobayashi S, Thompson CB, Tsujimoto Y. Role of Bcl-2 family proteins in a non-apoptotic programmed cell death dependent on autophagy genes. Nature Cell Biol. 2004;6:1221–1228. doi: 10.1038/ncb1192. [DOI] [PubMed] [Google Scholar]
- Shintani T, Klionsky DJ. Autophagy in health and disease: a double-edged sword. Science. 2004;306:990–995. doi: 10.1126/science.1099993. [DOI] [PMC free article] [PubMed] [Google Scholar]
- Thumm M, Egner R, Koch B, Schlumpberger M, Straub M, Veenhuis M, Wolf DH. Isolation of autophagocytosis mutants of Saccharomyces cerevisiae. FEBS Lett. 1994;349:275–280. doi: 10.1016/0014-5793(94)00672-5. [DOI] [PubMed] [Google Scholar]
- Tsukada M, Ohsumi Y. Isolation and characterization of autophagy-defective mutants of Saccharomyces cerevisiae. FEBS Lett . 1993;1–2:169–174. doi: 10.1016/0014-5793(93)80398-e. [DOI] [PubMed] [Google Scholar]
- Yu L, Alva A, Su H, Dutt P, Freundt E, Welsh S, Baehrecke EH, Lenardo MJ. Regulation of an ATG7-beclin 1 program of autophagic cell death by caspase-8. Science. 2004;304:1500–1502. doi: 10.1126/science.1096645. [DOI] [PubMed] [Google Scholar]
- Yu L, Wan F, Dutta S, Welsh S, Liu Z, Freundt E, Baehrecke EH, Lenardo MJ. Autophagic programmed cell death by selective catalase degradation. Proc Natl Acad Sci USA. 2006;103:4952–4957. doi: 10.1073/pnas.0511288103. [DOI] [PMC free article] [PubMed] [Google Scholar]
Associated Data
This section collects any data citations, data availability statements, or supplementary materials included in this article.