

Abstract
Cell migration is an integrated process requiring the continuous coordinated assembly and disassembly of adhesion structures. How cells orchestrate adhesion turnover is only partially understood. We provide evidence for a novel mechanistic insight into focal adhesion (FA) dynamics by demonstrating that integrin cytoplasmic domain–associated protein 1 (ICAP-1) slows down FA assembly. Live cell imaging, which was performed in both Icap-1–deficient mouse embryonic fibroblasts and cells expressing active β1 integrin, shows that the integrin high affinity state favored by talin is antagonistically controlled by ICAP-1. This affinity switch results in modulation in the speed of FA assembly and, consequently, of cell spreading and migration. Unexpectedly, the ICAP-1–dependent decrease in integrin affinity allows cell sensing of matrix surface density, suggesting that integrin conformational changes are important in mechanotransduction. Our results clarify the function of ICAP-1 in cell adhesion and highlight the central role it plays in the cell's integrated response to the extracellular microenvironment.
Introduction
Adhesion to ECM is primarily mediated by integrins, a family of heterodimeric receptors (Hynes, 2002) that cluster into adhesion sites. Focal adhesions (FAs) have been shown to form a scaffold that first sense and then transform extracellular cues into cellular responses and, in turn, transmit the contractile intracellular tensions to the ECM (Bershadsky et al., 2003; Ingber, 2003; Chen et al., 2004). Because of their involvement in cell motility and matrix remodeling, adhesion sites are necessarily dynamic structures that are able to assemble and disassemble. FA assembly takes place at the leading edge of membrane protrusions, whereas disassembly occurs both at the cell rear and at the base of protrusions. The molecular mechanisms controlling FA turnover have been partly characterized. They require Rho family GTPases, integrin engagement, and coordinated interaction between integrins and structural/signaling molecules as well as actin-binding proteins, actin microfilaments, and microtubules (Raftopoulou and Hall, 2004; Webb et al., 2004; Ezratty et al., 2005). Talin, a direct cytoplasmic β integrin–binding protein, is involved in adhesion site formation, reinforcement, and stabilization (Albiges-Rizo et al., 1995; Priddle et al., 1998; Giannone et al., 2003; Jiang et al., 2003) as well as in integrin activation and local PIP2 generation (Martel et al., 2001; Calderwood et al., 2002; Tadokoro et al., 2003). Integrin clustering requires the formation of complexes composed of activated integrins, immobilized ligands, talin, and PIP2 (Cluzel et al., 2005). Additionally, the calpain family regulates cell motility, partly by down-regulating integrin-mediated adhesion complexes (Bhatt et al., 2002) and through talin cleavage, a rate-limiting step during adhesion turnover, and is critical for FA disassembly (Franco et al., 2004). The current understanding is that integrin-containing adhesion sites function as signal transduction centers. Consequently, tight regulation of integrin affinity is crucial for adhesion signaling (Bennett, 2005). Integrins adopt high and low affinity conformations, and ligand–integrin binding is often preceded by intracellular changes, resulting in increased affinity (Ginsberg et al., 2005). Crystal structure analysis suggests a bent, hooklike conformation for the extracellular domain in the inactive state and an extended conformation in the active state (Liddington and Ginsberg, 2002; Takagi and Springer, 2002). Talin binding disrupts a salt bridge between the α and β subunits, leading to integrin activation (Luo et al., 2004; Vinogradova et al., 2004). Evidence suggests that the binding of a complex including talin, Rap1-GTP–interacting adaptor molecule, Rap1, and vasodilator-stimulated phosphoprotein (VASP) to the integrin cytoplasmic tail is a common final step in integrin activation (Han et al., 2006).
Among integrin partners, integrin cytoplasmic domain–associated protein 1 (ICAP-1) encompassing a phosphotyrosine-binding domain interacts specifically with the cytoplasmic tail of β1 integrin at the membrane-distal NPXY motif. The increase of β1 integrin–dependent cell motility on fibronectin (FN) upon ICAP-1 overexpression (Chang et al., 1997, 2002; Zhang and Hemler, 1999) and cell rounding up after overexpression of a phosphomimetic mutant of ICAP-1 at the CaMKII site (Bouvard and Block, 1998) suggest that ICAP-1 might regulate β1-integrin function. Moreover, talin and ICAP-1 compete in vitro for integrin binding, and high ICAP-1 concentrations disrupt FA (Bouvard et al., 2003). ICAP-1 and β1 integrin are colocalized at the leading edges of cells during the early stages of spreading (Fournier et al., 2002). This facet of ICAP-1 in FA dynamics, which is obviously regulatory and transitory, prompted us to determine in more detail the role played by ICAP-1 in adhesion site dynamics.
In this study, we show that Icap-1–deficient mouse embryonic fibroblasts (MEFs) display defects in cellular spreading and migration correlating with the redistribution of FA, a modification in FA dynamics, and an increase in integrin affinity. These defects could be mimicked by increasing either integrin affinity or the surface density of the underlying matrix. By modulating integrin affinity, ICAP-1 allows the cell to adapt its adhesion strength and rate of migration to changes in the matrix surface density. These data point not only to the existence of specific molecules involved in FA assembly or disassembly signaling pathways but also to the control of FA assembly and matrix sensing through the fine-tuning of integrin affinity.
Results
ICAP-1 loss alters the distribution and morphometry of FA
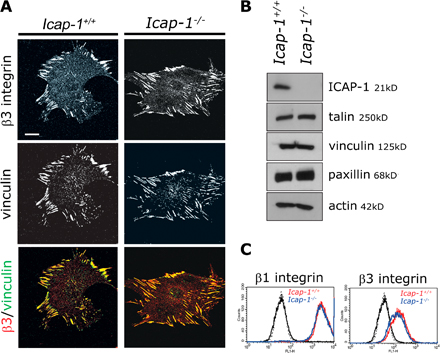
To figure out the role of ICAP-1 in FA dynamics, we compared the adhesive behavior of MEFs isolated from wild-type (WT) and Icap-1–deficient mice embryos as well as in WT, Icap-1–null, and Icap-1 rescued osteoblasts. Immunostaining revealed paxillin- and β1 integrin–containing FAs to be distributed throughout the ventral cell surface in Icap-1–null MEFs, whereas WT cells exhibited mostly peripheral FAs (Fig. 1 A). In contrast, distribution of the β3 integrin (known not to interact with ICAP-1)–containing FA was not modified in Icap-1–null cells (Fig. S1 A, available at http://www.jcb.org/cgi/content/full/jcb.200707142/DC1). FA distribution defects were ICAP-1 dependent and not cell specific because centrally located FAs in Icap-1–null osteoblasts were redistributed peripherally after Icap-1 rescue (Fig. 1 B). This altered FA distribution was also associated with a modification of their morphometry. β1 integrin–containing FAs on FN were significantly larger in Icap-1–null fibroblasts, whereas the size of β3 integrin–containing FAs remained identical for both cell types (Fig. 1 C). β1-integrin clustering within FA, which was estimated by the mean fluorescence intensity (MFI), was increased by about twofold in Icap-1–null cells compared with WT cells (Fig. 1 C). Then, we analyzed the putative role of ICAP-1 in the regulation of FA composition (Fig. 1 D). Talin, vinculin, and paxillin as well as surface β1 and β3 integrins were expressed at similar levels in both cell types (Fig. S1, B and C). Constant adaptor protein/integrin ratios in both cell types indicates that ICAP-1 did not interfere with FA constitution and reveals that β1 integrins highly clustered within FA in null cells are fully competent to bind their intracellular partners (Fig. 1 D). Thus, the increased size of FAs in Icap-1–null MEFs could be attributed to increased β1-integrin clustering and not to an indirect change in adhesion protein expression or to a modification in the cell surface expression of β3 and β1 integrins.
Figure 1.

ICAP-1 loss induces the central redistribution of FAs and increases β1-integrin clustering. (A and B) Confocal images obtained with Icap-1+/+ and Icap-1 −/− MEF cells (A) or Icap-1+/+, Icap-1 −/−, and Icap-1rescue osteoblasts (B). Cells were cultured overnight on 10 μg/ml FN and processed for immunofluorescence labeling to visualize β1 integrin (9EG7), paxillin, and vinculin. Note the increased number of FAs at the cell surface underlying the main cell body in Icap-1 −/− MEF cells and osteoblasts and the exclusive peripheral distribution of adhesion sites in rescued osteoblasts. (C and D) Icap-1+/+ and Icap-1 −/− MEF cells were plated on 10 μg/ml FN and allowed to spread for 2 h. Immunostaining was processed to visualize vinculin, paxillin, and β1 or β3 integrins. Confocal images of each cell type were acquired and subjected to image analysis with MetaMorph software. (C) The mean surface of β3 or β1 integrins containing FA (top histogram) and the MFI of β1 and β3 integrins in vinculin-stained FAs (bottom histogram) were measured in Icap-1+/+ and Icap-1 −/− MEF cells. Right images show β1 and β3 integrin–containing FAs in both cell types. (D) The ratio of the mean intensities of vinculin-, paxillin-, or talin-containing FAs normalized to β1 integrin was then estimated. Experiments were performed in duplicate, and at least 20 cells were analyzed for each immunostaining. Error bars indicate SD. Bars, 20 μm.
Icap-1–null cells exhibit a shift in the optimum ECM surface density required for cell migration and spreading
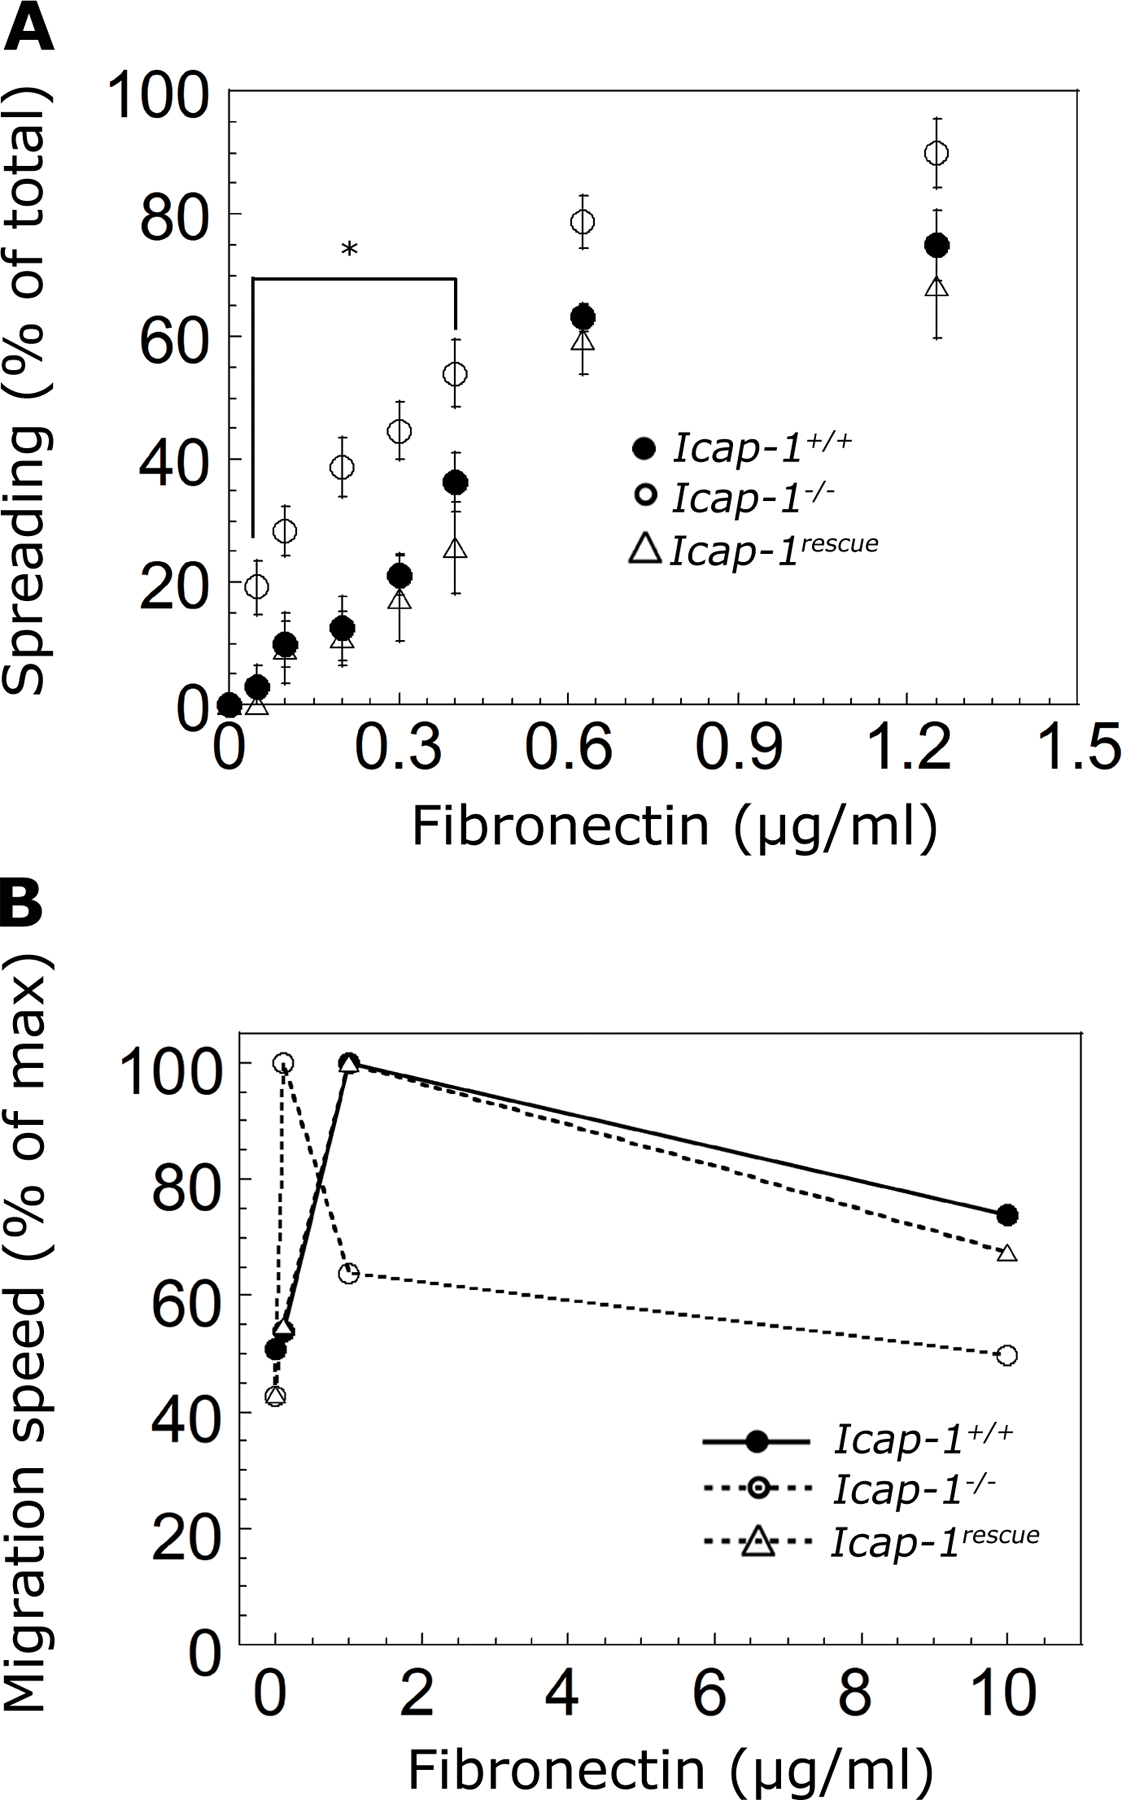
As the modification in the FA pattern and morphometry reflects cell adhesion and migratory defects, we monitored the migration rate of MEFs spread on increasing concentrations of β1 integrin–engaging matrices, FN and type I collagen (CL). The typical bell-shaped curve observed for WT cells was shifted toward the lower densities of ECM substrates for Icap-1–deficient cells. Indeed, the optimal matrix concentration required for the maximum migration of Icap-1–deficient cells was reduced 10-fold and 20-fold for FN and CL coatings, respectively (Fig. 2 A). A very similar result was obtained with FN using time-lapse video microscopy (Fig. 2 B).
Figure 2.

ICAP-1 loss shifts the optimum substrate concentration for migration and facilitated adhesion. (A) The migration of Icap-1+/+ and Icap-1 −/− MEF cells was studied in a random chemotactic transwell assay. Cells were seeded in transwell chambers coated on both sides with increasing concentrations of FN or CL ranging from 0.5 to 20 μg/ml. After 8 h, cell migration was stopped, and cells were stained and fixed by Coomassie blue. The cells localized on the underside of the membrane were counted, and the number of cells per field was used to quantify cell migration. (B) The migration speed of Icap-1+/+ and Icap-1 −/− MEF cells was determined on various FN concentrations by using time-lapse phase-contrast video microscopy and cell tracking with MetaMorph software. 20–40 cells were photographed for each experimental condition at 4-min intervals over an 8-h period. The maximal migration speed was used to set up 100% for each cell type. (A and B) Error bars indicate SD of at least thee individual experiments. (C and D) Spreading assay of Icap-1+/+ and Icap-1 −/− MEF cells (C) as well as Icap-1+/+, Icap-1 −/−, and Icap-1 rescue osteoblasts (D) on increasing substrate densities. Cells were seeded on various concentrations of FN- or CL-coated surfaces and were allowed to spread for 1 h 30 min. Round and flattened cells were counted, and spread cells were expressed as the percentage of total cell number. The inset represents the same spreading assay with increasing concentrations of FN. Each data point represents the mean of at least three separate experiments, and error bars represent SD. *, P ≤ 0.03.
Because migratory properties were modified in Icap-1–null MEFs, we investigated the consequences of ICAP-1 loss on cell spreading. The densities required to reach similar spreading levels on both matrices were much lower with Icap-1–null cells than with WT cells. Indeed, with FN, 50% spreading was achieved at a 0.5-μg/ml coating concentration for Icap-1–null cells versus 1 μg/ml for WT cells (Fig. 2 C). Similar results were obtained with CL: 50% spreading occurred at a coating concentration of 5 μg/ml for Icap-1–null cells compared with 25 μg/ml for WT cells (Fig. 2 C). Icap-1–null cells appeared to exhibit a stronger interaction with FN and CL and, consequently, spread at lower densities of these ECM substrates. In both migration and spreading assays, the differences between WT and mutant cells were more pronounced using CL. This probably reflects the more restricted use of β1 integrins on CL. On the other hand, the expression of ICAP-1 in Icap-1–null MEFs restores cell spreading and migration similarly to what was observed for WT MEFs (Fig. S2, A and B; available at http://www.jcb.org/cgi/content/full/jcb.200707142/DC1), proving that the altered migration was indeed caused by the loss of endogenous ICAP-1. A similar effect was also observed with osteoblasts: at the FN-coating concentration of 0.3 μg/ml, the totality of Icap-1–null osteoblasts were fully spread, whereas only 50% of WT and rescued osteoblasts were spread under identical experimental conditions, demonstrating that this defect was still ICAP-1 dependent but not cell specific (Fig. 2 D). In agreement with the specificity of ICAP-1 for β1 integrin, migration and adhesion behaviors of WT and Icap-1–null MEFs on vitronectin (VN) coating were not significantly different. This demonstrates that ICAP-1 loss did not alter β3 integrin–mediated adhesion (Fig. S3, A and B).
ICAP-1 slows down the talin recruitment into FAs
The fact that Icap-1–null cells migrated and spread at lower matrix densities might reflect defects in adhesion dynamics. If ICAP-1 was involved in FA dynamics, differences are expected in the exchange or recruitment rate of some FA components between Icap-1–null cells and WT cells. To address this point, measurements of FRAP experiments were made using EGFP-fused vinculin or talin (Fig. 3). Single FA in the lamella was photobleached, and their fluorescence recovery was recorded. Recovery times (τ) were calculated for both fusion proteins. Our results revealed that EGFP-vinculin recruitment was four times faster than EGFP-talin in WT MEF cells spread on FN (Fig. 3 A). However, no difference between WT and Icap-1–deficient MEFs was observed in the incorporation speed of EGFP-vinculin into FAs, demonstrating that vinculin recruitment is ICAP-1 independent. Conversely, the recovery half-time associated with EGFP-talin was significantly lower in Icap-1–deficient MEFs, suggesting a faster recruitment of EGFP-talin in cells lacking ICAP-1. This conclusion is in line with the proposed competitive binding of ICAP-1 and talin for the β1-integrin cytoplasmic domain (Bouvard et al., 2003). FRAP experiments were also performed in cells spread on β3-integrin preferential substrate, such as VN to compare talin and vinculin recruitment in case of Icap-1 deficiency (Fig. 3 B). As expected, no significant change in talin recruitment was observed in both cells spread on VN. Our results demonstrate that the function of ICAP-1 is dependent on adhesion on specific substrate.
Figure 3.

ICAP-1 loss induces a faster recruitment of talin into FAs. Icap-1+/+ and Icap-1 −/− MEF cells were seeded in LabTekII chambers coated with either 20 μg/ml FN (A) or 5 μg/ml VN (B) and were allowed to spread for 12 h. After transfection, both cell types expressing either EGFP-talin or EGFP-vinculin were subjected to FRAP experiments. Photobleaching was performed on manually delimited individual FAs localized at the edge of cells. EGFP fluorescence recovery was measured at 1-min intervals over a 15–20-min period, and the characteristic recovery time (τ) of each FA protein was estimated. At least 20 FAs were recorded for both cell types. Error bars indicate SD. The shorter recovery time, τ, of EGFP-talin in Icap-1 −/− cells indicates a higher mobility of this protein (e.g., its faster recruitment into FA). *, P ≤ 0.01.
ICAP-1 slows down FA assembly
Two key steps in cell migration are FA assembly and disassembly (Webb et al., 2004). To identify whether ICAP-1 was involved in FA turnover, WT and Icap-1–null MEF cells expressing EGFP-paxillin, EGFP-vinculin, or EGFP-VASP were monitored using time-lapse video microscopy over a 6-h period. Again, we noticed that EGFP-VASP (Fig. 4 A), EGFP-paxillin, or EGFP-vinculin (not depicted) expressed in Icap-1–null cells were mostly localized in central FAs. Cells were plated on a low concentration of FN (1 μg/ml) to promote cell migration. Turnover of FAs located at the leading edge were arbitrary decomposed into four parameters: namely, assembly (from the first appearance until the maximal pixel intensity level is reached), steady-state duration (no change of the maximal pixel intensity), disassembly rates (from the maximum pixel intensity is reached until FA is not resolvable), and total lifetime (from the first appearance of a resolvable FA until its disappearance). In Icap-1–null cells, the increase in EGFP-tagged protein intensity during FA assembly was significantly faster (Fig. 4, B and F), and the duration of the steady state was slightly shorter (Fig. 4 D) than for WT cells. In contrast, FA disassembly rates (Fig. 4, C and F) were identical for both cell types. These measurements showed that faster FA assembly associated with a minor reduction of the steady state upon ICAP-1 loss results in a shorter FA lifetime (Fig. 4, E and F). It is worth noting that this change in dynamics was not observed with Icap-1 −/− cells spread on VN, thus underlining the action of ICAP-1 on β1 integrins (Fig. S3 C). Altogether, these data suggest that ICAP-1 down-regulates cell migration and spreading by slowing down FA assembly involving β1 integrins.
Figure 4.

ICAP-1 modulates FA turnover by controlling its assembly rate. (A) Confocal images of Icap-1+/+ and Icap-1 −/− MEF cells either immunostained to visualize endogenous paxillin or transfected to express EGFP-VASP. (B–F) Icap-1+/+ and Icap-1 −/− MEF cells expressing either EGFP-paxillin, EGFP-vinculin, or EGFP-VASP were allowed to spread on 1 μg/ml FN for 12 h in a LabTekII chamber. Then, cells were imaged by time-lapse video microscopy at 4-min intervals for 6 h. The resulting data were subjected to image analysis using MetaMorph software. The mean pixel intensity of a defined FA was followed over time, and this analysis allowed the four parameters of FA turnover to be measured: measurement of the positive (B) or negative (C) variations per minute of the mean pixel intensity reflecting the assembly and disassembly rates, respectively, for each individual FA in Icap-1+/+ and Icap-1 −/− cells; the time during which the mean pixel intensity did not fluctuate corresponds to the FA steady state (D); and the total time during which EGFP-fused adhesion proteins remain localized in a FA represents the FA lifetime (E). At least 20 cells of both cell types were recorded. Each point represents an individual FA, and the horizontal bars are the mean of all FAs. (F) These four parameters were compiled in a schematic model of FA turnover in Icap-1+/+ and Icap-1 −/− cells. The higher FA assembly rate in Icap-1 −/− cells and the reduced steady-state duration induced the shortening of FA lifetime. *, P < 0.05; **, P < 104; ***, P < 106. Bar, 20 μm.
ICAP-1 is not required for FA disassembly
Previous work has highlighted an important role for microtubule networks in FA turnover (Kaverina et al., 1999; Ezratty et al., 2005). This is based on the finding that microtubule depolymerization upon nocodazole treatment increases FA assembly, whereas microtubule regrowth after nocodazole washout induces a rapid and reversible disassembly of FA. We took advantage of the synchronized disassembly of FAs induced by nocodazole to investigate the involvement of ICAP-1 in the control of this process. After 4 h of nocodazole treatment, the microtubule network totally collapsed, and WT MEFs displayed larger peripheral FAs (Fig. 5, A and B). However, Icap-1–deficient MEFs showed a dramatic increase in the number of central FAs, whereas the number and size of peripheral FAs were not significantly changed (Fig. 5, A and B). For both cell types, 60 min after nocodazole washout, FA disassembly temporally coincided with de novo growth of microtubules toward the cell periphery. FA reappeared 90 min after nocodazole washout, showing that FA disassembly was reversible in both cell types. Quantification of our observations revealed that nocodazole treatment of Icap-1–null cells induced the de novo formation of central but not peripheral FAs. In contrast, WT MEFs behaved differently because nocodazole induced a reinforcement of existing peripheral FAs without promoting de novo assembly (Fig. 5 B). Along with the video microscopy experiments, these results consistently suggested that ICAP-1 loss favored FA assembly but had no influence on disassembly.
Figure 5.

ICAP-1 loss induces de novo FA formation upon nocodazole treatment. (A) Icap-1+/+ and Icap-1 −/− MEF cells were either untreated or treated with 10 μM nocodazole for 4 h or treated with 10 μM nocodazole for 4 h followed by the drug washout for 60 and 90 min and were fixed. FA and microtubules were visualized by immunostaining of vinculin (green) and tyrosinated tubulin (red) and imaged using confocal microscopy. (B) Image quantification of vinculin-stained Icap-1+/+ and Icap-1 −/− cells. Peripheral (left) or central (right) FA number per cell was counted (top) at each indicated step of the nocodazole assay, and the corresponding mean surface (bottom) was quantified. 20 cells were analyzed for each experimental condition, and error bars indicate SD. Bar, 20 μm.
Increased integrin affinity in Icap-1–deficient cells is responsible for the cell adhesion phenotype
As ICAP-1 competes with talin for β1 cytoplasmic domain binding (Bouvard et al., 2003, 2007), the promotion of FA assembly resulting in the modification in migration and spreading of Icap-1–null fibroblasts could arise from an increase in β1-integrin affinity. Indeed, the activation state of β1 integrins measured by FACS revealed a higher affinity state in Icap-1–null cells than in WT cells (Fig. 6 A). This result is consistent with our recent work showing an increase in α5β1-integrin affinity in osteoblasts issuing from Icap-1–null mice (Bouvard et al., 2007) and also suggests that this integrin affinity increase is cell type independent. To correlate the increase in β1-integrin affinity to the adhesive defect observed in Icap-1–null cells, integrins were chemically activated in WT cells to mimic the Icap-1–null phenotype (Fig. 6, B and C; and Fig. S4, available at http://www.jcb.org/cgi/content/full/jcb.200707142/DC1). Mn2+ treatment of both WT and rescued cell types shifted the spreading curve toward lower FN or CL surface densities, whereas it had no effect on Mn2+-treated Icap-1–null cells because their integrins are already in a high affinity state (Figs. 6 B and S4, A and B). These results were also confirmed with 9EG7 mAb, which is able to both recognize an activated β1 integrin–specific epitope and maintain it in its high affinity conformation (Figs. 6 C and S4 C). Thus, it was tempting to speculate that β1-integrin affinity could also control FA assembly. To test this hypothesis, we generated the activated β1-integrin mutant D759A with a disrupted salt bridge between α and β subunits (Hughes et al., 1996; Sakai et al., 1998; Partridge et al., 2005) and expressed it in β1 integrin–deficient GD25 cells. First, we confirmed that GD25/β1D759A cells displayed a higher affinity for the FNIII7-10 fragment than GD25/β1WT cells (Fig. 7 A). At moderate FN surface densities, FAs were centrally distributed in GD25/β1D759A cells, whereas they were located on the periphery in control cells (Fig. 7 B). Both adhesive and migratory curves displayed a shift toward the lower matrix densities in mutant cells (Fig. 7 C). The coating concentration of FN giving the highest migration speed was approximately five times lower for GD25/β1D759A cells. Mn2+ treatment of GD25/β1WT integrin cells induced a shift in the spreading curve and mimicked the adhesive behavior of GD25/β1D759A and Icap-1–null cells. Finally, GD25/β1D759A cells displayed a faster rate of FA assembly, which is associated with a shorter lifetime, without any significant modification in the duration of the steady state or the disassembly rate (Fig. 7 D). Altogether, these results suggest that the adhesive defect in Icap-1–null cells was the result of the presence of β1 integrin in its active state and further implicate β1-integrin activation in the regulation of FA assembly.
Figure 6.

β1-integrin activation induces a spreading phenotype similar to ICAP-1 loss. (A) The β1-integrin activation state in Icap-1+/+ and Icap-1 −/− cells was determined by an FNIII7-10 binding assay that measures the ability of integrins to bind FITC-conjugated FNIII7-10 by flow cytometry analysis as described in Materials and methods. The activation index of integrin was expressed relative to the cell surface expression of β1 integrin as previously estimated by flow cytometry using MB1.2 mAb. (B and C) Spreading assays of Icap-1+/+ and Icap-1 −/− MEF cells with or without treatment using either 0.5 mM MnCl2 (B) or with 10 μg/ml 9EG7 mAb (C). Cells were first treated in suspension and were plated in a dose-dependent manner on FN. Cell spreading was measured as described in Fig. 2 C. Error bars indicate SD from three independent experiments.
Figure 7.

Activated β1 integrin increases FA turnover and promotes cell migration and spreading at low matrix density. The human WT β1-integrin chains or activated mutant (D759A) were stably expressed in β1 integrin–deficient GD25 cells, and their adhesive properties were analyzed. (A) The integrin affinity state for both cell types was measured with the FNIII7-10 binding assay as described in Fig. 6 A. (B) Confocal images of GD25/WT and D759A β1 cells spread on 10 μg/ml FN and immunostained to visualize β1 integrin, paxillin, and filamentous actin. β1 integrin was labeled with the 4B7R mAb, which recognizes the human β1-integrin chain. (C) Cell spreading and migration assays of GD25/WT and D759A β1 cells. Spreading of both cells types with or without 0.5 mM MnCl2 treatment was measured as described in Fig. 6 B. Migration of both cells types was analyzed using time-lapse phase-contrast video microscopy and cell tracking as described in Fig. 2 B. (D) GD25 cells stably expressing EGFP-zyxin and either WT β1 or D759A integrin were spread on 5 μg/ml FN and monitored by time-lapse video microscopy at 4-min intervals for 6 h. FA dynamics were assessed as described in Fig. 4. Four parameters for FA located at the leading edge of migrating cells were measured: assembly and disassembly speed, steady-state duration, and lifetime. Horizontal bars are the mean of all FAs. Error bars indicate SD. *, P < 105. Bar, 20 μm.
Control of β1-integrin affinity by ICAP-1 allows ECM density sensing
The reduced amount of adsorbed matrix required to support cell migration or spreading observed for Icap-1–null cells suggests that the sensing of matrix surface density has been changed. Moreover, the activation of β1 integrin displaces the maximal adhesive response to a significantly lower matrix concentration, suggesting that ICAP-1 is involved in the cell's perception and response to its microenvironment. We hypothesized that increasing substrate density would affect adhesion strength and favor the active state of the integrin. Indeed, WT MEFs on low density matrices showed only peripheral FAs (Fig. 8 A). At high matrix density, the observed increase in FA number distributed throughout the ventral cell surface was correlated with an increase in activated β1-integrin recruitment into FAs (Fig. 8, B and C). However, in Icap-1–null MEFs, FAs were mostly distributed all over the ventral face regardless of the matrix density used. These results reveal that increasing substrate density induces β1 integrin to take up its high affinity state and, furthermore, that ICAP-1 loss renders cells unable to sense the state of the matrix and adapt to variations in ECM density.
Figure 8.

ICAP-1 loss decreases matrix density sensing. (A) Icap-1+/+ and Icap-1 −/− MEF cells were allowed to spread on glass coverslips coated or not coated (control) with increased FN concentrations in FCS-containing medium and were immunostained to visualize vinculin and β1 integrin (9EG7). Images were taken with a confocal microscope. (B and C) The number of vinculin-stained FAs/cell (B) and the MFI of β1-integrin staining within FAs (C) were measured for each FN concentration. 50 cells were analyzed for each experimental condition, and error bars indicate SD. (D) EGFP-paxillin–expressing Icap-1+/+ and Icap-1 −/− MEF cells were spread on FN at concentrations ranging from 1 to 50 μg/ml and were recorded by time-lapse video microscopy at 4-min intervals for 6 h. FA turnover was quantified as previously described in Fig. 4: the rates of FA assembly and disassembly were determined as well as the duration of the steady state and total lifetime at three different FN densities (1, 10, and 50 μg/ml). Data from at least 20 cells per experimental condition were recorded. Each point represents a single FA, and the horizontal bars show the means of all FAs. These parameters were compiled in a schematic model of FA turnover in Icap-1+/+ and Icap-1 −/− cells. Adhesion site turnover displays different behaviors depending on matrix density. Note the appearance of a steady-state plateau in both cell types at high FN concentrations without any change in FA lifetime. Error bars represent SD. Bar, 20 μm.
To assess whether the reduction in the adhesive response of Icap-1–null cells to matrix density could be attributed to some differential adhesion dynamics, we quantified FA turnover in cells at different FN matrix densities using time-lapse video microscopy (Fig. 8 D). In WT cells, increased matrix density (10–50 μg/ml) induced faster FA assembly. A similar effect was observed using Icap-1–null cells but at lower FN-coating densities. This result supported our hypothesis that matrix density affects FA assembly and that Icap-1–null cells can only poorly adapt their adhesive structures to increase in ECM density because of their already high adhesion strength at low matrix density. However, we noticed a rise in the length of the steady-state phase at higher matrix densities in both WT and null cells, suggesting that the control of FA dynamics during the stages after assembly is ICAP-1 independent but matrix density dependent. These results highlight the involvement of ICAP-1 in sensing the state of the matrix through control of FA assembly, thus enabling the cell to adapt its adhesive response to changes in properties of the ECM.
Discussion
In this study, we have used both Icap-1–deficient MEFs and active β1-integrin mutants to show that the regulation of integrin affinity is necessary for the control of FA assembly and, consequently, also for cell spreading and cell migration. Our data demonstrate that ICAP-1 slows down FA assembly by decreasing β1-integrin affinity. We also document a new and unexpected role for ICAP-1 in the regulation of integrin affinity for a proper matrix surface density sensing. Therefore, ICAP-1 belongs to the molecular machinery of the FA that is able to provide the cell with the ability to respond adaptively to changes in substrate density.
Our present work provides an array of convergent clues in support of a critical role for ICAP-1 in the control of FA turnover. Indeed, the faster assembly rate of FA in the lamella of Icap-1–null cells accelerates the maturation state of the adhesion and is associated with a slightly shorter steady state, resulting in a reduced lifetime. However, as the rate of FA disassembly is not modified by the lack of ICAP-1, this strongly suggests that disassembly is triggered by an ICAP-1–independent signaling pathway. Although some proteins such as paxillin and FAK are involved in FA disassembly (Webb et al., 2004; Schober et al., 2007; Zaidel-Bar et al., 2007), to date, ICAP-1 is the only regulatory molecule shown so far to negatively control the assembly phase. The specific interaction of ICAP-1 with the β1 integrins (Chang et al., 1997) combined with the change in the adhesion properties of Icap-1–null cells, depending on the integrin-engaging substrates, indicate that the observed modification in FA dynamics in these cells probably involves the participation of β1 integrins.
Modification in the dynamics of β1 integrin–containing FAs in Icap-1–null cells is also revealed by the faster recruitment of EGFP-talin into FAs observed by FRAP studies. This observation in living cells fits with in vitro talin–ICAP-1 competition assays as well as with the FA disruption and cell rounding up occurring after ICAP-1 overexpression. Although FRAP experiment could not definitively measure the increase of the on-rate of talin into FA, these results support the idea that ICAP-1 competes with talin for binding to the β1 cytosolic tail (Bouvard and Block, 1998; Bouvard et al., 2003). We propose that ICAP-1 can delay the talin–integrin interaction necessary for integrin activation and clustering (Giannone et al., 2003; Calderwood, 2004; Cluzel et al., 2005). This also suggests that by modulating talin–integrin interaction, ICAP-1 could limit the incorporation of β1 integrins into FAs, resulting in a modification in FA dynamics. However, we cannot exclude that the faster recruitment of talin into FA in Icap-1–null cells could be correlated with increased FAK or Src signaling in the β1 integrin–enriched FA. This could also indicate an alteration in the affinity of talin for β1 integrin, resulting in the overall instability of FAs and their faster FA turnover. Our FACS analysis of fluorescent FNIII7-10 binding on cells in suspension show that the loss of ICAP-1 increases the affinity of integrin for the ligand, although not as much as is achieved by incubation with either with Mn2+ or 9EG7 antibody. This favors the hypothesis whereby ICAP-1 limits a state of preactivation necessary for the following steps of activation. Without ICAP-1, this limitation is switched off, which, in turn, accelerates cellular mechanisms such as spreading or migration. Interestingly, when cells spread or migrate, any means of integrin activation (D/A, ICAP-1 loss, or chemical treatment) results in the same phenotype. This fits with our observation that D/A and Icap-1–null cells share the same phenotype but also suggests that either a threshold in integrin activation exists or that integrin activation is tightly controlled in space and time by a multistep process, implying different integrin states from preactivation to full activation of integrin as already suggested (Clark et al., 2005). Moreover, FA distribution in the cell central region is cell type specific because β1 integrin–deficient osteoblasts infected with D759A human β1 integrin display more FA in the cell central region compared with GD25/β1D759A cells (unpublished data).
Although the control of the β1-integrin high affinity state has been well characterized and is largely attributed to the interaction with talin (Calderwood, 2004), the mechanisms restricting β1 integrin in a low affinity state are still unknown. Here, we show that ICAP-1 loss results in increased β1-integrin affinity in MEFs, as previously described for osteoblasts (Bouvard et al., 2007). Importantly, this increase of β1-integrin affinity in Icap-1–null cells results in faster FA turnover and in the inability of the cells to adapt their adhesive properties. This abnormal switch of β1 integrins toward the high affinity state results in maximal cell spreading and migratory response on a coating of minimal substrate density even though no migration defect has been noticed in Icap-1–null mice during embryogenesis. Nevertheless, we can neither exclude the presence of a more subtle defect nor exclude the possibility of a migration defect in Icap-1–null mice during repair or pathogenesis. Mice expressing a D759A mutation in β1 locus have been recently described (Czuchra et al., 2006). In contrast to Icap-1–null mice, those animals do not display significant abnormalities (Czuchra et al., 2006). However, although talin binding onto β1 integrin is required for its full activation in both mutants, the absence of ICAP-1 expression would favor talin binding, whereas ICAP-1 would still limit this step in the case of the D/A mutation. It is also important to note the discrepancy of adhesive phenotype between keratinocytes isolated from D/A mice (Czuchra et al., 2006) and Icap-1–null cells, which could arise from the different integrin repertoires between mesenchymal cells (MEFs or osteoblasts) and epithelial cells (keratinocytes). Furthermore, Icap-1–deficient mice also suffer from a strong osteoblast proliferation defect that could be integrin independent (Bouvard et al., 2007).
However, our results indicate that a balance between low and high affinity integrin states is necessary for proper sensing of the ECM density, which, in turn, has important consequences for migration and spreading. Cell adhesion is continually adapted in response to changes in substrate concentration and structure or to mechanical cues at the cell–matrix interface. Distinct FA and actin cytoskeleton organization and dynamics have been shown to depend on the strength of cell adhesion (Gupton and Waterman-Storer, 2006). Our data provide new insight by adding integrin affinity regulation to the molecular mechanisms controlling these different processes. Change in adhesive properties can be predicted on the basis of the redistribution of FA. In our study, the hallmark of increased integrin affinity, corresponding to the signature of cellular adaptation to a particular matrix environment, is the redistribution of FA throughout the ventral cell surface accompanied by an expansion in their areas. These central FAs do not display the characteristics of fibrillar adhesions and are not correlated with an increased capacity to deposit FN matrix (unpublished data). Cells lacking ICAP-1 are much less capable of sensing different matrix densities; consequently, maximal response is elicited by a minimum matrix density environment. Cell adaptive response and stem cell lineage specification may arise from substrate stiffness (Discher et al., 2005; Paszek et al., 2005; Engler et al., 2006). This inability to feel their environment has important consequences for in vivo function. Indeed, Icap-1–null mice suffer from an important osteogenesis dysfunction resulting from reduced proliferation and delayed differentiation of the osteoblast population. Icap-1–deficient preosteoblasts present a condensation defect that further limits the number of progenitors that will finally differentiate into mature osteoblasts (Bouvard et al., 2007). This cell compaction defect could be a consequence of the cells' inability to sense the matrix density or organization. The pronounced phenotype in osteoblasts may be caused by their extraordinary need for mechanosensitivity to mediate bone formation and remodeling along with the necessity of being aware of the inherent variability in cellular response to differences in matrix density or stiffness (Leucht et al., 2007). Although it is clear from previous work that β1-integrin expression is crucial for development and tissue homeostasis, we clearly establish that a switch between high and low affinity integrin states is required to drive an integrated cell response that is appropriate for the ECM environment. This is achieved by specific integrin regulators such as talin, ICAP-1, and possibly other proteins that are central to the control of FA dynamics during cell adhesion.
Materials and methods
Reagents and antibodies
FN was extracted from human plasma (Albiges-Rizo et al., 1995). Rat CL was purchased from Roche, and VN was purchased from Becton Dickinson. Vinculin mAb (hVIN-1), actin pAb (AC40), talin mAb (8d4), and phalloidin-rhodamine were obtained from Sigma-Aldrich. Paxillin mAb (349) was purchased from BD Biosciences. Anti–human β1-integrin mAb (4B7R) was obtained from Lab Vision Corp. Anti–mouse β1-integrin 9EG7 and MB1.2 mAb were obtained from BD Biosciences and provided by M.C. Bosco (University of Western Ontario, Ontario, Canada), respectively. Anti–mouse β3-integrin mAb was provided by B. Nieswandt (Rudolf Virchow Center, University of Würzburg, Würzburg, Germany). Tyrosinated tubulin pAb was provided by L. Lafenachère (Unité Mixte de Recherche5168, Grenoble, France). AlexaFluor-conjugated goat antibodies were purchased from Invitrogen. Rabbit anti–ICAP-1 serum was raised by immunizing rabbits with purified recombinant His-tagged ICAP-1 (amino acids 1–150) as antigen. Goat anti–mouse IgG and goat anti–rabbit IgG coupled to HRP were purchased from Bio-Rad Laboratories and Jackson ImmunoResearch Laboratories, respectively.
Cell culture, transfection, retroviral infection, and plasmid construction
Primary MEFs were isolated from embryonic day 14.5 WT or Icap-1–deficient embryos using a standard procedure. Immortalized osteoblasts from Icap-1+/+ and Icap-1–null mice as well as Icap-1–null osteoblasts rescued with Icap-1 were generated as described previously (Bouvard et al., 2007). MEF, GD25, and osteoblast cells were cultured in DME supplemented with 10% FCS (Invitrogen) and 100 U/ml penicillin/100 μg/ml streptomycin at 37°C in a 5% CO2-humidified chamber. Cells were transfected with the cDNA constructs using ExGen 500 (Euromedex). The expression vectors were pEGFP-C1-vinculin, pEGFP-C1-paxillin (provided by K. Nakamura, Osaka Bioscience Institute, Osaka, Japan), pEGFP-C1-talin (provided by A. Huttenlocher, University of Wisconsin, Madison, WI), pBabe β1-WT, pBabe β1(D759A), pBabe-EGFP-VASP (provided by F. Gertler, Massachusetts Institute of Technology, Cambridge, MA), and pCLMFG-IRES–ICAP-1. Retroviral plasmid encoding human WT β1 integrin or the D759A mutant was performed using standard protocols. In brief, a HindIII subclone fragment was used for PCR-mediated mutagenesis using the QuikChange Site-Directed Mutagenesis kit (Stratagene) according to the manufacturer's instructions and was reinserted into the full sequence to swap the WT sequence using HindIII digest. Human WT or mutant β1 integrin was then inserted into the pBabe retroviral vector using EcoRI and XhoI sites. All sequences were verified by DNA sequencing (Genome Express). β1 Integrin–null GD25 cells were transfected with pBabe containing either WT or D759A β1 integrin and were selected in the presence of 1 μg/ml puromycin. For retroviral infection, cells were incubated for 24 h at 37°C with either pBabe-EGFP-VASP, pCLMFG-Ires–ICAP-1, or pCLMFG-EGFP-zyxin retrovirus containing supernant in 10% FCS-DME and 4 μg/ml Polybrene (Sigma Aldrich) as previously described (Bouvard et al., 2007).
Western blotting
MEF cells were lysed in radioimmunoprecipitation assay buffer containing protease and phosphatase inhibitors (Roche). Proteins were separated by SDS-PAGE and transferred to polyvinylidene difluoride membranes. Immunological detection was achieved with appropriate HRP-conjugated secondary antibody. Peroxidase activity was visualized by chemiluminescence (ECL; GE Healthcare).
Immunofluorescence staining of cells
Cells were fixed with 4% PFA, permeabilized with 0.2% Triton X-100, and incubated with appropriate primary antibodies. After rinsing, coverslips were incubated with an appropriate AlexaFluor-conjugated secondary antibody. The cells were mounted in Mowiol/DAPI solution and imaged on an inverted confocal microscope (LSM510; Carl Zeiss, Inc.).
Spreading assays
Cell adhesion assays were performed using 35-mm-diameter hydrophobic dishes coated with various concentrations of matrix. Cells were trypsinized, treated with 1 mg/ml trypsin inhibitor (Sigma-Aldrich), and incubated in serum-free DME/5% BSA for 1 h at 37°C. Cells were plated at a density of 2 × 10⁴ cells per dish in 2 ml DME containing FN-free 10% FCS. After 1.5 h of incubation at 37°C, cells were photographed and scored as round or flattened using three fields for each experimental condition. When Mn2+ was supplemented, cells were treated for 10 min at 37°C in suspension with 0.5 mM MnCl2 in DME containing FN-free FCS before seeding. Alternatively, cells were treated with 10 μg/ml mAb(9EG7) for 30 min at 4°C in DME containing FN-free FCS.
Migration assays
For transwell assays, polycarbonate membranes (8-μm pores; BD Biosciences) were coated on both sides overnight with various concentrations of matrix. After washing with PBS, chambers were transferred in 24-well plates containing either serum-free DME or DME plus FN-free serum. Serum-starved cells were trypsinized and treated with trypsin inhibitor. 15 × 103 cells were seeded in the upper chamber in 1 ml of serum-free DME and allowed to migrate to the underside of the membrane for 8 h. Cell migration was stopped by fixing and staining with Coomassie blue. Excess dye was removed with isopropanol/acetic acid. After removal of the nonmigrating cells in the upper well, migrating cells were photographed at 10× magnification and counted using three randomly chosen microscopic fields.
Time-lapse video microscopy was performed using chambered coverglass (LabTekII; Thermo Fisher Scientific) coated with various concentrations of FN. Trypsinized cells were treated with trypsin inhibitor and incubated in 5% BSA for 1 h at 37°C. Cells were then plated in LabTekII chambers containing DME supplemented with FN-free serum. After 1 h of spreading, cells were observed at 10× magnification using an inverted microscope (Axiovert 100; Carl Zeiss, Inc.) equipped with an on-stage incubator (XL-3; PeCon). Six to eight isolated fields were arbitrary chosen, and phase-contrast images were taken at 4-min intervals over a period of 5 h. Cells were tracked using the position of centroids with MetaMorph software (Roper Scientific).
FNIII7-10 binding assay and flow cytometry analysis
MEF or GD25 cells were harvested after trypsin treatment, washed in the presence of trypsin inhibitor, and incubated (3 × 10⁵ cells per sample) with 3 μM FITC-coupled FNIII7-10 fragment (provided by F. Coussin, Unité Mixte de Recherche 5017, Bordeaux, France) in Tyrode buffer supplemented with 1% BSA for 1 h in the presence or absence of 5 mM EDTA and 5 mM EGTA. After washing with Tyrode/BSA, the cells were fixed and subjected to flow cytometry analysis using a FACScan flow cytometer (BD Biosciences). The collected data were analyzed using CellQuest software (BD Biosciences). In parallel, MEF or GD25 cells were analyzed by FACS for cell surface β1- or β3-integrin expression using either the MB1.2 rat mAb (against mouse β1 integrin), the 4B7R mouse mAb (against human β1 integrin), or the anti–mouse β3-integrin rat mAb (against mouse β3 integrin). The activation index of β1 integrin was estimated as previously described (Bouvard et al., 2007). Each specific MFI was calculated by subtracting the background obtained with FnIII7-10 fragment incubation in the presence of EDTA or without the primary antibody in the case of the integrin labeling. For instance, for the estimation of human β1-integrin activation (GD25 cells), activation index = ([MFI FnIII7-10]−[MFI FnIII7-10 + EDTA])/([MFI 4B7R]−[MFI 4B7R control]).
Nocodazole assay
Cells were serum starved for 48 h in DME containing 0.5% fatty acid–free BSA and were treated with 10 μM nocodazole for 4 h to completely depolymerize microtubules. The drug was washed out with serum-free DME medium containing 0.5% fatty acid–free BSA, and microtubules were allowed to repolymerize for different time intervals. Cells were fixed and permeabilized before processing for immunofluorescence.
Quantification of FA area and intensity
Fixed and stained cells were imaged on a nonlinear optics LSM510 inverted confocal and biphoton laser-scanning microscope equipped with a 63× NA 1.4 oil-immersion plan Apochromat objective (Carl Zeiss, Inc.). The fluorescence of AlexaFluor488 and 546 was excited with 488- or 543-nm wavelengths and detected in confocal mode. AlexaFluor350 fluorescence was induced by two-photon absorption at 720 nm using the fs Ti-Sa laser (Tsunami; Spectra-Physics). Neither signal saturation nor significant photobleaching was induced during image acquisition in either detection channel.
The images were manually thresholded, and FAs were automatically selected using MetaMorph software within the predefined regions of the cell. The number and areas of FAs and the MFIs of β1, β3 integrin, vinculin, and paxillin in FAs were quantified.
Time-lapse video microscopy and quantification of FA dynamics
Time-lapse recordings were assessed either on MEF cells expressing EGFP-paxillin, EGFP-VASP, or EGFP-vinculin and on GD25 cells expressing EGFP-zyxin. Cells were cultured in FN-free FCS-DME on LabTekII chambers previously coated with the indicated concentrations of matrix. Living cells were maintained at 37°C in a 5% CO2 atmosphere under an inverted microscope (Axiovert 200M; Carl Zeiss, Inc.) equipped with a motorized stage, cooled CCD camera (CoolSNAP HQ2; Roper Scientific), and a live cell imaging plan Apochromat 63× NA 1.2 water immersion objective (Carl Zeiss, Inc.). To minimize the possible photobleaching and light-induced cell damage, the excitation light of a 100-W Hg lamp was reduced to 30% with a FluoArc system (Carl Zeiss, Inc.) and additionally attenuated with a filter (ND75; Carl Zeiss, Inc.). 15 isolated cells were randomly chosen for each experimental condition, and 10–15 control WT cells were recorded simultaneously. Images were acquired, looping all stage positions at 4-min intervals over 6 h. The turnover of FAs located at the cell front was quantified using MetaMorph software. In brief, the adhesion area was outlined on the raw images during steady state, and then adhesion was manually followed from its nucleation. The MFI in the same area was measured, subtracting the background value. Four parameters of adhesion turnover were determined: the total lifetime, the period of steady state, and the rates of assembly and disassembly.
FRAP
MEF cells transiently expressing EGFP-talin or EGFP-vinculin were cultured on LabTekII chambers (Thermo Fisher Scientific) previously coated with either 20 μg/ml FN or 5 μg/ml VN. FRAP experiments were performed with an LSM510 confocal microscope equipped with the on-stage incubator. One individual FA per cell located at the leading edge was processed by FRAP. EGFP fluorescence in the adhesion area was eliminated by 100 bleach cycles at 100% intensity of the 488-nm argon laser. The fluorescence recovery was then sampled with low laser power (2–3%) each minute for 15–20 min. The recovery curves were obtained using MetaMorph software by measuring the MFI in the bleached region and correcting it to the overall image photobleaching. The corrected curve was adjusted with Kaleidagraph software (SynergySoftware) using the monoexponential fit. The characteristic recovery time, τ, was the mean of at least 20 individual FAs.
Online supplemental material
Fig. S1 shows the distribution of β3 integrin containing FAs and the expression of adhesion proteins in WT and Icap-1–null MEF cells. Fig. S2 shows the spreading and migration on increased FN matrix densities of WT, Icap-1–null, and rescued Icap-1–null MEF cells. Fig. S3 illustrates the adhesive behavior (cell migration, spreading, and FA dynamics) of WT and Icap-1–null MEF cells spread on VN, a β3 integrin–specific matrix. Fig. S4 shows that β1-integrin activation in WT MEFs and rescued Icap-1–null osteoblasts induces a similar spreading to Icap-1–null cells. Online supplemental material is available at http://www.jcb.org/cgi/content/full/jcb.200707142/DC1.
Supplemental Material
Acknowledgments
We would like to thank members of the laboratory for all of their input and helpful discussions. We thank E. Planus, J. Torbet, and K. Sadoul for critical reading of the manuscript. We thank G. Chevalier for technical assistance and A. Stuani for imaging assistance.
This work was supported by a grant from the Ligue Nationale Contre le Cancer, the Association de Recherche pour le Cancer, Areca, the Groupement des Entreprises Françaises Monegasques dans la Lutte contre le Cancer, and the Région Rhône-Alpes. A. Millon-Frémillon was supported by a fellowship from the Ministère de l'Education Nationale de la Recherche et de la Technologie.
Abbreviations used in this paper: FA, focal adhesion; FN, fibronectin; ICAP-1, integrin cytoplasmic domain–associated protein 1; MEF, mouse embryonic fibroblast; MFI, mean fluorescence intensity; VASP, vasodilator-stimulated phosphoprotein; VN, vitronectin; WT, wild type.
References
- Albiges-Rizo, C., P. Frachet, and M.R. Block. 1995. Down regulation of talin alters cell adhesion and the processing of the alpha 5 beta 1 integrin. J. Cell Sci. 108:3317–3329. [DOI] [PubMed] [Google Scholar]
- Bennett, J.S. 2005. Structure and function of the platelet integrin alphaIIbbeta3. J. Clin. Invest. 115:3363–3369. [DOI] [PMC free article] [PubMed] [Google Scholar]
- Bershadsky, A.D., N.Q. Balaban, and B. Geiger. 2003. Adhesion-dependent cell mechanosensitivity. Annu. Rev. Cell Dev. Biol. 19:677–695. [DOI] [PubMed] [Google Scholar]
- Bhatt, A., I. Kaverina, C. Otey, and A. Huttenlocher. 2002. Regulation of focal complex composition and disassembly by the calcium-dependent protease calpain. J. Cell Sci. 115:3415–3425. [DOI] [PubMed] [Google Scholar]
- Bouvard, D., and M.R. Block. 1998. Calcium/calmodulin-dependent protein kinase II controls integrin alpha5beta1-mediated cell adhesion through the integrin cytoplasmic domain associated protein-1alpha. Biochem. Biophys. Res. Commun. 252:46–50. [DOI] [PubMed] [Google Scholar]
- Bouvard, D., L. Vignoud, S. Dupe-Manet, N. Abed, H.N. Fournier, C. Vincent-Monegat, S.F. Retta, R. Fassler, and M.R. Block. 2003. Disruption of focal adhesions by integrin cytoplasmic domain-associated protein-1 alpha. J. Biol. Chem. 278:6567–6574. [DOI] [PubMed] [Google Scholar]
- Bouvard, D., A. Aszodi, G. Kostka, M.R. Block, C. Albiges-Rizo, and R. Fassler. 2007. Defective osteoblast function in ICAP-1-deficient mice. Development. 134:2615–2625. [DOI] [PMC free article] [PubMed] [Google Scholar]
- Calderwood, D.A. 2004. Integrin activation. J. Cell Sci. 117:657–666. [DOI] [PubMed] [Google Scholar]
- Calderwood, D.A., B. Yan, J.M. de Pereda, B.G. Alvarez, Y. Fujioka, R.C. Liddington, and M.H. Ginsberg. 2002. The phosphotyrosine binding-like domain of talin activates integrins. J. Biol. Chem. 277:21749–21758. [DOI] [PubMed] [Google Scholar]
- Chang, D.D., C. Wong, H. Smith, and J. Liu. 1997. ICAP-1, a novel beta1 integrin cytoplasmic domain-associated protein, binds to a conserved and functionally important NPXY sequence motif of β1 integrin. J. Cell Biol. 138:1149–1157. [DOI] [PMC free article] [PubMed] [Google Scholar]
- Chang, D.D., B.Q. Hoang, J. Liu, and T.A. Springer. 2002. Molecular basis for interaction between Icap1 alpha PTB domain and beta 1 integrin. J. Biol. Chem. 277:8140–8145. [DOI] [PubMed] [Google Scholar]
- Chen, C.S., J. Tan, and J. Tien. 2004. Mechanotransduction at cell-matrix and cell-cell contacts. Annu. Rev. Biomed. Eng. 6:275–302. [DOI] [PubMed] [Google Scholar]
- Clark, K., R. Pankov, M.A. Travis, J.A. Askari, A.P. Mould, S.E. Craig, P. Newham, K.M. Yamada, and M.J. Humphries. 2005. A specific alpha5beta1-integrin conformation promotes directional integrin translocation and fibronectin matrix formation. J. Cell Sci. 118:291–300. [DOI] [PMC free article] [PubMed] [Google Scholar]
- Cluzel, C., F. Saltel, J. Lussi, F. Paulhe, B.A. Imhof, and B. Wehrle-Haller. 2005. The mechanisms and dynamics of αvβ3 integrin clustering in living cells. J. Cell Biol. 171:383–392. [DOI] [PMC free article] [PubMed] [Google Scholar]
- Czuchra, A., H. Meyer, K.R. Legate, C. Brakebusch, and R. Fassler. 2006. Genetic analysis of β1 integrin “activation motifs” in mice. J. Cell Biol. 174:889–899. [DOI] [PMC free article] [PubMed] [Google Scholar]
- Discher, D.E., P. Janmey, and Y.L. Wang. 2005. Tissue cells feel and respond to the stiffness of their substrate. Science. 310:1139–1143. [DOI] [PubMed] [Google Scholar]
- Engler, A.J., S. Sen, H.L. Sweeney, and D.E. Discher. 2006. Matrix elasticity directs stem cell lineage specification. Cell. 126:677–689. [DOI] [PubMed] [Google Scholar]
- Ezratty, E.J., M.A. Partridge, and G.G. Gundersen. 2005. Microtubule-induced focal adhesion disassembly is mediated by dynamin and focal adhesion kinase. Nat. Cell Biol. 7:581–590. [DOI] [PubMed] [Google Scholar]
- Fournier, H.N., S. Dupe-Manet, D. Bouvard, M.L. Lacombe, C. Marie, M.R. Block, and C. Albiges-Rizo. 2002. Integrin cytoplasmic domain-associated protein 1alpha (ICAP-1alpha) interacts directly with the metastasis suppressor nm23-H2, and both proteins are targeted to newly formed cell adhesion sites upon integrin engagement. J. Biol. Chem. 277:20895–20902. [DOI] [PubMed] [Google Scholar]
- Franco, S.J., M.A. Rodgers, B.J. Perrin, J. Han, D.A. Bennin, D.R. Critchley, and A. Huttenlocher. 2004. Calpain-mediated proteolysis of talin regulates adhesion dynamics. Nat. Cell Biol. 6:977–983. [DOI] [PubMed] [Google Scholar]
- Giannone, G., G. Jiang, D.H. Sutton, D.R. Critchley, and M.P. Sheetz. 2003. Talin1 is critical for force-dependent reinforcement of initial integrin-cytoskeleton bonds but not tyrosine kinase activation. J. Cell Biol. 163:409–419. [DOI] [PMC free article] [PubMed] [Google Scholar]
- Ginsberg, M.H., A. Partridge, and S.J. Shattil. 2005. Integrin regulation. Curr. Opin. Cell Biol. 17:509–516. [DOI] [PubMed] [Google Scholar]
- Gupton, S.L., and C.M. Waterman-Storer. 2006. Spatiotemporal feedback between actomyosin and focal-adhesion systems optimizes rapid cell migration. Cell. 125:1361–1374. [DOI] [PubMed] [Google Scholar]
- Han, J., C.J. Lim, N. Watanabe, A. Soriani, B. Ratnikov, D.A. Calderwood, W. Puzon-McLaughlin, E.M. Lafuente, V.A. Boussiotis, S.J. Shattil, and M.H. Ginsberg. 2006. Reconstructing and deconstructing agonist-induced activation of integrin alphaIIbbeta3. Curr. Biol. 16:1796–1806. [DOI] [PubMed] [Google Scholar]
- Hughes, P.E., F. Diaz-Gonzalez, L. Leong, C. Wu, J.A. McDonald, S.J. Shattil, and M.H. Ginsberg. 1996. Breaking the integrin hinge. A defined structural constraint regulates integrin signaling. J. Biol. Chem. 271:6571–6574. [DOI] [PubMed] [Google Scholar]
- Hynes, R.O. 2002. Integrins: bidirectional, allosteric signaling machines. Cell. 110:673–687. [DOI] [PubMed] [Google Scholar]
- Ingber, D.E. 2003. Mechanosensation through integrins: cells act locally but think globally. Proc. Natl. Acad. Sci. USA. 100:1472–1474. [DOI] [PMC free article] [PubMed] [Google Scholar]
- Jiang, G., G. Giannone, D.R. Critchley, E. Fukumoto, and M.P. Sheetz. 2003. Two-piconewton slip bond between fibronectin and the cytoskeleton depends on talin. Nature. 424:334–337. [DOI] [PubMed] [Google Scholar]
- Kaverina, I., O. Krylyshkina, and J.V. Small. 1999. Microtubule targeting of substrate contacts promotes their relaxation and dissociation. J. Cell Biol. 146:1033–1044. [DOI] [PMC free article] [PubMed] [Google Scholar]
- Leucht, P., J.B. Kim, J.A. Currey, J. Brunski, and J.A. Helms. 2007. FAK-mediated mechanotransduction in skeletal regeneration. PLoS ONE. 2:e390. [DOI] [PMC free article] [PubMed] [Google Scholar]
- Liddington, R.C., and M.H. Ginsberg. 2002. Integrin activation takes shape. J. Cell Biol. 158:833–839. [DOI] [PMC free article] [PubMed] [Google Scholar]
- Luo, B.H., T.A. Springer, and J. Takagi. 2004. A specific interface between integrin transmembrane helices and affinity for ligand. PLoS Biol. 2:e153. [DOI] [PMC free article] [PubMed] [Google Scholar]
- Martel, V., C. Racaud-Sultan, S. Dupe, C. Marie, F. Paulhe, A. Galmiche, M.R. Block, and C. Albiges-Rizo. 2001. Conformation, localization, and integrin binding of talin depend on its interaction with phosphoinositides. J. Biol. Chem. 276:21217–21227. [DOI] [PubMed] [Google Scholar]
- Partridge, A.W., S. Liu, S. Kim, J.U. Bowie, and M.H. Ginsberg. 2005. Transmembrane domain helix packing stabilizes integrin alphaIIbbeta3 in the low affinity state. J. Biol. Chem. 280:7294–7300. [DOI] [PubMed] [Google Scholar]
- Paszek, M.J., N. Zahir, K.R. Johnson, J.N. Lakins, G.I. Rozenberg, A. Gefen, C.A. Reinhart-King, S.S. Margulies, M. Dembo, D. Boettiger, et al. 2005. Tensional homeostasis and the malignant phenotype. Cancer Cell. 8:241–254. [DOI] [PubMed] [Google Scholar]
- Priddle, H., L. Hemmings, S. Monkley, A. Woods, B. Patel, D. Sutton, G.A. Dunn, D. Zicha, and D.R. Critchley. 1998. Disruption of the talin gene compromises focal adhesion assembly in undifferentiated but not differentiated embryonic stem cells. J. Cell Biol. 142:1121–1133. [DOI] [PMC free article] [PubMed] [Google Scholar]
- Raftopoulou, M., and A. Hall. 2004. Cell migration: Rho GTPases lead the way. Dev. Biol. 265:23–32. [DOI] [PubMed] [Google Scholar]
- Sakai, T., Q. Zhang, R. Fassler, and D.F. Mosher. 1998. Modulation of β1A integrin functions by tyrosine residues in the β1 cytoplasmic domain. J. Cell Biol. 141:527–538. [DOI] [PMC free article] [PubMed] [Google Scholar]
- Schober, M., S. Raghavan, M. Nikolova, L. Polak, H.A. Pasolli, H.E. Beggs, L.F. Reichardt, and E. Fuchs. 2007. Focal adhesion kinase modulates tension signaling to control actin and focal adhesion dynamics. J. Cell Biol. 176:667–680. [DOI] [PMC free article] [PubMed] [Google Scholar]
- Tadokoro, S., S.J. Shattil, K. Eto, V. Tai, R.C. Liddington, J.M. de Pereda, M.H. Ginsberg, and D.A. Calderwood. 2003. Talin binding to integrin beta tails: a final common step in integrin activation. Science. 302:103–106. [DOI] [PubMed] [Google Scholar]
- Takagi, J., and T.A. Springer. 2002. Integrin activation and structural rearrangement. Immunol. Rev. 186:141–163. [DOI] [PubMed] [Google Scholar]
- Vinogradova, O., J. Vaynberg, X. Kong, T.A. Haas, E.F. Plow, and J. Qin. 2004. Membrane-mediated structural transitions at the cytoplasmic face during integrin activation. Proc. Natl. Acad. Sci. USA. 101:4094–4099. [DOI] [PMC free article] [PubMed] [Google Scholar]
- Webb, D.J., K. Donais, L.A. Whitmore, S.M. Thomas, C.E. Turner, J.T. Parsons, and A.F. Horwitz. 2004. FAK-Src signalling through paxillin, ERK and MLCK regulates adhesion disassembly. Nat. Cell Biol. 6:154–161. [DOI] [PubMed] [Google Scholar]
- Zaidel-Bar, R., R. Milo, Z. Kam, and B. Geiger. 2007. A paxillin tyrosine phosphorylation switch regulates the assembly and form of cell-matrix adhesions. J. Cell Sci. 120:137–148. [DOI] [PubMed] [Google Scholar]
- Zhang, X.A., and M.E. Hemler. 1999. Interaction of the integrin beta1 cytoplasmic domain with ICAP-1 protein. J. Biol. Chem. 274:11–19. [DOI] [PubMed] [Google Scholar]
Associated Data
This section collects any data citations, data availability statements, or supplementary materials included in this article.