

Abstract
Two Cl− conductances have been described in the apical membrane of both human and murine proximal airway epithelia that are thought to play predominant roles in airway hydration: (1) CFTR, which is cAMP regulated and (2) the Ca2+-activated Cl− conductance (CaCC) whose molecular identity is uncertain. In addition to second messenger regulation, cross talk between these two channels may also exist and, whereas CFTR is absent or defective in cystic fibrosis (CF) airways, CaCC is preserved, and may even be up-regulated. Increased CaCC activity in CF airways is controversial. Hence, we have investigated the effects of CFTR on CaCC activity and have also assessed the relative contributions of these two conductances to airway surface liquid (ASL) height (volume) in murine tracheal epithelia. We find that CaCC is up-regulated in intact murine CF tracheal epithelia, which leads to an increase in UTP-mediated Cl−/volume secretion. This up-regulation is dependent on cell polarity and is lost in nonpolarized epithelia. We find no role for an increased electrical driving force in CaCC up-regulation but do find an increased Ca2+ signal in response to mucosal nucleotides that may contribute to the increased Cl−/volume secretion seen in intact epithelia. CFTR plays a critical role in maintaining ASL height under basal conditions and accordingly, ASL height is reduced in CF epithelia. In contrast, CaCC does not appear to significantly affect basal ASL height, but does appear to be important in regulating ASL height in response to released agonists (e.g., mucosal nucleotides). We conclude that both CaCC and the Ca2+ signal are increased in CF airway epithelia, and that they contribute to acute but not basal regulation of ASL height.
Keywords: cystic fibrosis, chloride, ion transport, trachea, airway epithelia
INTRODUCTION
Airway epithelia use active ion transport to modulate the volume of airway surface liquid (ASL),* which in part determines the efficiency of mucus clearance (Matsui et al., 1998; Tarran et al., 2001a,b). Effective mucus clearance has been proposed as the airways primary innate defense against disease (Knowles and Boucher, 2002) and evidence for this notion has emerged from studies of human genetic diseases. For example, airways from subjects with cystic fibrosis (CF) lack functional CFTR Cl− channels and CFTR-mediated inhibition of epithelial Na+ channel (ENaC) (Kunzelmann et al., 1995; Stutts et al., 1995). The combined lack of Cl− secretion and Na+ hyperabsorption are thought to diminish ASL volume, causing inefficient mucus transport, and chronically, mucus plug/plaque accumulation on airway surfaces (Guggino, 2001; Knowles and Boucher, 2002).
An alternate, Ca2+-activated Cl− conductance (CaCC) can be stimulated via a P2Y2 receptor-mediated increase in intracellular Ca2+ in both human and murine airways and may even be up-regulated in CF as compared with normal airways. Intriguingly, the airways of CF null transgenic mice fail to exhibit the severe pathology seen in humans (Snouwaert et al., 1992; Ratcliff et al., 1993; Grubb and Boucher, 1999). A possible explanation for this lack of pathology is that CaCC serves as the main pathway for apical Cl− exit in the murine airway (Clarke et al., 1994; Grubb et al., 1994) and consequently, the loss of CFTR function is a less catastrophic event. Conversely, in human airways CaCC plays a minor role compared with cAMP-mediated Cl− and liquid secretion. Despite the up-regulation of CaCC in CF-affected tissues, it is not able to compensate for the ion transport defects resulting from a loss of CFTR because it is relatively inactive basally (Knowles et al., 1991). However, the relative contributions of CaCC versus CFTR to ASL secretions have not been ascertained.
The mechanism whereby CaCC is up-regulated in CF epithelia remains speculative. An interaction between CFTR and CaCC at the expression level has been suggested (Johnson et al., 1995; Kunzelmann et al., 1997; Wei et al., 2001), although this concept has not been fully explored. In part, failure to explore this phenomenon reflects the lack of consensus regarding the molecular candidate(s) for the CaCC gene family. CaCC candidates have been identified that require extremely high levels of intracellular Ca2+ for activation (>1 mM; Gruber et al., 1998, 1999). However, other studies have not confirmed these results, and do not support the idea that these genes encode a Ca2+-activated Cl− channel (Romio et al., 1999; Papassotiriou et al., 2001). Further controversy related to CaCC in CF indicates that CaCC up-regulation may be tissue and/or preparation specific. For example, Clarke and co-workers (1994) reported that CaCC was up-regulated in murine pancreatic duct cultures, whereas Gray et al. (1994) and Winpenny et al. (1995) found no difference in CaCC magnitude between isolated WT and CF pancreatic duct cells.
In the present paper, we have investigated CaCC in murine airway epithelia, using both electrophysiological and imaging techniques. Because intact murine CF nasal epithelial sheets have previously been shown to exhibit up-regulated CaCC (Grubb et al., 1994), we initially sought to investigate the putative CFTR-dependency of CaCC using freshly isolated murine nasal ciliated cells. However, these acutely dissociated cells failed to exhibit this phenomenon and we next focused on WT and CF mouse tracheal epithelial (MTE) cell lines. These MTE cell lines are a good model for Cl− secretion because CFTR and CaCC exhibit reciprocal activity when studied as confluent monolayers and they exhibit little functional ENaC activity. In this model system, we found that the magnitude of nucleotide-induced changes in both the initial elevation of Ca2+ and the Ca2+-activated Cl− conductance were dependent on cell polarity. Finally, we examined volume secretory responses by measuring ASL height in the MTE cell lines to test the hypothesis that Ca2+-mediated liquid secretion was also up-regulated in CF airway and to gain an appreciation for the relative contributions of CaCC and CFTR to airway secretions in both WT and CF cultures.
MATERIALS AND METHODS
Isolation of Single Ciliated Cells from Murine Nasal Epithelium
Wild-type (WT) mice were obtained either from a BALB/c breeding colony or as littermate controls from the Cambridge transgenic breeding colony (C57/Bl6). Cambridge CF null mice were a gift from Dr. W.H. Colledge (University of Cambridge, Cambridge, United Kingdom). A total of 17 WT (10 M and 7 F) and 4 CF null mice (1 M and 3 F) were used in this study. Ciliated cells were obtained from the murine nasal epithelium using an overnight protease digestion procedure as described previously (Tarran et al., 1998).
Whole Cell Patch Clamping of Nasal Ciliated Cells
Pipettes (GC120F; Harvard Apparatus) had resistances, after fire polishing between 2 and 4 MΩ. To obtain current/voltage relationships, whole cell currents were recorded with an EPC-7 patch-clamp amplifier (List Electronic) and the membrane potential was held at 0 mV and then voltage clamped over the range ± 100 mV in 20-mV steps. Each voltage step lasted 500 ms and there was an 800-ms interval at the holding potential between steps. Data were filtered at 1 kHz and sampled at 2 kHz with a Cambridge Electronic Design 1401 interface. I/V plots for CaCC were constructed using the average current measured over a 2-ms period starting 495 ms into the voltage pulse. Chord conductances were calculated by dividing the current at the Erev ± 60 mV by 60 mV. Junction potentials were measured and the appropriate corrections applied to the membrane potential (Vm).
Cation conductances were blocked with bilateral NMDG+ and to prevent the development of swelling-induced chloride currents the pipette solution was made 20 mosm/liter hypotonic to the bath solution. The pipette solution contained the following (mM): 120 NMDG-Cl, 2.0 MgCl2, 0.2 EGTA, 1.0 ATP, and 10.0 HEPES, pH 7.2 (calculated free [Ca2+]i < 1 nM). To examine the Ca2+ dependency of CaCC, the EGTA concentration in the pipette solution was increased to 5.0 mM and [Ca2+]i fixed as follows (μM): 0.1, 0.3, 0.5, and 1.0. The standard bath solution contained the following (mM): 149.5 NMDG-Cl, 2.0 CaCl2, 1.0 MgCl2, 5.0 glucose, and 10.0 HEPES, pH 7.4.
To increase cAMPi, cells were prestimulated with a “cAMP cocktail” consisting of 1 μM forskolin, 100 μM dibutyryl cAMP, and 100 μM 3-isobutyl-1-methylxanthine, which was added to the epithelia at the start of the protease digestion. Ionomycin was dissolved in DMSO and diluted 1,000-fold to give the final concentration (1 μM). 100 μM ATP was added directly to the bath solution.
Culture of Murine Tracheal Epithelial Cell Lines
Two cell lines derived from murine tracheal epithelial (MTE) cells of either CFTR null (designated MTE18) origin or from a mouse heterozygous with respect to the CFTR knockout (designated MTE7b) were used for these studies and maintained in culture as described previously (Gabriel et al., 2000a; Thomas et al., 2000). Cells were harvested for experimental studies by trypsinization and plated at high density (2 × 10⁴ cells/mm2) onto either permeable collagen matrix supports (4.5-mm diameter for Ussing or confocal microscopy experiments, 1.5-mm for patch-clamp experiments) or 35-mm plastic dishes. Only monolayers generating at least a Vt of 1.0 mV and with a 100-Ω•cm2 resistance (after the resistance of the permeable support was subtracted) were used for patch/Ussing chambers studies typically 5–7 d after plating. Rt was not different between WT and CF monolayers. Single, isolated cells grown on plastic were patched 1–3 d after plating.
Whole Cell Patch Clamping of MTE Cells
Patch pipettes (GC150F; Harvard Apparatus) were pulled and fire polished on a DMZ-universal puller (Dagan) and had a resistance of 3–5 MΩ. Whole cell currents were acquired with a patch-clamp amplifier (Axopatch-1D; Axon Instruments) at 500 Hz and filtered at 1,000 Hz using Clampex 8 and analyzed with Clampfit 8 (Axon Instruments). The standard voltage clamp protocol had a holding potential of 0 mV with voltage pulses applied for 600 ms from −100 to +100 mV in 20-mV steps. Chord conductances were calculated by dividing the current at the Erev ± 100 mV by 100 mV. The pipette solution contained the following (mM): 1 sodium pyruvate, 40 Tris-Cl−, 90 d-gluconic acid lactone, 90 Tris base, 5 N-Tris (hydroxymethyl)methyl-2-aminoethane-sulfonic acid (TES), 1 EGTA, 2 MgCl2, 0.1 CaCl2, 1 MgATP, and 0.1 Na2GTP, pH 7.4. Ca2+ activity was buffered to ∼40 nM. The standard bath solution contained the following (mM): 150 NaCl, 2 MgCl2, 1 CaCl2, 5 TES, and 30 sucrose, pH 7.4. Junction potentials were measured and the appropriate corrections applied to Vm.
Ca2+ Measurements in MTE Cells
Isolated cells attached to vitogen-coated coverslips were studied 1–2 d after seeding. Polarized cells plated on 0.03-cm2 permeable supports (3–5 d) were mounted in a miniature chamber as described previously (Paradiso et al., 2001). All cells were loaded with Fura-2 (5 μM at 37°C for 25 min) and mounted over an objective (Zeiss LD Achroplan × 40, N.A. 0.6; working distance, 1.8 mm) of a Zeiss Axiovert 35 microscope. Ca2+ i measurements were obtained using a RadioMaster fluorimeter (Photon Technology International) coupled via fiber optics to the microscope. For both preparations, Fura-2 fluorescence from 30 to 40 cells (spot diameter ∼65 μm) was acquired alternately at 340 and 380 nm (emission > 450 nm). Excitation slit widths were minimized to reduce photodamage to cells and bleaching of the dye. At a given excitation wavelength (340 or 380 nm), background light levels were measured by exposing cells to digitonin (15 μM) and MnCl2 (10−3 M) and subtracted from the corresponding signal measured in Fura-2–loaded cells before taking the ratio (340/380). The corrected ratio was converted to Ca2+ i by using external Ca2+ standards as described previously (Paradiso et al., 2001).
Ussing Chamber Studies of MTE Cultures
Electrical measurements, i.e., Vt, Rt and short-circuit current (ISC), were made on cell monolayers mounted in Ussing chambers as described previously (Gabriel et al., 2000a; Thomas et al., 2000). Monolayers were bathed in a Krebs bicarbonate ringer solution (KBR) on the serosal side and a modified KBR on the mucosal side to generate a transepithelial Cl− gradient (40 mM Cl− with gluconate used as the replacement anion to preserve isotonicity). All bathing solutions were bubbled with 95% O2 and 5% CO2 maintained at 37°C. Vt was clamped to zero, and pulsed to ±10 mV for 0.5 s every 60 s. Electrometer output was digitized online and ISC, Rt, and calculated transepithelial potential (Vt) were displayed on a video monitor and stored on a computer hard drive. Drugs were added from concentrated stock solutions to either mucosal and/or serosal sides of the tissue. To eliminate the contribution of apical Na+ channels, amiloride (10−4 M), was added to the mucosal bath at the outset of all Ussing chamber experiments.
Basolateral Permeabilization of MTE Cultures Mounted in Ussing Chambers
Apical membrane isolation was achieved after permeabilization of the basolateral membrane by exposure to Staphylococcus aureus α toxin as described previously (Gabriel et al., 2000a). A 60-min exposure to 1,000 U α toxin achieved permeabilization as determined by a drop in ISC to 0. After successful permeabilization, the mucosal solution was diluted by three successive 1-ml replacements with a low Cl− (4.8 mM) containing KBR. This maneuver generates a gradient for Cl− secretion with a serosal Cl− concentration of 115 mM and a final mucosal concentration of 68 mM. In these experiments, to maintain osmolarity, Cl− was replaced by gluconate that has previously been shown to be relatively impermeant through CaCC (Qu and Hartzell, 2000). Activation of CaCC was achieved by addition of agonists (ionomycin, thapsigargin, and UTP) to the mucosal solution after imposition of the Cl− gradient.
Retroviral Correction of CFTR in the MTE 18 Cell Line
The CFTR cDNA was cloned into the murine leukemia virus (MLV)-based retroviral vector (LXPIP), to yield LCFPIP. In this vector, CFTR expression was driven from the promoter elements in the MLV LTR. Downstream of the CFTR cDNA is a poliovirus IRES sequence linked to a puromycin drug resistance gene. Infection of the MTE18 cell line with this retroviral vector and selection of resistant colonies in puromycin-containing media resulted in the identification of several cell clones that were puromycin resistant and were verified for expression of CFTR. These CFTR-expressing cells were plated on membrane supports and used for both Ussing chamber and confocal studies.
Confocal Microscopy of ASL on MTE Cultures
MTE cells grown on collagen matrix supports were used for measurement of ASL height by mucosal addition of PBS containing Texas red–dextran (10 kD; Molecular Probes) as described previously (Matsui et al., 1998). In some experiments, excess liquid was aspirated, and the cultures were scanned within 1 h of ASL labeling (final ASL thickness ∼4 μm). To compare WT, CF, and CF+CFTR cultures, excess liquid was aspirated24 h before scanning and the cultures returned to the incubator. Perfluorocarbon (PFC) was added mucosally to prevent evaporation of the ASL and the culture was placed on the stage of the confocal microscope (TCS 4D and 63× water lens; Leica). PFC is volatile, and once the first aliquot had evaporated to minimal levels, UTP was added mucosally (dry powder in PFC) and XZ scanning initiated to measure ASL height. After UTP addition, subsequent aliquots of PFC were added to prevent further evaporation and the culture was scanned periodically over the course of the experiment as described previously (Tarran et al., 2001b). Due to its short half-life under thin film conditions (≤10 min; Tarran et al., 2001b), amiloride was not added to mucosal solutions of cultures used for confocal microscopy.
Statistics
Parametric statistics (t test), the Mann-Whitney U test, or the Wilcoxon Signed Rank test were used as appropriate. All values are expressed as mean ± standard error where n represents the number of cells/cultures. A minimum of three mice per dataset was used for the freshly excised nasal cell experiments. Significance of difference between the number of cells responding to a particular maneuver was assessed using the Chi-squared test. The level of significance was set at P ≤ 0.05.
RESULTS
Whole Cell Ca2+-activated Cl− Conductances in Freshly Isolated Murine Nasal Ciliated Cells
Both human (Knowles et al., 1991) and murine (Grubb et al., 1994) CF nasal epithelia exhibit up-regulated CaCC activity in response to mucosal nucleotides. To determine whether CaCC activity was up-regulated in single CF ciliated cells, we acutely stimulated freshly isolated WT and CF nasal ciliated cells with 1 μM ionomycin (materials and methods). This maneuver activated an outwardly-rectifying Cl− conductance with a similar frequency of occurrence in WT cells (18/21; Fig. 1 A) or in CF cells (11/13; Fig. 1 B). The ionomycin-stimulated current reversed close to the equilibrium potential for Cl− (Erev) of −5.7 mV in both WT (−8.9 ± 1.4 mV, n = 18) and CF cells (−6.7 ± 1.1 mV, n = 11). Moreover, there was no significant difference in the magnitude of the current densities between WT and CF CaCCs (Fig. 1 C).
Figure 1.

Biophysical characteristics of Ca2+-activated Cl− conductances in wild-type (WT) and CF null (CF) single ciliated cells isolated from murine nasal epithelia. (A and B, top) Current traces obtained at the start of whole cell recording (∼60 s) by holding the membrane potential at 0 mV and pulsing between ±100 mV in 20-mV steps in WT and CF cells. (A and B, bottom) Current traces obtained using the same protocol ∼2–3 min after addition of 1 μM ionomycin to the bath in WT and CF cells. (C) Mean data of ionomycin-induced CaCCs. Black bars, WT cells (n = 18); striped bars, CF cells (n = 11). (Note, no significant difference was detected between phenotypes.) Data shown as mean ± SEM.
Because CaCC activity appeared to be independent of CFTR expression in nasal ciliated cells, we next tested the hypothesis that CFTR activation would result in the down-regulation of CaCC. In WT cells, CaCC was activated to a similar magnitude whether cells were prestimulated by cAMP or not (cAMP-exposed cells: 241 ± 72 pS/pF n = 6 vs. 221 ± 68.3 pS/pF, n = 18; Fig. 1 A for non–cAMP-exposed cells; P = 0.81). Raising intracellular cAMP failed to activate a Cl− conductance in 0/12 cells isolated from CF mice.
CaCC was active at the start of whole cell recordings with a pipette solution containing 0.5 μM Ca2+ (138.8 ± 50.1 and −105.0 ± 41.7 pS/pF; n = 4/11 cells). Increasing Cai 2+ to 1.0 μM did not lead to any further increases in conductance (n = 4/11 cells) and CaCC currents could not be detected when pipette Ca2+ was reduced to 0.1 or 0.3 μM (both 0/15 cells; P = 0.01). CaCC could also be activated by addition of 100 μM ATP to the bath solution (130.0 ± 53.3 and −108.3 ± 48.3 pS/pF for outward and inward conductances respectively; n = 5). CaCC currents activated by ATP had a Cl− reversal potential of −6.5 ± 2.9 (n = 5) and were inhibited by NPPB (∼63 ± 7% inhibition of outward current; preinhibitor current was 111.7 ± 20.0 pS/pF; n = 3), a reported CaCC inhibitor (Alton et al., 1991; Kidd and Thorn, 2000).
Changes in ISC and ASL Height (Volume) Mediated by CaCC in Confluent MTE Monolayers
Despite our best efforts in isolating single ciliated nasal cells, we were unable to detect a difference in CaCC activity between WT and CF cells, which may be due to the acute dissociation of the epithelium. Patching intact airway epithelia is precluded because it is not possible to obtain giga-ohm seals on the ciliated apical membrane. Therefore, to test the hypothesis that a confluent monolayer is required for CaCC up-regulation in CF airways, we studied MTE cell lines that may be grown either as isolated cells or as cells contained within a confluent epithelium. Importantly, these cell lines were established as bulk cultures as opposed to clonal populations (Thomas et al., 2000) permitting a nonbiased comparison of WT and CF CaCC activity.
We initially mounted confluent MTE cells in Ussing chambers to verify that CaCC was up-regulated in CF as compared with WT tissues. WT (MTE7b) cultures exhibited typical CaCC ISC responses to UTP stimulation, characterized by a transient peak phase and a more sustained plateau. A similar CaCC response was elicited in the CF (MTE18) cultures but with a threefold-greater increase in ISC (Fig. 2 A). The mean data are shown in Fig. 2 B (MTE7b, 42 ± 9.3 μA, n = 14; MTE18, 117 ± 8.6 μA, n = 13; P = 0.01).
Figure 2.
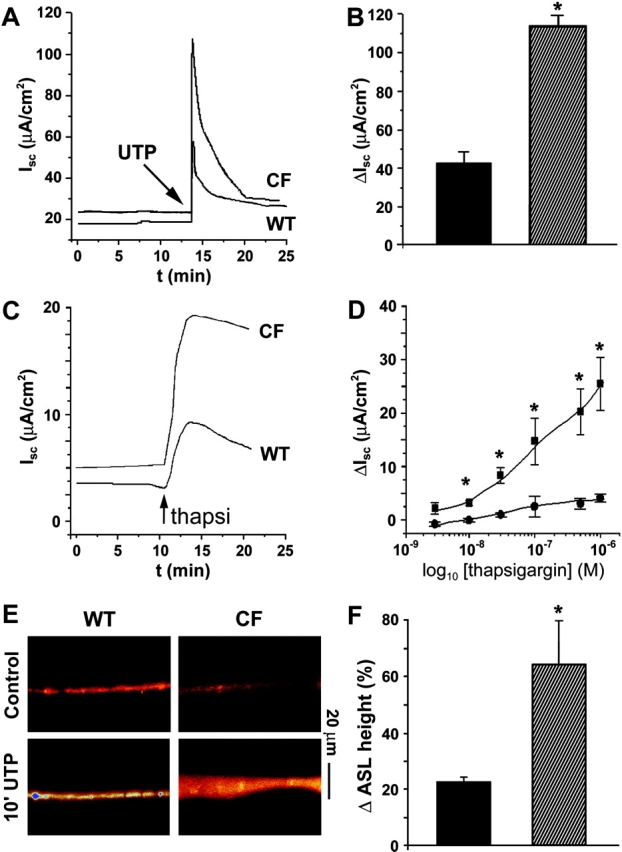
Measurements of short circuit current (ISC) and ASL height in confluent WT and CF murine tracheal epithelial (MTE) monolayers. (A) Representative traces from WT (MTE7b) and CF (MTE18) monolayers after mucosal 100 μM UTP addition. (B) Mean data of UTP-induced CaCCs. Black bars, WT cells (n = 14); striped bars, CF cells (n = 13). (C) Representative traces from WT and CF monolayers after mucosal 0.1 μM thapsigargin addition. (D) Mean dose–response curves to thapsigargin for WT (circles; n = 8) and CF (squares; n = 8) monolayers taken from peak responses typified in (C). (E) Confocal images of ASL labeled with Texas red–dextran obtained before and 10 min after mucosal addition of powdered UTP (∼200 μM) suspended in PFC. (F) Percentage increases in ASL height for WT (black bars; n = 6) and CF cultures (stripped bars; n = 6). Pre-UTP heights were 3.9 and 4.1 μm for WT and CF cultures, respectively. *, significantly different (P < 0.05) between WT and CF. Data shown as mean ± SEM.
To bypass P2Y2 receptors and directly raise  we added thapsigargin to the mucosal surface of MTE monolayers and measured ISC. Fig. 2 (C and D) shows representative traces and mean dose–response curves, respectively, for both WT and CF cultures. Although the ISC response to thapsigargin was smaller than for UTP-mediated response for both genotypes (Fig. 2, compare B and D), thapsigargin-induced CaCC activity was still significantly greater in CF than WT cultures.
To test the hypothesis that increased CaCC activity after purinergic activation in CF epithelia is coupled to increased liquid secretion, we next measured ASL height under thin film (∼10 μm) conditions using XZ confocal microscopy. UTP- addition (∼200 μM as a dry powder in PFC; materials and methods) caused a rapid (<10 min) increase in ASL height in both WT (MTE7b) and CF (MTE18) cultures (Fig. 2 E). The increase in ASL height was significantly greater in CF cultures than in WTs (Fig. 2 F), suggesting that CaCC up-regulation is indeed coupled to increased liquid secretion in polarized airway epithelia. However, by 1 h, this response had waned and ASL height had returned to prestimulation levels.
Whole Cell Ca2+-activated Cl− Currents and Ca2+ Signals in Confluent versus Nonconfluent MTE Cells
Epithelial cells exist as confluent layers, and following isolation in vitro, normal cellular physiology may be disrupted. Specifically, we hypothesized that the total CaCC activity and/or the Ca2+ signal may be altered during cell isolation. Hence, we measured CaCC activity by patch clamp and observed the  signal in MTE cells under polarized and nonpolarized conditions to see whether the degree of confluency affected either CaCC activity and/or the
  signal.
Cell capacitance (Ci) was not different between MTE cells grown either in isolation or as cells in a confluent epithelia (isolated MTE cells, 24.2 ± 1.7 pF, n = 15; confluent MTE cells 23.7 ± 3.9 pF, n = 8; P = 0.89), indicating that the cells were not electrically coupled. This lack of electrical coupling has been described previously for both freshly isolated (Tarran et al., 1998) and cultured (Homolya et al., 2000) airway epithelia and allowed us to patch a confluent cell and to observe its responses as a single cell in electrical isolation from its neighbors. Under polarized conditions, CaCC was activated after 1 μM ionomycin exposure in 8/15 WT (MTE7b) and 8/16 CF (MTE18) cells (Fig. 3, A and B , respectively). (Note, cells that failed to respond to ionomycin did not exhibit detectable [post-ionomycin] changes in conductance.) All currents reversed close to the equilibrium potential for Cl− (WT Erev, −13.1 ± 3.0 mV; CF Erev, −18.8 ± 2.0 mV; P = 0.14). Consistent with data in the above section for ISC and volume secretion, CaCC activity was significantly greater in confluent CF (MTE18) cells than in confluent WT (MTE7b) cells (Fig. 3 C; P = 0.01 for outward conductance; P = 0.04 for inward conductance). Similarly, when we studied the Ca2+ response to UTP in confluent epithelia, CF cells exhibited a significantly elevated Ca2+ response compared with WTs (Fig. 3, D–F; for MTE7b, 238 ± 19 nM, n = 8; for MTE18, 421 ± 50 nM, n = 8; P = 0.001). These data indicate that both the conductance and the Ca2+ signal are elevated in polarized CF MTE cells as compared with WT controls (Fig. 3).
Figure 3.

Ca2+-activated Cl− conductances and Ca2+ signals in WT and CF MTE cells grown as confluent monolayers. (A and B, top) Current traces obtained at the start of whole cell recording (∼120 s) by holding the membrane potential at 0 mV and pulsing from −80 to +100 mV in 20-mV steps in WT and CF cells, respectively. (A and B, bottom) Current traces obtained using the same protocol ∼2–3 min after addition of 1 μM ionomycin to the bath in WT and CF cells, respectively. (C) Mean data of ionomycin-induced CaCCs. Black bars, WT cells (n = 8); striped bars, CF cells (n = 8). (D and E) Representative traces from WT and CF MTE cells, respectively, showing changes in the intracellular Ca2+ concentration (Cai 2+) after mucosal UTP addition. (F) Mean Δ Cai 2+. Black bars, WT cells (n = 8); striped bars, CF cells (n = 8). *, significantly different (P < 0.05) from WT. Data shown as mean ± SEM.
When we studied MTE cells under isolated, nonconfluent conditions, the number of WT and CF cells exhibiting CaCC activity in response to ionomycin significantly increased to 15/15 for both genotypes (both P < 0.01 compared with respective cell lines grown to confluency). However, no difference could be observed between CaCC activity measured in WT and CF cells grown under nonconfluent conditions (Fig. 4 , A–C). Similarly, isolated WT and CF MTE cells generated equal Cai 2+ responses after UTP addition (Fig. 4, D–F; for MTE7b, 412 ± 52 nM, n = 6; for MTE18, 442 ± 54 nM, n = 6) cells. Interestingly, mean CaCC activity was significantly greater in isolated/nonconfluent WT (MTE7b) cells than in confluent WT (MTE7b) cells, suggesting that the expression of CaCC was cell polarity dependent in WT cells (compare Fig. 3 C and 4 C; P < 0.01 for both outward and inward conductances). Although showing a similar trend toward being greater in magnitude, CaCC activity was not significantly different between confluent/nonconfluent CF (MTE18) cells (Figs. 3 C and 4 C; P = 0.09 and 0.54 for outward and inward conductances, respectively). This suggests that the “polarization dependency” of CaCC is also CFTR dependent. Importantly, the differences in CaCC activity and Ca2+ signals between WT and CF cells were lost under nonpolarized conditions (Fig. 4 C). These data indicate that greater CaCC activity and Ca2+ responses in CF as compared with WT airway epithelia may only be observed when the cells are studied as confluent preparations.
Figure 4.

Ca2+-activated Cl− conductances and Ca2+ signals in isolated WT and CF MTE cells. (A and B, top) Current traces obtained at the start of whole cell recording (∼120s) by holding the membrane potential at 0 mV and pulsing from −80 to +100 mV in 20-mV steps in WT and CF cells, respectively. (A and B, bottom) Current traces obtained using the same protocol ∼2–3 min after addition of 1 μM ionomycin to the bath in isolated WT and CF cells grown on plastic, respectively. (C) Mean data of ionomycin-induced CaCCs. Black bars, WT cells (n = 15); striped bars, CF cells (n = 15). (D and E) Representative traces from WT and CF MTE cells, respectively, grown as single cells on glass coverslips showing the change in [Ca2+]i after mucosal UTP addition. (F) Mean Δ [Ca2+]i signal. Black bars, WT cells (n = 6); striped bars, CF cells (n = 6). (Note, no significant difference was detected between phenotypes.) Data shown as mean ± SEM.
ISC in Apical Membrane Isolated Preparations of Confluent MTE Monolayers
To see whether changes in driving force were responsible for altered CF CaCC activity, we permeabilized the basolateral membrane by exposure to S. aureus α-toxin and measured ISC. Imposition of mucosal Cl− gradients routinely caused greater changes in ISC in CF than WT permeabilized cultures (Fig. 5 A). After stable imposition of low Cl− gradients, mucosal addition of 100 μM UTP to permeabilized cultures elicited an increase in ISC in MTE18 cultures that was significantly greater than in MTE7b cultures (Fig. 5 A; P = 0.01; both n = 12). Because the basolateral membrane was permeabilized, this difference was almost certainly due to changes in apical membrane UTP-regulated CaCC activity. As with UTP addition, ionomycin addition (1 μM) also caused a greater increase in ISC in CF as compared with WT cultures (Fig. 5 B; P < 0.05).
Figure 5.

ISC measurements of basolaterally α toxin-permeabilized WT and CF MTE monolayers. (A) Representative traces showing stepwise reductions in mucosal Cl− to 68 mM followed by mucosal UTP addition. (B, left) Mean data taken from A showing maximal ΔISC responses after mucosal UTP addition in WT cells (Black bars; n = 8) and CF cells (striped bars; n = 8). (right) Mean data showing maximal ΔISC responses after mucosal ionomycin addition to WT cells (Black bars; n = 8) and CF cells (striped bars). *, significantly different (P < 0.05) from WTs. Data shown as mean ± SEM.
Transfection of CFTR into CF MTE Monolayers: ISC and ASL Height Measurements
To confirm that the up-regulation of CaCC in confluent epithelia was related to the loss of CFTR expression, we stably transfected CFTR into the CF tracheal cell line using a retrovirus-based transfection system (CF+CFTR) and measured ISC in these cells under nonpermeabilized conditions in Ussing chambers. Mucosal UTP addition resulted in the stimulation of a significantly larger current in the CF as compared with the CF+CFTR cell line (91 ± 6.8 vs. 25 ± 4.6 μA/cm2, respectively; both n = 8; P < 0.01). To confirm that CFTR was active after transfection, forskolin was added to the CF+CFTR cell line, which routinely resulted in the appearance of a robust cAMP-stimulated Cl− current that was absent in the CF (MTE18) cultures (Fig. 6, A and B) . Post-forskolin addition of UTP stimulated CaCC in both cell lines (Fig. 6, A and B). However, CFTR transfection again significantly down-regulated UTP-mediated ΔISC in CF+CFTR cells (Fig. 6, A and B; P = 0.001).
Figure 6.

Stable transfection of CFTR into the CF MTE monolayers: effects on ISC and ASL height. (A) Exemplar ISC traces from CF and CF+CFTR cell lines showing 1 μM forskolin followed by 100 μM UTP added mucosally. (B, left) mean forskolin responses (CF, n = 10 and CF+CFTR, n = 8). (Right) Mean (post-forskolin) UTP responses (CF, n = 10 and CF+CFTR, n = 8). (C) Confocal images of ASL (red) obtained 24 h after PBS/Texas red–dextran addition and 10 min later after mucosal addition of powdered UTP suspended in PFC (∼200 μM). (Note, immediately after PBS Texas red–dextran addition [i.e., at t = 0] all cultures had approximately equal heights [∼4 μm]). (D) Mean ASL heights for WT (n = 4), CF (n = 6), and CF+CFTR (n = 4) cultures. Black bars, 24 h after initial volume addition; striped bars, 10 min after UTP addition. *, significantly different (P < 0.05) from pre-UTP values; #, significantly different (P < 0.05) from WTs. Data shown as mean ± SEM.
We also investigated the effects of CFTR-correction on (1) basal and (2) UTP-stimulated liquid secretion by scanning ASL height with XZ confocal microscopy. We prelabeled WT, CF, and CF+CFTR cultures at t = 0 with PBS labeled with Texas red–dextran. After aspiration of excess liquid, all cell types possessed equal ASL heights (∼4 μm) at this time point. Interestingly, after the 24-h incubation period, basal ASL height was significantly greater in WT (MTE7b) and CF+CFTR cell lines as compared with the CF (MTE18) cell line (Fig. 6, C and D). This indicates that both WT and CF+CFTR cultures secreted ASL over this 24-h period, whereas CF cultures neither secreted nor absorbed ASL. Therefore, it is likely that CFTR plays a role in basal liquid secretion that is not “rescued” by CaCC under these conditions. Consistent with the ISC measurements, acute UTP-induced volume secretion occurred in all three genotypes but was down-regulated in the WT and CF+CFTR lines as compared with the CF cell line, confirming that CaCC-mediated volume secretion is indeed CFTR-dependent (Fig. 6, C and D).
DISCUSSION
Ca2+-activated Cl− Conductances in Freshly Excised Tissues
CaCC patch-clamped in freshly excised nasal epithelia was biophysically characterized by activation at positive potentials and inactivation at negative potentials, and was stimulated by submicromolar amounts of intracellular Ca2+. Despite being ubiquitous, there have been few reports of CaCC in native airway epithelia and this paper should aid in defining this conductance. Importantly, the properties of this conductance are consistent with CaCCs isolated from other noncultured cells including acinar cells (Giovannucci et al., 2002), pancreatic ducts (Gray et al., 1994; Winpenny et al., 1998), and Xenopus oocytes (Qu and Hartzell, 2000; for review see Kidd and Thorn, 2000). Surprisingly, although this conductance was active with ≥0.5 μM  , it was inactive when
  was reduced to 0.1 or 0.3 μM. Similarly steep dose–responses have been described for CaCC in freshly-excised pancreatic and parotid acinar cells (Giovannucci et al., 2002) and has also been shown to be regulated in magnitude over the range 0.1–0.3 μM
  in Xenopus oocytes (Qu and Hartzell, 2000). However, the
  response shown in freshly excised nasal cells is inconsistent with data elsewhere in this paper where UTP-induced increases in
  of ∼300 nM are sufficient to activate CaCC (Figs. 3 and 4). The dose–response to
  may have been altered in the freshly isolated nasal cells as a result of the isolation process. A similar alteration may have occurred for the actual levels of CaCC activity, which appeared to be different in freshly isolated cells as compared with intact tissue (Grubb et al., 1994) or confluent MTE cells (Fig. 3; see next paragraph).
Regulation of CaCC Activity by CFTR Is Dependent on Cellular Polarity
Freshly disaggregated WT and CF nasal ciliated cells possessed similar CaCC activity after ionomycin exposure (Fig. 1). In contrast, Ca2+-mediated anion secretion was elevated in freshly excised sheets of murine CF nasal epithelia over levels found in WT controls (Grubb et al., 1994). Therefore, it is likely that despite our best efforts, the time needed for disaggregation and isolation of single cells significantly changes their phenotype. Similar differences between intact epithelia and single cells have previously been reported in both the murine pancreas and in a human colonic cell line (HT-29; Morris et al., 1992). For example, Clarke et al. (1994) detected an up-regulated CaCC in CF compared with WT pancreatic monolayers, but when single pancreatic ductal cells were isolated and patch clamped (Gray et al., 1994; Winpenny et al., 1995) no difference in CaCC density between CF and WT cells was observed. Similarly, Morris et al. (1992) found that CaCC activity in HT-29 cells decreased when the cells were grown as confluent epithelia. Our patch-clamp studies on confluent (Fig. 3) versus single (Fig. 4) tracheal cell lines confirm that epithelial integrity and polarization do affect CaCC activity in airway epithelia and this data strongly implies that the greatest change was a reduction in CaCC activity in polarized WT epithelia. We believe this is the first work to demonstrate that cell polarity is necessary for CFTR to be able to regulate CaCC in airway epithelia. As yet, we have no explanation for the polarization dependence of CaCC activity. Intriguingly, a role for plasma membrane Cl− conductances in controlling cell cycle activity has been suggested (for review see Nilius, 2001) and CaCC may have an as yet unidentified “housekeeping” role where its expression/activity may vary with the cell cycle. Polarization-dependent CaCC variability will likely be a good candidate for genomic-based approaches that may yield novel regulators of this channel.
Altered P2Y2/Ca2+ Signaling?
The P2Y2 pathway may be up-regulated in CF, which could also account for changes in CaCC activity. However, ionomycin-or thapsigargin-stimulation bypassed this receptor and directly elevated intracellular Ca2+, resulting in significantly greater CaCC activity in CF over WT tracheal cultures. This suggests that the increase in CaCC seen in CF airways occurs at least in part downstream of the P2Y2/Ca2+ signaling receptor and is a direct increase in conductance, not purely a Ca2+-signaling phenomenon. In agreement with this observation, it has recently been reported that the total amount of P2Y2 mRNA is not different between normal and CF human airway epithelia (Ribeiro et al., 2001). These data do not preclude the possibility that multiple components may contribute to the increased Ca2+-mediated Cl− secretion observed in CF airway epithelia and indeed, up-regulation of Ca2+ signaling in confluent CF tracheal cultures did occur. Like the patch-clamp measurements of CaCC activity, the Ca2+ signal was dependent on cell polarity and these differences were lost in nonpolarized MTE cells, perhaps also linking P2Y2-dependent Ca2+ signaling to the cell cycle. However, both the patch-clamp and the permeabilized Ussing chamber experiments indicate that CaCC is up-regulated independently of the Ca2+ signal, likely at the channel level by a change in either the number of channels or their mean open time.
Altered Driving Force?
During our patch-clamp recordings, cation currents were inhibited by replacement of Na+ and K+ with an impermeant cation making it likely that the increase in CaCC activity was directly attributable to changes in CaCCs conductance. However, it is possible that the driving force for mucosal Cl− exit may be different in CF airway epithelia as a result of up-regulation of a basolateral K+ conductance (Boucher, 1994; Devor et al., 2000), which could contribute to the increased Ca2+-mediated anion secretion detected in intact CF cultures. Thus, to remove any possible effect of basolateral K+ conductances, we performed Ussing chamber studies on apical membrane-isolated MTE cultures after treatment with S. aureus α toxin. We imposed an electrochemical driving force for Cl− exit that was equal for WT and CF cultures. Under these conditions, the response to a mucosal low Cl− gradient was greater in CF than WT cultures. We are unsure why this difference occurred because Rt was not different between genotypes. However, the increased gradients seen in CF cultures may reflect a greater number of open channels in CF cultures. Importantly, the observed increase in CF CaCC activity under these conditions rule out increased driving force as being responsible for up-regulating CaCC activity in CF airway epithelia.
Altered Channel Number/Characteristics?
The increase in CF CaCC may also be the result of altered channel regulation, i.e., there may be the same number of CaCC channels in the apical cell membranes of both WT and CF cells, but their regulation may be different in the CF cells. Clearly, the identification of a molecular candidate for CaCC would greatly advance this field and would allow for definitive studies of channel expression. The ClCa family represents possible candidates for airway CaCC and several functional studies have been performed on different members of this gene family heterologously expressed in either HEK293 cells or Xenopus oocytes (for review see Fuller and Benos, 2000). In general, these studies have shown that the ClCa molecules can function as Cl− channels that are activated by fairly high concentrations of Ca2+ (>1 mM), have outward rectifying currents and are inhibited by DTT (2 mM) and DIDS (300 μM). However, we were unable to detect expression of the mClCa clone in either of the MTE lines by Northern blot analysis. Furthermore, RT-PCR only detected expression of mClCa in the control (MTE7b) cell line and not in the CF (MTE18) cell line (Gabriel et al., 2000b). Similarly, Gallietta and co-workers (Romio et al., 1999) detected only minuscule expression of the human analogue (hClCa) in human tracheal epithelia, and Papassotiriou et al. (2001) failed to detect mClCa (1–3) in Ehrlich ascites tumor cells, both of which cell types exhibit high levels of functional CaCC activity. Taken together, these data suggest that there is little correlation between expression of the ClCa family and CaCC activity, as judged by comparison between electrophysiological evidence and gene expression.
Regulated But Not Basal Liquid (Volume) Secretion–Mediated by CaCC
Strikingly, after 24 h we found that ASL height was significantly greater in WT and CF+CFTR than in CF tracheal cell lines under basal conditions. These tracheal cell lines express little ENaC, and so this difference is not due to CF-associated Na+ hyperabsorption (Stutts et al., 1995; Matsui et al., 1998) and is likely due to basal secretion. These changes in ASL height occurred in the absence of any CFTR agonists, indicating that some CFTR-mediated anion secretion may occur under basal conditions in WT and CF+CFTR cultures. In support of these findings, we have recently reported the presence of a basal bumetanide-sensitive transepithelial potential difference. in normal human tracheal epithelia, indicating that anion secretion may play a role in maintaining steady-state ASL height (Tarran et al., 2001a).
The height of WT and CF+CFTR cultures increased by ∼15 μm in 24 h. However, after UTP addition, height rapidly increased by ∼5 μm in <10 min, whereas CF cultures secreted double this amount. This suggests that secretion rates are variable, with MTE cultures exhibiting low and or varied initial rates of secretion followed by an increase after UTP addition. To see if the high rates of volume secretion induced by UTP addition were reasonable, we compared the ionic fluxes induced by the volume changes with ISC measured in Ussing chambers. Assuming that ASL [Cl−] is 130 mM (Tarran et al., 2001a,b), that volume secretion by WT (0.5 μl/cm2) and CF (1.0 μl/cm2) cultures occurs within 3 min after UTP addition (for a detailed time-course of UTP-stimulated ASL volume secretion see Tarran et al., 2001b) and that 100 μA/cm2 is equivalent 3.73 mEq/cm2/h, then the equivalent current that would have been generated by UTP-mediated volume secretion is 35 μA/cm2 for WT/CF+CFTR cultures and 70 μA/cm2 for CF cultures. These calculated values are in good agreement with ISC measurements made in Ussing chambers (Figs. 2 and 6) and while strictly speaking, ASL movement more approximates open circuit conditions, it has previously been shown that UTP mediated anion secretion in airway epithelia is similar under both open and closed circuit conditions (Boucher, 1994) making this comparison appropriate.
Our present data suggest that Cl− secretion is diminished in CF MTE monolayers under resting (basal) conditions and it would appear that 1) CFTR is paramount for basal ASL secretion and 2) that CaCC plays a lesser role in basal ASL secretion. This appears paradoxical because CF mice appear to be protected from CF lung disease, possibly by gain of function of CaCC. Upon stimulation, CaCC activity indeed induced greater ASL secretion in CF than in WT monolayers. However, the rates of nucleotide release and hydrolysis may be different in vivo, resulting greater free nucleotide levels in the ASL and a correspondingly greater tonic activation of CaCC. Thus, we speculate that in vivo, basal CaCC activity may be greater following nucleotide release and even sufficient to compensate for the loss of basal CFTR activity.
Conclusions
We find that CaCC is increased in CF as compared with WT murine airway epithelia. However, epithelial confluence and polarity are needed to detect this phenomenon. The apparent regulation of CaCC by epithelial polarity strongly implies that where possible, polarized epithelia be studied in preference to isolated cells. Finally, our data provide evidence that CaCC plays a role in acute but not basal regulation of ASL height.
Acknowledgments
We gratefully acknowledge the technical assistance of Mariya Makhlina, Talia Miller, and David Stephenson and wish to thank Dr. M. Jackson Stutts for critically reading this manuscript and Dr. Terry E. Machen for thoughtful advice and discussions. CF null mice were kindly supplied by Dr. William H. Colledge.
This work was supported by the Cystic Fibrosis Foundation and by National Institutes of Health HL62564 (to S.E. Gabriel).
Address correspondence to Robert Tarran at his present address, 231 Life Sciences Addition, Dept. of Molecular and Cell Biology, University of California, Berkeley, Berkeley, CA 94720-3200. Fax: (510) 643-6791; E-mail: tarran@uclink.berkeley.edu
Footnotes
Abbreviations used in this paper: ASL, airway surface liquid; CaCC, Ca2+-activated Cl− conductance; CF, cystic fibrosis; MTE, mouse tracheal epithelial; PFC, perfluorocarbon; WT, wild-type.
References
- Alton, E.W., S.D. Manning, P.J. Schlatter, D.M. Geddes, and A.J. Williams. 1991. Characterization of a Ca2+-dependent anion channel from sheep tracheal epithelium incorporated into planar bilayers. J. Physiol. 443:137–159. [DOI] [PMC free article] [PubMed] [Google Scholar]
- Boucher, R.C. 1994. Human airway ion transport. Am. J. Respir. Crit. Care Med. 150:271–281. [DOI] [PubMed] [Google Scholar]
- Knowles, M.R., and R.C. Boucher. 2002. Mucus clearance as a primary innate defense mechanism for mammalian airways. J. Clin. Invest. 109:571–577. [DOI] [PMC free article] [PubMed] [Google Scholar]
- Clarke, L.L., B.R. Grubb, J.R. Yankaskas, C.U. Cotton, A. McKenzie, and R.C. Boucher. 1994. Relationship of a non-cystic fibrosis transmembrane conductance regulator-mediated chloride conductance to organ-level disease in CFTR (−/−) mice. Proc. Natl. Acad. Sci. USA. 91:479–483. [DOI] [PMC free article] [PubMed] [Google Scholar]
- Devor, D.C., R.J. Bridges, and J.M. Pilewski. 2000. Pharmacological modulation of ion transport across wild-type and DeltaF508 CFTR-expressing human bronchial epithelia. Am. J. Physiol. 279:461–479. [DOI] [PubMed] [Google Scholar]
- Fuller, C.M., and D.J. Benos. 2000. Ca2+-activated Cl− channels: a newly emerging anion transport family. News Physiol. Sci. 15:165–171. [PubMed] [Google Scholar]
- Gabriel, S.E., M. Makhlina, E. Martsen, E.J. Thomas, M.I. Lethem, and R.C. Boucher. 2000. a. Permeabilization via the P2X7 purinoreceptor reveals the presence of a Ca2+-activated Cl− conductance in the apical membrane of murine tracheal epithelial cells. J. Biol. Chem. 275:35028–35033. [DOI] [PubMed] [Google Scholar]
- Gabriel, S.E., R. Tarran, E. Martsen, and R.C. Boucher. 2000. b. Heterologous expression of CFTR downregulates Cl− and fluid secretory responses mediated by Ca2+ in two different model systems. Pediatr. Pulmonology Suppl. 20:197. [Google Scholar]
- Giovannucci, D.R., J.L. Bruce, S.V. Straub, J. Arreola, J. Sneyd, T.J. Shuttleworth, and D.I. Yule. 2002. Cytosolic Ca2+ and Ca2+-activated Cl− current dynamics: insights from two functionally distinct mouse exocrine cells. J. Physiol. 540:469–484. [DOI] [PMC free article] [PubMed] [Google Scholar]
- Gray, M.A., J.P. Winpenny, D.J. Porteous, J.R. Dorin, and B.E. Argent. 1994. CFTR and calcium-activated chloride currents in pancreatic duct cells of a transgenic CF mouse. Am. J. Physiol. 266:C213–C221. [DOI] [PubMed] [Google Scholar]
- Grubb, B.R., and R.C. Boucher. 1999. Pathophysiology of gene-targeted mouse models for cystic fibrosis. Physiol. Rev. 79:S193–S214. [DOI] [PubMed] [Google Scholar]
- Grubb, B.R., R.N. Vick, and R.C. Boucher. 1994. Hyperabsorption of sodium and raised calcium mediated chloride secretion in nasal epithelia of CF mice. Am. J. Physiol. 266:C1478–C1483. [DOI] [PubMed] [Google Scholar]
- Gruber, A.D., R.C. Elble, H.L. Ji, K.D. Schreur, C.M. Fuller, and B.U. Pauli. 1998. Genomic cloning, molecular characterization, and functional analysis of human CLCA1, the first human member of the family of Ca2+-activated Cl− channel proteins. Genomics. 54:200–214. [DOI] [PubMed] [Google Scholar]
- Gruber, A.D., K.D. Schreur, H.L. Ji, C.M. Fuller, and B.U. Pauli. 1999. Molecular cloning and transmembrane structure of hCLCA2 from human lung, trachea, and mammary gland. Am. J. Physiol. 276:C1261–C1270. [DOI] [PubMed] [Google Scholar]
- Guggino, W.B. 2001. Cystic fibrosis salt/fluid controversy: in the thick of it. Nat. Med. 7:888–889. [DOI] [PubMed] [Google Scholar]
- Homolya, L., T.H. Steinberg, and R.C. Boucher. 2000. Cell to cell communication in response to mechanical stress via bilateral release of ATP and UTP in polarized epithelia. J. Cell Biol. 150:1349–1360. [DOI] [PMC free article] [PubMed] [Google Scholar]
- Johnson, L.G., S.E. Boyles, J. Wilson, and R.C. Boucher. 1995. Normalisation of raised sodium-absorption and raised calcium-mediated chloride secretion by adenovirus-mediated expression of cystic fibrosis transmembrane conductance regulator in primary human cystic fibrosis airway epithelial cells. J. Clin. Invest. 95:1377–1382. [DOI] [PMC free article] [PubMed] [Google Scholar]
- Kidd, J.F., and P. Thorn. 2000. Intracellular Ca2+ and Cl− channel activation in secretory cells. Annu. Rev. Physiol. 62:493–513. [DOI] [PubMed] [Google Scholar]
- Knowles, M.R., L.L. Clarke, and R.C. Boucher. 1991. Activation by extracellular nucleotides of chloride secretion in the airway epithelia of patients with cystic fibrosis. N. Engl. J. Med. 325:533–538. [DOI] [PubMed] [Google Scholar]
- Kunzelmann, K., S. Kathofer, and R. Greger. 1995. Na+ and Cl− conductances in airway epithelial cells: increased Na+ conductance in cystic fibrosis cells. Pflügers Arch. 431:1–9. [DOI] [PubMed] [Google Scholar]
- Kunzelmann, K., M. Mall, M. Briel, A. Hipper, R. Nitschke, S. Ricken, and R. Greger. 1997. The cystic fibrosis transmembrane conductance regulator attenuates the endogenous Ca2+ activated Cl− conductance of Xenopus oocytes Pflügers Arch. 435:178–181. [DOI] [PubMed] [Google Scholar]
- Matsui, H., B.R. Grubb, R. Tarran, S.H. Randell, J.T. Gatzy, C.W. Davis, and R.C. Boucher. 1998. Evidence for periciliary liquid layer depletion, not abnormal ion composition, in the pathogenesis of cystic fibrosis airways disease. Cell. 95:1005–1015. [DOI] [PubMed] [Google Scholar]
- Morris, A.P., S.A. Cunningham, D.J. Benos, and R.A. Frizzell. 1992. Cellular differentiation is required for cAMP but not Ca2+-dependent Cl− secretion in colonic epithelial cells expressing high levels of cystic fibrosis transmembrane conductance regulator. J. Biol. Chem. 267:5575–5583. [PubMed] [Google Scholar]
- Nilius, B. 2001. Chloride channels go cell cycling. J. Physiol. 532:581a. [DOI] [PMC free article] [PubMed] [Google Scholar]
- Papassotiriou, J., J. Eggermont, G. Droogmans, and B. Nilius. 2001. Ca2+-activated Cl− channels in Ehrlich ascites tumor cells are distinct from mCLCA1, 2 and 3. Pflügers Arch. 442:273–279. [DOI] [PubMed] [Google Scholar]
- Paradiso, A.M., C.M. Ribeiro, and R.C. Boucher. 2001. Polarized signaling via purinoceptors in normal and cystic fibrosis airway epithelia. J. Gen. Physiol. 117:53–67. [DOI] [PMC free article] [PubMed] [Google Scholar]
- Qu, Z., and H.C. Hartzell. 2000. Anion permeation in Ca2+-activated Cl− channels. J. Gen. Physiol. 116:825–844. [DOI] [PMC free article] [PubMed] [Google Scholar]
- Ratcliff, R., M.J. Evans, A.W. Cuthbert, L.J. MacVinish, D.D. Foster, D. Anderson, and W.H. Colledge. 1993. Production of a severe cystic fibrosis mutation in mice by gene targeting. Nat. Genet. 4:35–41. [DOI] [PubMed] [Google Scholar]
- Ribeiro, C.P., A.M. Paradiso, and R.C. Boucher. 2001. Upregulation of the apical endoplasmic reticulem network in CF human airway epithelia. Pediatr. Pulmonol. S22:235. [Google Scholar]
- Romio, L., L. Musante, R. Cinti, M. Seri, O. Moran, O. Zegarra-Moran, and L.J. Galietta. 1999. Characterization of a murine gene homologous to the bovine CaCC chloride channel. Gene. 228:181–188. [DOI] [PubMed] [Google Scholar]
- Snouwaert, J.N., K.K. Brigman, A.M. Latour, N.N. Malouf, R.C. Boucher, O. Smithies, and B.H. Koller. 1992. An animal model for cystic fibrosis made by gene targetting. Science. 257:1083–1088. [DOI] [PubMed] [Google Scholar]
- Stutts, M.J., C.M. Canessa, J.C. Olsen, M. Hamrick, J.A. Cohn, B.C. Rossier, and R.C. Boucher. 1995. CFTR as a cAMP-dependent regulator of sodium channels. Science. 269:847–850. [DOI] [PubMed] [Google Scholar]
- Tarran, R., M.A. Gray, M.J. Evans, W.H. Colledge, R. Ratcliff, and B.E. Argent. 1998. Basal chloride currents in murine airway epithelial cells: modulation by CFTR. Am. J. Physiol. 274:C904–C913. [DOI] [PubMed] [Google Scholar]
- Tarran, R., B.R. Grubb, J.T. Gatzy, C.W. Davis, and R.C. Boucher. 2001. a. Relative roles of surface forces and ion transport in the modulation of airway surface liquid volume and composition. J. Gen. Physiol. 118:223–236. [DOI] [PMC free article] [PubMed] [Google Scholar]
- Tarran, R., B.R. Grubb, D. Parsons, M. Picher, A.J. Hirsh, C.W. Davis, and R.C. Boucher. 2001. b. The CF salt controversy: Implications for therapies designed to correct abnormalities in CF airway surface liquid based on in vivo and in vitro studies. Mol. Cell. 8:149–158. [DOI] [PubMed] [Google Scholar]
- Thomas, E.J., S.E. Gabriel, M. Makhlina, S.P. Hardy, and M.I. Lethem. 2000. Expression of nucleotide regulated Cl− currents in CF and normal mouse tracheal epithelial cell lines. Am. J. Physiol. 279:C1578–C1586. [DOI] [PubMed] [Google Scholar]
- Wei, L., A. Vankeerberghen, H. Cuppens, J.J. Cassiman, G. Droogmans, and B. Nilius. 2001. The C-terminal part of the R-domain, but not the PDZ binding motif, of CFTR is involved in interaction with Ca2+-activated Cl− channels. Pflügers Arch. 442:280–285. [DOI] [PubMed] [Google Scholar]
- Winpenny, J.P., B. Verdon, H.L. McAlroy, W.H. Colledge, R. Ratcliff, M.J. Evans, M.A. Gray, and B.E. Argent. 1995. Calcium-activated chloride conductance is not increased in pancreatic duct cells of CF mice. Pflügers Arch. 430:26–33. [DOI] [PubMed] [Google Scholar]
- Winpenny, J.P., A. Harris, M.A. Hollingsworth, B.E. Argent, and M.A. Gray. 1998. Calcium-activated chloride conductance in a pancreatic adenocarcinoma cell line of ductal origin (HPAF) and in freshly isolated human pancreatic duct cells. Pflügers Arch. 435:796–803. [DOI] [PubMed] [Google Scholar]