Abstract
In intensive care physiological variables of the critically ill are measured and recorded in short time intervals. The proper extraction and interpretation of the information contained in this flood of information can hardly be done by experience alone. Intelligent alarm systems are needed to provide suitable bedside decision support. So far there is no commonly accepted standard for detecting the actual clinical state from the patient record. We use the statistical methodology of graphical models based on partial correlations for detecting time-varying relationships between physiological variables. Graphical models provide information on the relationships among physiological variables that is helpful e.g. for variable selection. Separate analyses for different pathophysiological states show that distinct clinical states are characterized by distinct partial correlation structures. Hence, this technique can provide new insights into physiological mechanisms.
Full text
PDF


Selected References
These references are in PubMed. This may not be the complete list of references from this article.
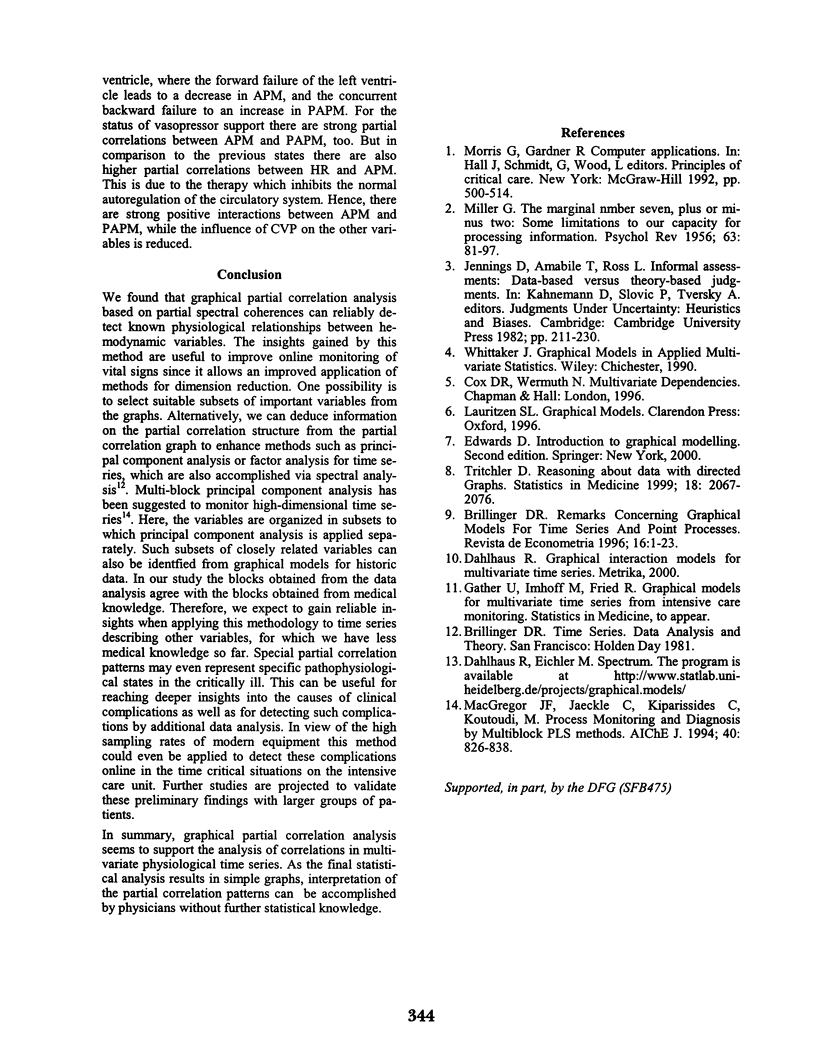
- MILLER G. A. The magical number seven plus or minus two: some limits on our capacity for processing information. Psychol Rev. 1956 Mar;63(2):81–97. [PubMed] [Google Scholar]
- Tritchler D. Reasoning about data with directed graphs. Stat Med. 1999 Aug 30;18(16):2067–2076. doi: 10.1002/(sici)1097-0258(19990830)18:16<2067::aid-sim182>3.0.co;2-2. [DOI] [PubMed] [Google Scholar]


