

Abstract
The yellow and cyan variants of green fluorescent protein (GFP) constitute an excellent pair for fluorescence resonance energy transfer (FRET) and can be used to study conformational rearrangements of proteins. Our aim was to develop a library of fluorescent large conductance voltage- and Ca2+-gated channels (BK or slo channels) for future use in FRET studies. We report the results of a random insertion of YFP and CFP into multiple sites of the α subunit of the hslo channel using a Tn5 transposon-based technique. 55 unique fluorescent fusion proteins were obtained and tested for cell surface expression and channel function. 19 constructs are expressed at the plasma membrane and show voltage and Ca2+-dependent currents. In 16 of them the voltage and Ca2+ dependence is very similar to the wild-type channel. Two insertions in the Ca2+ bowl and one in the RCK2 domain showed a strong shift in the G-V curve. The remaining 36 constructs were retained intracellularly; a solubility assay suggests that these proteins are not forming intracellular aggregates. The “success rate” of 19 out of 55 hslo insertion constructs compares very favorably with other studies of random GFP fusions.
INTRODUCTION
Large-conductance voltage- and Ca2+-activated K+ channels (BK channels) are modulated synergistically by voltage and Ca2+ (Horrigan and Aldrich, 2002), providing a unique link between chemical and electrical signaling in the cell (Toro et al., 1998). BK channels are found in a wide range of tissues, where they play diverse roles. They contribute to the feedback control of Ca2+ influx and neurotransmission, the repolarization of action potentials and the frequency adaptation processes in the nervous system (Crest and Gola, 1993; Hu et al., 2001), and to the tuning of the electrical resonance in hair cells (Rosenblatt et al., 1997).
BK channels are formed as tetramers of the pore-forming α subunits that sometimes form a complex with regulatory β subunits (Wallner et al., 1995). The α subunits are coded by the slo gene. Cloning the cDNA that encodes the slo α subunit revealed that the predicted protein has six transmembrane regions (S1–S6), placing it in the superfamily of voltage-gated ion channels. Nevertheless, slo differs from the Kv family in having an additional transmembrane domain (S0) at the NH2 terminus, and a large COOH terminus with four hydrophobic regions originally designated S7–S10 (Butler et al., 1993; Meera et al., 1997). Subsequent studies have proposed the existence of several functional domains in the COOH terminus.
Jiang et al. (2001) described a new class of domains present in some K+ channels, named RCK domains for their possible role in the regulation of the conductance to K+. In the bacterial MthK channel tetramer, eight RCK domains have been proposed to form a “gating ring” that transduces Ca2+ binding into opening of the channel pore (Jiang et al., 2002). BK α subunits present two RCK domains in the COOH-terminal region (Jiang et al., 2002; Roosild et al., 2004), separated by a nonconserved linker (Schreiber and Salkoff, 1997). It is tempting to conclude that a similar gating ring mechanism is applicable in BK channels, but the differences between MthK and BK channels are substantial: the Ca2+ binding sites in MthK are not conserved in BK channels; MthK has a relatively low Ca2+ sensitivity; and the regulation mechanism of BK channels is more complex, involving both Ca2+ and voltage (Horrigan and Aldrich, 2002). Meanwhile, some authors have proposed a role of the first RCK domain in slo tetramerization (Quirk and Reinhart, 2001).
Immediately following the second RCK domain there is a highly conserved 28–amino acid region rich in aspartate residues referred to as the “Ca2+ bowl” (Wei et al., 1994). Mutations in this region have large effects on the Ca2+ sensitivity of slo channels (Wei et al., 1994; Schreiber and Salkoff, 1997; Schreiber et al., 1999; Bao et al., 2002), although other sites in the RCK1 domain appear to also participate in high affinity Ca2+ sensitivity (Bao et al., 2002; Xia et al., 2002) as well as in low affinity Ca2+ and Mg2+ sensitivity (Shi and Cui, 2001; Zhang et al., 2001; Xia et al., 2002).
A sequence near the COOH terminus is similar to that of the superfamily of serine proteinase (Ser-P) enzymes (Moss et al., 1996; Favre et al., 2000). The functional relevance of this domain is not clear. It has been demonstrated that Ser-P inhibitors bind to slo channels producing discrete subconductance events (Moss et al., 1996; Favre and Moczydlowski, 1999; Favre et al., 2000), suggesting a role of this domain in slo gating as well as modulation by other cytoplasmic or membrane-associated regulatory components (Moss et al., 1996).
The yellow and cyan variants of the green fluorescent protein (YFP and CFP respectively) constitute an excellent pair for fluorescence resonance energy transfer (FRET), and can be used to study the conformational rearrangements of ion channels that are associated with function (Zheng and Zagotta, 2003). The engineering of suitable GFP fusion proteins is however difficult. GFP insertion sites must be found that fulfill two requirements: (1) the fusion proteins should generate functional channels with properties similar to the wild-type channel; (2) the insertion sites should lie in appropriate locations of domains involved in the conformational rearrangements. Attempts to predict such sites have been unsuccessful, even in cases where the native protein structure is known. Given these uncertainties and the time-consuming process of generating individual fusion proteins using conventional molecular biology techniques, we decided to use transposable elements to randomly insert YFP and CFP into different domains of the human slo α-subunit (hslo). We have expressed these mutants in mammalian cells and studied their ability to form functional BK channels. Out of 55 constructs tested, 19 were expressed at the plasma membrane and form functional channels. Most of them appear to be comparable to wild-type channels in terms of voltage and Ca2+ sensitivity. Only two constructs with insertions within the Ca2+ bowl and a construct with an insertion in the RCK2 domain showed altered functional properties. Therefore, we have been able to generate rapidly a library of fluorescent hslo fusion proteins that promises to be a useful tool for future FRET studies of conformational changes of BK channels associated with function.
MATERIALS AND METHODS
Target Plasmids, Transposons, and Transposition Reactions
The full-length human slo cDNA isolated from uterine smooth muscle (hslo; GenBank/EMBL/DDBJ accession no. U11058; Wallner et al., 1995) was modified by Dr. A. Tinker in the 5′ end to carry a six-histidine tag followed by the FLAG epitope DYKDDDDK. This construct was provided to us by G. Moss (University College London, London, UK). A HindIII/NotI fragment carrying this modified hslo cDNA was cloned into a pCMVSport/βgal-derived vector. The CFP transposon <TcPT-1> was as previously reported (Sheridan et al., 2002). The transposon encoding YFP <TvPT-0> was made by replacing the AscI-flanked EGFP fragment in <TgPT-0> (Sheridan et al., 2002) with the corresponding YFP fragment (Venus variant; Nagai et al., 2002). The two transposons use different reading frames to increase the chance of insertions yielding functional proteins (Sheridan et al., 2002). In view of the low probability of transposition in an in vitro reaction, a selectable marker was introduced into each transposon in the form of a Kanamicin resistance cassette (Kanr) flanked by SrfI restriction sites. Immediately before the Kanr there is a stop codon; therefore, each clone containing an in-frame insertion should encode a truncated protein with YFP or CFP at the COOH terminus.
The transposon can be inserted anywhere in the target plasmid; in our case, the probability that the insertion occurs into the hslo cDNA, in the correct orientation and reading frame, is expected to be ∼9%. Thus our screening strategy consisted of several steps. First, we performed two separate in vitro transposition reactions, one for each transposon, following the protocol described by Sheridan et al. (2002). The resulting DNA was transformed into Escherichia coli. Single colonies resistant to ampicillin (transformed clones) and kanamycin (marker for transposition) were picked and grown in 96-well plates. Transposed plasmids were then isolated in a 96-well format with Eppendorf PerfectPREP-96 Vac Direct Bind miniprep kits (Eppendorf) on a PerkinElmer MultiPROBE II HT liquid handling robot. Approximately 10,000 transposed clones were obtained; we purified DNA from 672 clones of each reaction (1,344 clones in total). We identified correctly oriented in-frame insertions by transiently transfecting each truncated construct into HEK293 cells, which were screened for fluorescence. The probability of transposition is not uniform (Goryshin et al., 1998), so we expected some clones to have identical insertion sites. The 5′ boundaries of the insertions were determined for all fluorescent clones by DNA sequencing (HHMI Biopolymer/Keck Foundation Biotechnology Laboratory, Yale University School of Medicine) to identify unique insertions and localize the exact insertion site. These clones were digested with SrfI to remove the Kanr cassette and obtain the full-length fusion constructs.
Screening of Transposed Clones
HEK-293 cells were seeded in 96-well glass bottom tissue culture plates (NalgeNUNC) and grown in DMEM (GIBCO BRL) supplemented with 10% FBS at 37°C in an atmosphere containing 5% CO2. Cells were transfected with plasmid DNA from individual CFP- and YFP-transposed clones and Lipofectamine 2000 (GIBCO BRL) following standard protocols. The cells were screened for YFP and CFP fluorescence ∼24 h after transfection with a 20× objective on a Carl Zeiss MicroImaging, Inc. inverted fluorescence microscope.
Cell-surface Immunostaining
CHO cells were plated in Falcon culture slides (Becton Dickinson Labware) and grown in α-MEM (GIBCO BRL) with 10% FBS at 37°C in 5% CO2. Cells were transfected 18–24 h before experiments with plasmid DNA of each full-length fusion protein and Lipofectamine 2000 (GIBCO BRL). All staining procedures were performed at 4°C. Cells were washed twice with PBS2+ (PBS with 2 mM CaCl2 and 0.5 mM MgCl2), blocked with 1% BSA and 10% goat serum for 1 h and further incubated with 5 μg/ml mouse monoclonal anti-FLAG M2 antibody (Sigma-Aldrich) for 45 min. Cells were then fixed with 2% formaldehyde in PBS2+ for 10 min, washed extensively with PBS and incubated with 10 μg/ml of an Alexa Fluor 594–conjugated goat anti–mouse IgG antibody (Molecular Probes) for 45 min. After several washes with PBS, the cells were mounted with Aquamount (Lerner Laboratories). Images of the slides were collected with a Carl Zeiss MicroImaging, Inc. laser scanning microscope equipped with a 40× oil-immersion objective. YFP and CFP were excited using the Argon laser 488-nm line, whereas Alexa 594 was excited using the He-Ne laser 568-nm line. The emission signals were filtered with a Carl Zeiss MicroImaging, Inc. 515–565-nm filter (YFP/CFP emission) or with a 590–640 filter (Alexa 594 signal).
Triton X-100 Solubilization and Western Blot Analysis
A protocol modified from Zarei et al. (2004) was used. Transfected CHO cells were permeabilized in lysis buffer (150 mM NaCl, protease inhibitors, 1 μg/ml DNaseI, 20 mM Tris-HCl, pH 7.4) containing various concentrations of Triton X-100 (0, 0.1, 0.4, 1, 2%). After a 10-min incubation on ice, lysates were centrifuged for 5 min at 15,000 g. Solubilized fractions were set aside while insoluble fractions were washed twice with PBS and resuspended in equal volume as soluble fractions (60 μL). SDS loading buffer was added to both soluble and insoluble fractions and 30-μl aliquots were separated in 7.5% SDS-PAGE gels. We did not boil the samples, since that consistently produced aggregates of hslo α subunits that would run as high molecular weight complexes. Proteins were transferred to Immun-blot PDVF membranes (Bio-Rad Laboratories), and hslo was detected by Western blotting with 10 μg/ml anti-FLAG monoclonal antibodies (Sigma-Aldrich). Anti–mouse IgG secondary antibodies conjugated to peroxidase (Sigma-Aldrich) were used at 1:10,000 dilution and the signal was developed with the ECL+ system (Amersham Pharmacia Biotech).
Electrophysiological Recordings
CHO cells were grown on 12-mm glass coverslips (Fisherbrand) in α-MEM (GIBCO BRL) with 10% FBS and transfected with plasmid DNA and Lipofectamine 2000 (GIBCO BRL). 18–24 h after transfection, fluorescent cells expressing hslo-YFP or hslo-CFP were assayed for hslo function. Recordings were done in the cell-attached or inside-out patch clamp configurations (Hamill et al., 1981) at 22–24°C. Patch pipettes were made of borosilicate glass (Kimax) and had resistances of 1–3 MΩ. Data were acquired using an EPC-9 amplifier and Pulse acquisition software (HEKA Electronik). Records were digitized at 50-μs intervals. Capacitance and leak currents were subtracted using a P/5 leak subtraction protocol. Conductance–voltage (G-V) curves were obtained by measuring the amplitude of tail currents 500 μs after repolarization to −70 mV from the various test voltages. Current levels were highly variable between patches; however, for all functional constructs, the maximal currents at 120 mV were consistently in the range of 500 pA to 5 nA, ∼60% the amplitude obtained with wild-type hslo channels. Currents obtained at all concentrations within a patch were normalized to the maximum peak current at 100 μM Ca2+ and G-V curves were fitted to a Boltzmann function using Igor Pro software (Wavemetrics Inc.). Values in the text are given as mean ± SEM.
Recording solutions contained (in mM): pipette, 80 KMeSO3, 60 N-methylglucamine-MeSO3, 20 HEPES, 2 KCl, 2 MgCl2 (pH 7.4); bath solution, 80 KMeSO3, 60 N-methylglucamine-MeSO3, 20 HEPES, 2 KCl, 1 HEDTA, and CaCl2 to give the appropriate free Ca2+ concentration (pH 7.4). No Ca2+ chelator was used in solutions containing 100 μM free Ca2+ or higher. To prevent Ba2+ block at high voltages (Diaz et al., 1996), 50 μM (+)-18-crown-6-tetracarboxylic acid (18C6TA) was added to all bath solutions. The amount of total CaCl2 needed to obtain the desired free Ca2+ concentration was calculated using the program Max Chelator (Bers et al., 1994), which was downloaded from www.stanford.edu/~patton/maxc.html. Free Ca2+ was measured with a Ca2+-sensitive electrode (Orion electrode, Thermo Labsystems). Solutions were exchanged using the DAD-VC superfusion system from ALA Scientific Instruments.
RESULTS AND DISCUSSION
Our aim was to generate a library of fluorescent functional hslo constructs as a tool for future use in spectroscopic studies of BK channel conformational rearrangements during gating. Obtaining a large number of constructs in a short period of time was possible by randomly inserting fluorescent protein domains into various sites in the hslo sequence. To this end, we used a newly developed technique based on a modified Tn5 transposon (Reznikoff et al., 1999) that carries the sequence of either the yellow fluorescent protein (YFP) or the cyan fluorescent protein (CFP; Sheridan et al., 2002). Transposons consist of any sequence delimited by the mosaic ends (MEs), which are two 19–base pair repeats. In an in vitro reaction, a recombinant Tn5 transposase binds these MEs and catalyzes the random insertion of the transposon into the plasmid carrying the hslo sequence. We created two different transposons, <TvPT-0> and <TcPT-1>. When these transposons are inserted into the sequence, in the correct orientation and reading frame, they produce a fluorescent fusion protein.
We transfected an initial set of 1,344 YFP and CFP insertion clones into HEK293 cells and screened for fluorescence (see MATERIALS AND METHODS). In our system a random transposition would be expected to result in an in-frame, correctly oriented insertion into the hslo coding region with a probability of 9%. Indeed, from the 1,344 random insertion clones, we obtained 101 constructs that produced fluorescent fusion protein (61 YFP and 40 CFP fluorescent insertions). Thus, consistent with earlier studies (Sheridan et al., 2002), it appears that nearly all fusion constructs yield correctly folded GFP domains. To verify that the sequence of the fluorescent proteins had been inserted into unique sites in the hslo sequence, the constructs were digested with restriction enzymes AscI (whose site flanks the YFP or CFP sequence in the transposons) and EcoRI (a unique site in the hslo sequence). The resulting gels revealed a common band (728 base pairs) in every lane, corresponding to the YFP or CFP insert, and two more bands of different sizes in concordance with the different sites of insertion of the transposons. A representative gel is shown in Fig. 1 A. Sequencing the 101 clones revealed 55 unique insertions (33 YFP and 22 CFP; Fig. 1 and Table I). These 55 clones were digested with SrfI and religated to remove the Kanr gene and stop codon (see MATERIALS AND METHODS), yielding the full-length constructs. All of the initial clones were still fluorescent as full-length constructs. All constructs showed similar high levels of expression in HEK293 cells, with a large proportion of perinuclear YFP or CFP fluorescence consistent with localization to the ER, probably due to overexpression of the proteins (Fig. 1 B).
Figure 1.
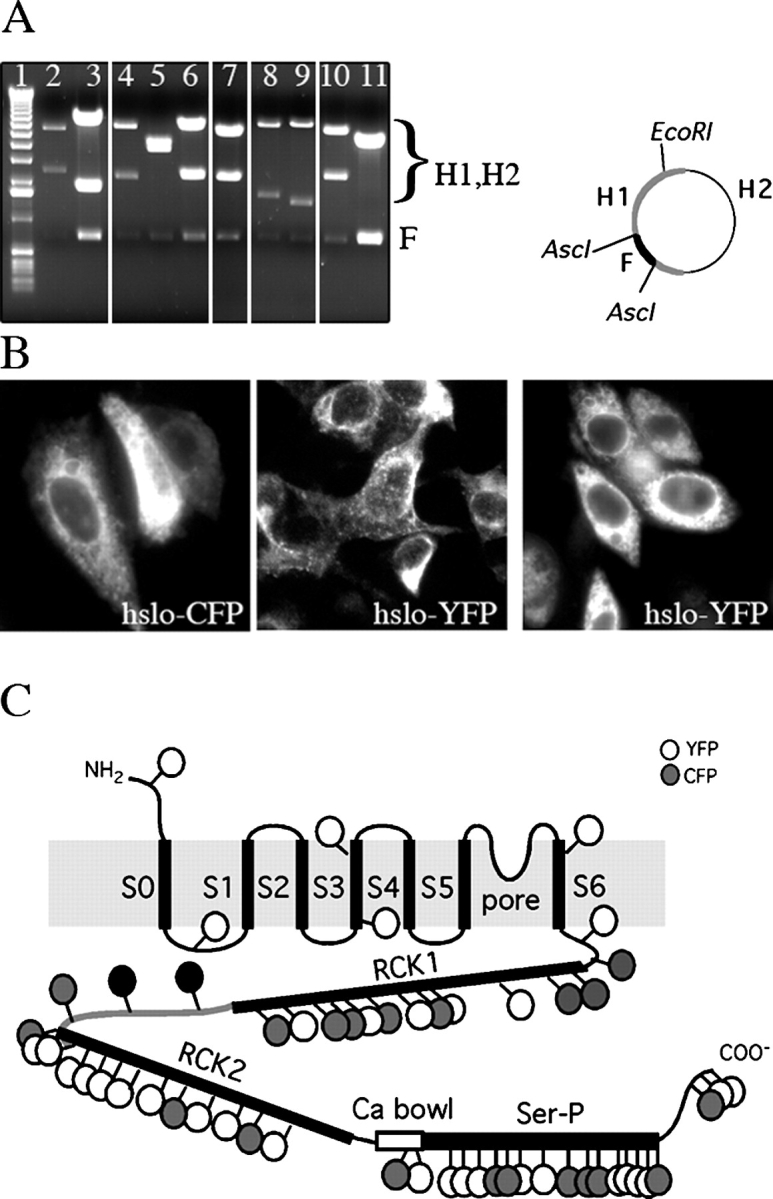
55 fluorescent fusion hslo proteins were obtained with unique insertion sites. (A) AscI/EcoRI digestion was used to test the various hslo-YFP/CFP fusion constructs. Lane 1, 1 kb ladder DNA marker; lanes 2–6, representative hslo-YFP fusion proteins; lanes 7–11, representative hslo-CFP fusions. Note the common band (F) of 728 base pairs in every lane corresponding to CFP or YFP. The other two bands (H1, H2) show different sizes for each construct, depending on the site in which the transposon has been inserted. (B) Cell expression of fluorescent hslo-CFP or -YFP fusion proteins. Left panel, construct 829 (CFP); middle and right panels, constructs 1062 and 471, respectively (YFP). HEK293 cells were transiently transfected with the fusion constructs and imaged for fluorescence after 24 h. (C) Successful insertions of YFP or CFP into the different regions of the hslo α subunit. White circles, YFP; gray circles, CFP. Approximate insertion sites are shown. Refer to Table I for the exact position in the hslo sequence where the insertion occurred.
TABLE I.
Membrane Expression and Function of Fluorescent hslo Fusion Proteins
| V1/2
b
|
|||||
|---|---|---|---|---|---|
| Insertion site (Construct #) | Fluorescent protein inserted | hslo domain | Membrane expressiona | 100 μM Ca2+ | 1 μM Ca2+ |
| mV | mV | ||||
| Wild-type hslo | – | – | Y | −3 ± 4 (8) | 113 ± 5 (6) |
| 13 | YFP | NH2 terminus | N | ||
| 65 | YFP | S0-S1 loop | L | ||
| 182 | YFP | S3 helix | N | ||
| 195 | YFP | S3 helix | N | ||
| 305 | YFP | S6 helix | N | ||
| 336 | YFP | end of S6 | N | ||
| 337 | CFP | end of S6 | L | ||
| 389 | CFP | RCK1 | N | ||
| 416 | CFP | RCK1 | N | ||
| 471 | YFP | RCK1 | N | ||
| 497 | YFP | RCK1 | N | ||
| 499 | CFP | RCK1 | N | ||
| 502 | YFP | RCK1 | N | ||
| 512 | CFP | RCK1 | L | ||
| 541 | YFP | RCK1 | N | ||
| 544 | CFP | RCK1 | N | ||
| 551 | CFP | RCK1 | N | ||
| 571 | YFP | RCK1 | N | ||
| 572 | CFP | RCK1 | N | ||
| 640 | CFP | linker | Y | 7 ± 5 (4) | 112 ± 2 (4) |
| 667 | CFP | linker | Y | 8 ± 3(12) | 113 ± 4 (7) |
| 678 | CFP | linker | Y | 15 ± 8 (4) | 119 ± 4 (4) |
| 712 | CFP | RCK2 | N | ||
| 720 | YFP | RCK2 | L | ||
| 731 | YFP | RCK2 | N | ||
| 772 | YFP | RCK2 | N | ||
| 780 | YFP | RCK2 | N | ||
| 790 | YFP | RCK2 | N | ||
| 802 | YFP | RCK2 | L | ||
| 821 | YFP | RCK2 | N | ||
| 829 | CFP | RCK2 | Y | 53 ± 7 (4)c | 131 ± 2 (4)c |
| 834 | YFP | RCK2 | N | ||
| 854 | YFP | RCK2 | Y | 20 ± 10 (4) | 118 ± 15 (3) |
| 860 | CFP | RCK2 | Y | 11 ±10 (3) | 118 ± 9 (4) |
| 866 | YFP | RCK2 | Y | −14 ± 5 (7) | 98 ± 5 (8) |
| 901 | CFP | Ca bowl | Y | 117 ± 5 (5)c | 201 ± 2 (3)c |
| 904 | YFP | Ca bowl | Y | 100 ± 4 (4)c | 203 ± 5 (3)c |
| 921 | YFP | Ser-P like | N | ||
| 939 | YFP | Ser-P like | L | ||
| 964 | YFP | Ser-P like | Y | 6 ± 4 (3) | 115 ± 5 (3) |
| 965 | CFP | Ser-P like | Y | 27 (1) | 120 (1) |
| 972 | CFP | Ser-P like | Y | 19 ± 6 (4) | 122 ± 5 (3) |
| 975 | YFP | Ser-P like | L | ||
| 991 | YFP | Ser-P like | Y | 9 (1) | – |
| 1002 | CFP | Ser-P like | N | ||
| 1019 | CFP | Ser-P like | Y | 15 ± 6 (2) | 118 ± 5 (2) |
| 1024 | CFP | Ser-P like | Y | 33 ± 7 (3) | 125 ± 12 (3) |
| 1040 | YFP | Ser-P like | N | ||
| 1042 | YFP | Ser-P like | N | ||
| 1049 | YFP | Ser-P like | N | ||
| 1062 | YFP | Ser-P like | Y | 8 ± 8 (8) | 123 ± 5 (8) |
| 1069 | CFP | Ser-P like | Y | 25 (1) | 105 (1) |
| 1082 | CFP | COOH terminus | Y | 16 ± 3 (3) | 115 ± 14 (3) |
| 1085 | YFP | COOH terminus | L | ||
| 1088 | YFP | COOH terminus | Y | −6 ± 3 (3) | 110 ± 4 (3) |
Determined with surface immunostaining. Y, very clear surface labeling; N, no surface labeling; L, very low surface labeling, probably not expressed at the plasma membrane.
Mean ± SEM (number of cells). Parameters obtained from Boltzmann fits  =1+e
=1+e
 −1 ατ ινδιψατεδ ∅Ψα2+]. Values of z were in the range 0.93 ± 0.05 to 1.1 ± 0.04 at 1 μM [Ca2+] and 0.92 ± 0.01 to 0.97 ± 0.02 at 100 μM [Ca2+]. Constructs 965, 991, and 1069 were not completely characterized at all Ca2+ concentrations, but data obtained from single cells suggest that there are no significant differences with the wild type.
Statistically significant changes (P < 0.01) when compared with wild type.
Inspection of Fig. 1 C and Table I shows that even though insertions were obtained over most of the coding sequence, a majority of them cover the COOH-terminal domain, with fewer insertions in the transmembrane domain. This apparent nonrandom distribution can be explained by two reasons. First, the Tn5 transposon behavior is not completely sequence independent (Goryshin et al., 1998). Second, and more importantly, if the insertion results on an aberrant protein that is improperly folded and consequently removed by cell degradation systems, it will not be recovered as a positive insertion in our screening process, which is based on cell expression of COOH-terminal fusions of the fluorescent protein. We speculate that many insertions in the transmembrane domain may result in fusion proteins that are degraded by the cell. Nevertheless, we recovered 55 insertions of the fluorescent proteins that cover all regions of interest (Fig. 1 C and Table I). Seven constructs were obtained with insertions between the NH2 terminus and the start of the RCK1 domain, including three in helices 3 and 6 and four in loops or regions at the end of the helices; 12 constructs had insertions in the RCK1 domain; three constructs hold insertions in the linker between RCK domains; 13 constructs in the RCK2 domain; two of them showed insertions in the Ca2+-bowl domain; finally, 15 of the constructs had insertions in the Ser-P–like domain, whereas the remaining three construct insertions were in the COOH terminus of the hslo sequence.
The complete sequence of a representative insertion is shown in Fig. 2. It should be kept in mind that the transposition process involves a duplication of the nine base pairs flanking the transposon insertion site (Fig. 2; see also Sheridan et al., 2002; Reznikoff, 2003). This generates a duplication of three amino acids of the hslo sequence in addition to the linker flanking the fluorescent protein (Sheridan et al., 2002). We identify the site of an insertion by the number of the residue preceding the duplicated triplet, using the native hslo numbering (GenBank/EMBL/DDBJ accession no. U11058).
Figure 2.

Insertion of the transposon involves a 9-bp duplication of the sequence flanking the insertion site. The insertion 904 in the Ca2+ bowl is shown as an example. (A) Position of the Ca2+ bowl in the general topology of the hslo channel. An arrow indicates the site of insertion of the YFP transposon, between amino acids 904 and 905. (B) Detailed cDNA sequence (top rows) and amino acid sequence (bottom rows) of the Ca2+ bowl region after in-frame insertion of the transposon. Different parts of the nucleotide sequence are color coded: red, Ca2+ bowl; black, mosaic ends (ME); gray, linker and AscI sites; green, YFP. Nine base pairs of the channel sequence flanking the insertion site are duplicated after transposon insertion. Therefore, three amino acids are duplicated, marked with blue boxes in the figure.
We next sought to determine which of the 55 unique constructs were able to form functional channels at the plasma membrane. All constructs showed high levels of fluorescence, but much of the protein was localized intracellularly (Fig. 1 B). Therefore, it was difficult to determine whether any of the hslo fluorescent protein was at the plasma membrane. Since screening of all 55 constructs by patch-clamp would have been time consuming, we developed an immunoassay to detected hslo protein surface expression. Because the NH2 terminus of the hslo channel is exoplasmic (Wallner et al., 1996), and our constructs had a FLAG epitope at the NH2 terminus, we were able to test plasma membrane expression of the 55 constructs of the library by surface immunostaining. For these experiments, and for functional analysis of hslo fusion proteins, we used CHO cells because they do not have endogenous potassium channels (Yu and Kerchner, 1998). Cells were transiently transfected with the fusion constructs, and protein expressed at the plasma membrane was immunolabeled with anti-FLAG primary antibody and a secondary antibody conjugated to a red fluorophore (Alexa 594). To ensure that the immunodetected channels were exclusively at the extracellular membrane, primary antibody was added before fixation of nonpermeabilized cells and all experiments were performed at 4°C to avoid membrane internalization processes. Secondary antibody was then added to the cells as described in MATERIALS AND METHODS. As shown in Fig. 3 A, nontransposed wild-type hslo channels showed strong surface expression. All 55 constructs of the library showed YFP or CFP fluorescence in the cell, but only 19 of them showed clear membrane expression. The approximate location of the 19 insertions that are expressed at the plasma membrane is shown in Fig. 3 B (for the exact location of insertions, refer to Table I). All insertions in the linker, and most of insertions in the second half of the RCK2 domain, calcium bowl, Ser-P domain, and COOH terminus showed strong plasma membrane expression. None of the insertions obtained in the NH2 terminus, transmembrane helices, RCK1 domain, or the first half of the RCK2 domain were expressed at the surface.
Figure 3.
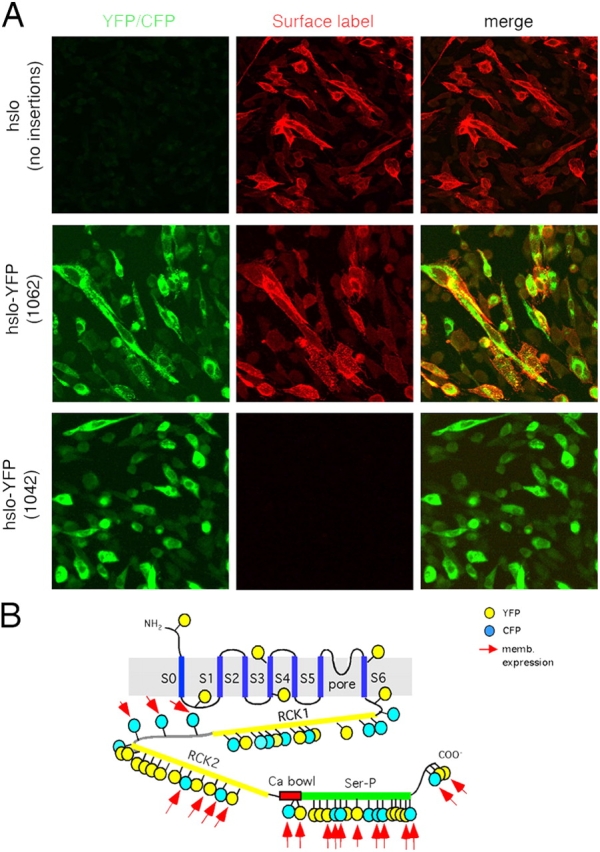
Expression of fluorescent hslo fusion proteins in the plasma membrane. (A) Confocal images of CHO cells expressing different hslo constructs. Transiently transfected hslo-YFP or CFP fusion proteins were inmunolabeled in live CHO cells before fixation. Left column, YFP fluorescence; middle column, surface immunofluorescence of hslo with Alexa 594–conjugated secondary antibody; far right, merged image. Top panels correspond to hslo channels before the transposition process. Middle and bottom panels show results obtained with two representative YFP-hslo constructs (1062-YFP in the COOH terminus and 471-YFP in the RCK1 domain). (B) 19 out of the 55 fluorescent hslo fusion proteins showed clear plasma membrane expression (red arrows). Yellow circles, YFP; blue circles, CFP. Approximate insertion sites are shown. Refer to Table I for the exact position in the hslo sequence where each insertion occurred.
The highest density of membrane-expressed insertions was found at the Ser-P domain. Nevertheless, 8 constructs out of 15 were retained intracellularly. A possible reason for this could be that some insertions are disrupting secondary structural elements (α helices or β strands) in the Ser-P domain. However, when the insertions are mapped onto the secondary structure, no obvious pattern emerges (unpublished data). A similar analysis was performed with insertions in the RCK domains, which also show an α/β protein structure, but again no obvious pattern is seen. These results are reminiscent of those of Sheridan et al. (2002), who transposed the G-protein subunit αs and surprisingly obtained the most functional fusion protein with the insertion of GFP into the middle of an α-helix. The hslo COOH-terminal region tolerated two insertions out of three. This is in concordance with results by other authors, who observed that deleting the last segment of hslo leads to functional channels very similar to wild type (Quirk and Reinhart, 2001).
We then tested the function of the 19 constructs expressed at the plasma membrane. Electrophysiological properties of the fluorescent hslo fusion proteins were investigated in transiently transfected CHO cells and compared with wild-type BK channels transfected into the same cell line. A low level of single channel activity was detected in cell-attached patches. When a patch was excised to a medium containing 100 μM Ca2+, macroscopic K+ currents were observed (Fig. 4, A and B). Typically, we observed high current levels in patches obtained from all 19 constructs. These currents were Ca2+- and voltage-dependent (Fig. 4, C and D). Insertion of the fluorescent proteins did not change significantly the conductance of the channel, which was ∼215 pS for the wild type and varied from 175 to 238 pS for the various fluorescent mutants, probably due to the intrinsic variability of single channels.
Figure 4.

Electrophysiologi-cal properties of hslo fluorescent fusion proteins. (A) Hslo currents were recorded with depolarizing pulses to +60 mV from a holding potential of −70 mV. Single channel recordings of wild-type hslo (top traces) and a representative hslo-YFP construct (1062-YFP; bottom) obtained in cell-attached patches at +60 mV. The arrows indicate the closed current level. (B) The same patches shown in A were excised to a medium containing 100 μM Ca2+. Currents are shown from 100-ms depolarizations from −70 mV to +60 mV. (C) Representative current families recorded from CHO inside-out patches in 100 μM Ca2+, from a holding potential of −70 mV. WT and 1062-YFP currents are shown at voltages between −70 and +120 mV in steps of 10 mV, whereas 901-CFP currents were obtained at +10 to +200 mV. (D) Normalized G-V curves are shown from wild-type hslo (WT, no insertions: black curve and symbols) and seven representative insertions. Each set of points was fitted to a Boltzmann function. Error bars represent SEM with n values as listed in Table I.
It is remarkable that despite the insertion of a large fluorescent domain in the channel protein, 16 out of 19 membrane-expressed fusion proteins showed G-V curves very similar to that of the wild-type hslo channel (Fig. 4 D and Table I). Variations on the order of 20 mV in the half-activation voltage values (V 1/2) between different patches were observed, consistent with findings by other authors (Horrigan and Aldrich, 2002), and possibly due to differences in the redox state of channels (DiChiara and Reinhart, 1997). The two insertions in the calcium bowl (901-CFP and 904-YFP) showed a strong shift in the G-V curve at 100 μM Ca2+, ∼100 mV in the depolarizing direction (Fig. 4 D and Table I). Interestingly, an insertion in the RCK2 domain, 829-CFP, also showed a shift in the G-V curve of ∼50 mV to more positive voltages.
To characterize the Ca2+ sensitivity of the various constructs, we studied the G-V relationships at Ca2+ concentrations between 1 μM and 100 μM. As shown in Table I and Fig. 5, V 1/2 values at the different Ca2+ concentrations for 16 of the 19 constructs were not significantly different from the wild-type hslo channel (Fig. 5 A), indicating that the insertion of the fluorescent proteins did not affect the ability of Ca2+ to regulate the channel. Nevertheless, one insertion in the Ca2+ bowl (construct 901-CFP) reduced the ability of Ca2+ to shift the G-V curve to more negative voltages. In both this construct and 904-YFP the mutants' curves were ∼100 mV right-shifted when compared with the corresponding wild-type curves between 1 and 100 μM Ca2+ (Table II; Fig. 4 D; Fig. 5, C, D, and F). These results are reminiscent of findings by Schreiber and Salkoff (1997) and Bao et al. (2002), who observed large effects on G-V curves from deletions or point mutations in the Ca-bowl region. Our results, obtained after a random mutagenesis of the hslo channel, give additional unbiased support to the conclusion that the Ca2+ bowl is a sensitive region for regulatory effects on the channel.
Figure 5.
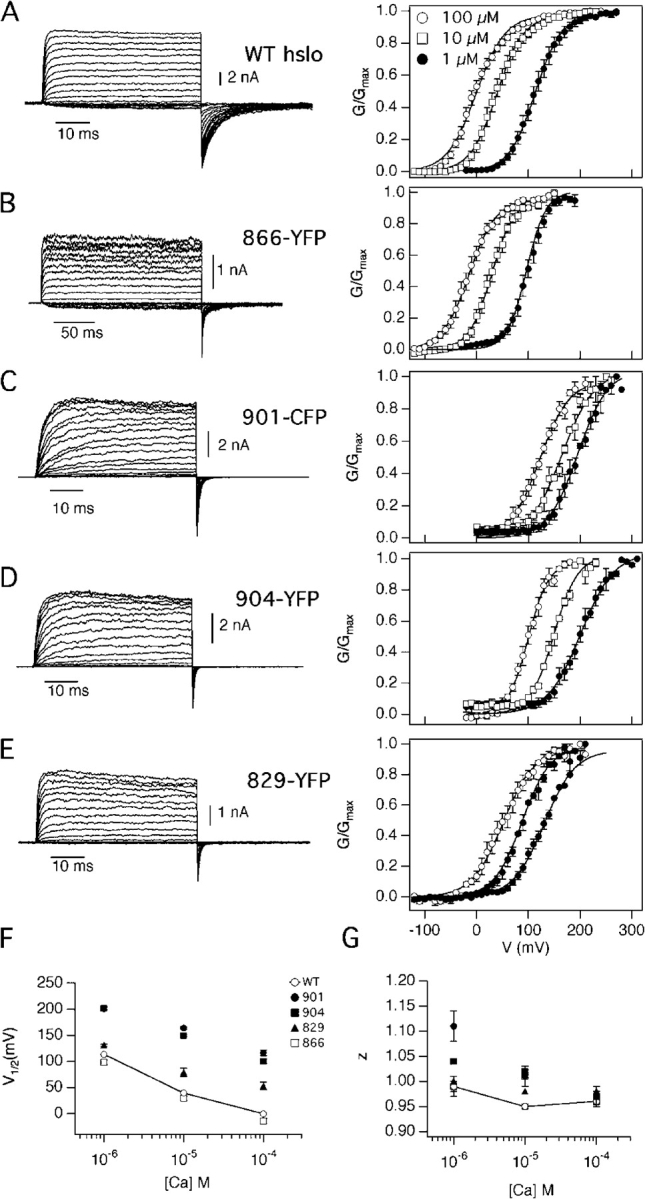
TABLE II.
| [Ca2+] | Construct | V 1/2 | z | n |
|---|---|---|---|---|
| mV | ||||
| 1 μM | Wild type | 113 ± 5 | 0.99 ± 0.01 | 6 |
| 866-YFP | 98 ± 8 | 0.98 ± 0.03 | 8 | |
| 901-CFP | 201 ± 3 | 1.11 ± 0.04 | 3 | |
| 904-YFP | 203 ± 5 | 1.05 ± 0.03 | 3 | |
| 829-YFP | 131 ± 2 | 1 ± 0.02 | 3 | |
| 10 μM | Wild type | 38 ± 5 | 0.95 ± 0.01 | 6 |
| 866-YFP | 28 ± 8 | 0.94 ± 0.02 | 10 | |
| 901-CFP | 164 ± 3 | 1.01 ± 0.005 | 3 | |
| 904-YFP | 149 ± 2 | 1.02 ± 0.003 | 3 | |
| 829-YFP | 79 ± 8 | 0.98 ± 0.01 | 3 | |
| 100 μM | Wild type | −3 ± 4 | 0.96 ± 0.005 | 8 |
| 866-YFP | −14 ± 8 | 0.95 ± 0.01 | 7 | |
| 901-CFP | 117 ± 6 | 0.97 ± 0.01 | 5 | |
| 904-YFP | 100 ± 5 | 0.97 ± 0.02 | 4 | |
| 829-YFP | 53 ± 7 | 0.98 ± 0.01 | 4 |
 =1+e
=1+e
 −1 ατ τηε ινδιψατεδ ∅Ψα2+].
When studied over the 1–100 μM Ca2+ range, the 829-CFP construct also showed a significant shift of the G-V curve (Table II; Fig. 4 D; Fig. 5, E and F). The S829 residue is situated in the COOH terminus of the RCK2 domain, 54 residues away from the Ca2+ bowl. Interestingly, the other three insertions obtained in the RCK2 region (854-YFP, 860-CFP, and 866-YFP) showed no significant differences in the G-V curves with the wild type, although they are closer in the amino acid sequence to the Ca2+ bowl region.
Finally, we speculated that the reasons why many of the insertions were not expressed at the membrane could be one or a combination of the following: a total misfolding and aggregation of hslo subunits; a defect in protein tetramerization; or defects in channel trafficking. We used a biochemical approach to address the first possibility. The fusion proteins were expressed in CHO cells and tested for solubility in buffers containing different concentrations of the nonionic detergent Triton X-100. Insolubility in this detergent is an indicator of protein misfolding and aggregation (Manganas et al., 2001; Zarei et al., 2004). We performed these experiments with five representative constructs that are expressed at the plasma membrane (insertions 667 in the linker, 854 and 866 in the RCK2 domain, 901 in the Ca2+ bowl, and 1062 in the Ser-P domain) and another four representative intracellularly retained insertions (insertions 13 at the NH2 terminus, 336 at the end of S6, 471 in the RCK1 domain, and 780 in the RCK2). Every construct tested has a solubilization profile indistinguishable from the wild-type hslo protein (representative examples are shown in Fig. 6). A substantial part of the protein was solubilized with 0.1% of Triton X-100 and solubilization was complete with 1% of Triton X-100. This rules out the possibility that some mutant proteins are grossly misfolded and aggregated.
Figure 6.
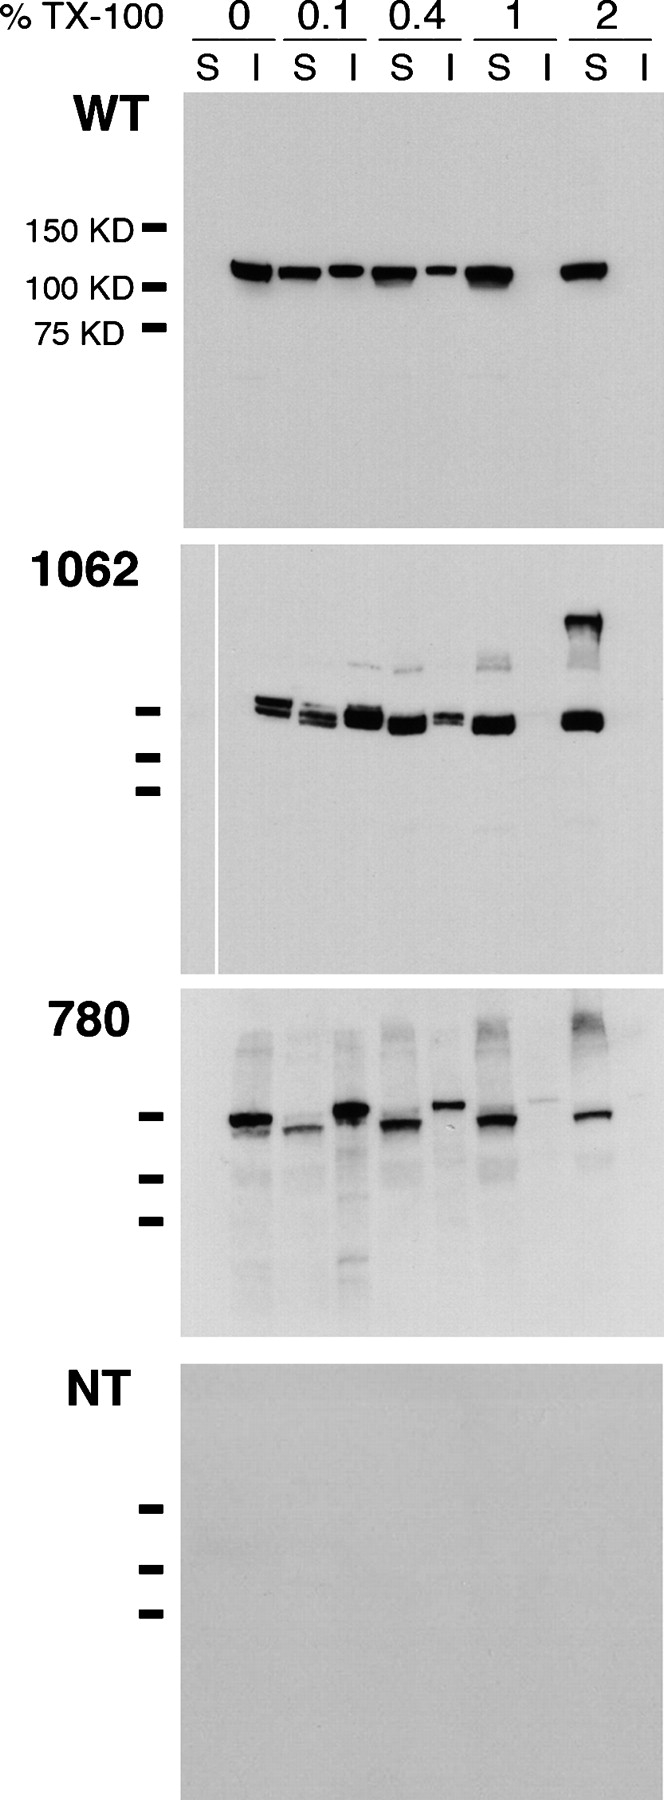
Hslo fluorescent fusion proteins do not form insoluble aggregates in CHO cells. Western blot of CHO cells transfected with wild-type hslo (WT, top panel), a construct expressed at the plasma membrane, 1062-YFP (1062; second panel), a construct that is retained intracellularly, 780-YFP (780; third panel), or nontransfected cells (NT; bottom panel). Cells were permeabilized in lysis buffer containing 0%, 0.1%, 0.4%, 1%, and 2% Triton X-100 detergent. S, soluble fractions; I, insoluble fractions. For each construct, essentially all of the hslo protein is solubilized by 1% detergent. Doublet bands were sometimes seen from the fusion proteins. These were unaffected by removal of N-linked glycosylation after PNGase F pretreatment, but became single bands when higher SDS concentrations were used. Presumably they arose from incomplete unfolding of GFP domains in SDS. Hslo bands were immunodetected with anti-FLAG monoclonal antibodies. Bars to the left of the panels indicate migration of molecular mass markers (75, 100, and 150 kD).
The results presented in Fig. 6 suggest that the insertion of the GFP domain in certain regions of the channel could interfere more subtly with hslo folding, causing defects that impair protein tetramerization or interfere with trafficking of the channel. Quirk and Reinhart (2001) have demonstrated the existence of several regions required for functional channel tetramerization and expression. The most important comprises the first half of the RCK1 domain, and six of our constructs present insertions in that area; none of them result in surface-expressed protein (Table I). These authors also showed that more distal domains (amino acids 500–528) could contribute to tetramerization of the channel. Two of the fluorescent fusion hslo proteins of our library contain insertions in this region and are also unable to go to the membrane (Table I).
Random insertions of GFP domains have previously been performed in three other systems, where the frequency of obtaining functional fusion proteins has been in the range of 10–20%. Biondi et al. (1998) used a strategy involving random nicks to introduce the GFP sequence into the Dictyostelium protein kinase A regulatory subunit gene. Of the 14 full-length fusion proteins that were characterized, three showed cAMP-dependent regulatory activity. Sheridan et al. (2002) used transposons to create GFP fusions with the G-protein αs subunit and with the glutamate receptor subunit GluR1. From 12 Gαs constructs they found one with clear functional activity; out of 29 GluR1 fusion constructs they reported glutamate-activated currents in six. In view of these results, our 35% success rate (19 high-expressing ion channels out of a total of 55 hslo fusion constructs) is quite high, and illustrates a remarkable ability of the BK channel to tolerate insertions in its tail domain. The battery of functional constructs obtained here promise to be useful in future spectroscopic studies of channel conformational changes.
Acknowledgments
We thank Drs. Guy Moss and Andrew Tinker for providing us with the hslo-TAG construct, and Edward Moczydlowski for advice and sharing of sequence alignments. We also thank Aruna Raghuraman for technical assistance with the Western blot experiments and Dr. Douglas Sheridan for many helpful discussions about transposition.
This work was supported by National Institutes of Health grants P01-NS42202 and R01-NS21501. T. Giraldez holds a postdoctoral fellowship from the American Heart Association.
Olaf S. Andersen served as editor.
Abbreviations used in this paper: CFP, cyan fluorescent protein; FRET, fluorescence resonance energy transfer; YFP, yellow fluorescent protein.
References
- Bao, L., A.M. Rapin, E.C. Holmstrand, and D.H. Cox. 2002. Elimination of the BK(Ca) channel's high-affinity Ca2+ sensitivity. J. Gen. Physiol. 120:173–189. [DOI] [PMC free article] [PubMed] [Google Scholar]
- Bers, D.M., C.W. Patton, and R. Nuccitelli. 1994. A practical guide to the preparation of Ca2+ buffers. Methods Cell Biol. 40:3–29. [DOI] [PubMed] [Google Scholar]
- Biondi, R.M., P.J. Baehler, C.D. Reymond, and M. Veron. 1998. Random insertion of GFP into the cAMP-dependent protein kinase regulatory subunit from Dictyostelium discoideum. Nucleic Acids Res. 26:4946–4952. [DOI] [PMC free article] [PubMed] [Google Scholar]
- Butler, A., S. Tsunoda, D.P. McCobb, A. Wei, and L. Salkoff. 1993. mSlo, a complex mouse gene encoding “maxi” calcium-activated potassium channels. Science. 261:221–224. [DOI] [PubMed] [Google Scholar]
- Crest, M., and M. Gola. 1993. Large conductance Ca2+-activated K+ channels are involved in both spike shaping and firing regulation in Helix neurones. J. Physiol. 465:265–287. [DOI] [PMC free article] [PubMed] [Google Scholar]
- Diaz, F., M. Wallner, E. Stefani, L. Toro, and R. Latorre. 1996. Interaction of internal Ba2+ with a cloned Ca2+-dependent K+ (hslo) channel from smooth muscle. J. Gen. Physiol. 107:399–407. [DOI] [PMC free article] [PubMed] [Google Scholar]
- DiChiara, T.J., and P.H. Reinhart. 1997. Redox modulation of hslo Ca2+-activated K+ channels. J. Neurosci. 17:4942–4955. [DOI] [PMC free article] [PubMed] [Google Scholar]
- Favre, I., and E. Moczydlowski. 1999. Simultaneous binding of basic peptides at intracellular sites on a large conductance Ca2+-activated K+ channel. Equilibrium and kinetic basis of negatively coupled ligand interactions. J. Gen. Physiol. 113:295–320. [DOI] [PMC free article] [PubMed] [Google Scholar]
- Favre, I., G.W. Moss, D.P. Goldenberg, J. Otlewski, and E. Moczydlowski. 2000. Structure-activity relationships for the interaction of bovine pancreatic trypsin inhibitor with an intracellular site on a large conductance Ca2+-activated K+ channel. Biochemistry. 39:2001–2012. [DOI] [PubMed] [Google Scholar]
- Goryshin, I.Y., J.A. Miller, Y.V. Kil, V.A. Lanzov, and W.S. Reznikoff. 1998. Tn5/IS50 target recognition. Proc. Natl. Acad. Sci. USA. 95:10716–10721. [DOI] [PMC free article] [PubMed] [Google Scholar]
- Hamill, O.P., A. Marty, E. Neher, B. Sakmann, and F.J. Sigworth. 1981. Improved patch-clamp techniques for high-resolution current recording from cells and cell-free membrane patches. Pflugers Arch. 391:85–100. [DOI] [PubMed] [Google Scholar]
- Horrigan, F.T., and R.W. Aldrich. 2002. Coupling between voltage sensor activation, Ca2+ binding and channel opening in large conductance (BK) potassium channels. J. Gen. Physiol. 120:267–305. [DOI] [PMC free article] [PubMed] [Google Scholar]
- Hu, H., L.R. Shao, S. Chavoshy, N. Gu, M. Trieb, R. Behrens, P. Laake, O. Pongs, H.G. Knaus, O.P. Ottersen, and J.F. Storm. 2001. Presynaptic Ca2+-activated K+ channels in glutamatergic hippocampal terminals and their role in spike repolarization and regulation of transmitter release. J. Neurosci. 21:9585–9597. [DOI] [PMC free article] [PubMed] [Google Scholar]
- Jiang, Y., A. Lee, J. Chen, M. Cadene, B.T. Chait, and R. MacKinnon. 2002. Crystal structure and mechanism of a calcium-gated potassium channel. Nature. 417:515–522. [DOI] [PubMed] [Google Scholar]
- Jiang, Y., A. Pico, M. Cadene, B.T. Chait, and R. MacKinnon. 2001. Structure of the RCK domain from the E. coli K+ channel and demonstration of its presence in the human BK channel. Neuron. 29:593–601. [DOI] [PubMed] [Google Scholar]
- Manganas, L.N., Q. Wang, R.H. Scannevin, D.E. Antonucci, K.J. Rhodes, and J.S. Trimmer. 2001. Identification of a trafficking determinant localized to the Kv1 potassium channel pore. Proc. Natl. Acad. Sci. USA. 98:14055–14059. [DOI] [PMC free article] [PubMed] [Google Scholar]
- Meera, P., M. Wallner, M. Song, and L. Toro. 1997. Large conductance voltage- and calcium-dependent K+ channel, a distinct member of voltage-dependent ion channels with seven N-terminal transmembrane segments (S0-S6), an extracellular N terminus, and an intracellular (S9-S10) C terminus. Proc. Natl. Acad. Sci. USA. 94:14066–14071. [DOI] [PMC free article] [PubMed] [Google Scholar]
- Moss, G.W., J. Marshall, and E. Moczydlowski. 1996. Hypothesis for a serine proteinase-like domain at the COOH terminus of Slowpoke calcium-activated potassium channels. J. Gen. Physiol. 108:473–484. [DOI] [PMC free article] [PubMed] [Google Scholar]
- Nagai, T., K. Ibata, E.S. Park, M. Kubota, K. Mikoshiba, and A. Miyawaki. 2002. A variant of yellow fluorescent protein with fast and efficient maturation for cell-biological applications. Nat. Biotechnol. 20:87–90. [DOI] [PubMed] [Google Scholar]
- Quirk, J.C., and P.H. Reinhart. 2001. Identification of a novel tetramerization domain in large conductance K(ca) channels. Neuron. 32:13–23. [DOI] [PubMed] [Google Scholar]
- Reznikoff, W.S. 2003. Tn5 as a model for understanding DNA transposition. Mol. Microbiol. 47:1199–1206. [DOI] [PubMed] [Google Scholar]
- Reznikoff, W.S., A. Bhasin, D.R. Davies, I.Y. Goryshin, L.A. Mahnke, T. Naumann, I. Rayment, M. Steiniger-White, and S.S. Twining. 1999. Tn5: a molecular window on transposition. Biochem. Biophys. Res. Commun. 266:729–734. [DOI] [PubMed] [Google Scholar]
- Roosild, T.P., K.T. Le, and S. Choe. 2004. Cytoplasmic gatekeepers of K+-channel flux: a structural perspective. Trends Biochem. Sci. 29:39–45. [DOI] [PubMed] [Google Scholar]
- Rosenblatt, K.P., Z.P. Sun, S. Heller, and A.J. Hudspeth. 1997. Distribution of Ca2+-activated K+ channel isoforms along the tonotopic gradient of the chicken's cochlea. Neuron. 19:1061–1075. [DOI] [PubMed] [Google Scholar]
- Schreiber, M., and L. Salkoff. 1997. A novel calcium-sensing domain in the BK channel. Biophys. J. 73:1355–1363. [DOI] [PMC free article] [PubMed] [Google Scholar]
- Schreiber, M., A. Yuan, and L. Salkoff. 1999. Transplantable sites confer calcium sensitivity to BK channels. Nat. Neurosci. 2:416–421. [DOI] [PubMed] [Google Scholar]
- Sheridan, D.L., C.H. Berlot, A. Robert, F.M. Inglis, K.B. Jakobsdottir, J.R. Howe, and T.E. Hughes. 2002. A new way to rapidly create functional, fluorescent fusion proteins: random insertion of GFP with an in vitro transposition reaction. BMC Neurosci. 3:7. [DOI] [PMC free article] [PubMed] [Google Scholar]
- Shi, J., and J. Cui. 2001. Intracellular Mg2+ enhances the function of BK-type Ca2+-activated K+ channels. J. Gen. Physiol. 118:589–606. [DOI] [PMC free article] [PubMed] [Google Scholar]
- Toro, L., M. Wallner, P. Meera, and Y. Tanaka. 1998. Maxi-K(Ca), a unique member of the voltage-gated K channel superfamily. News Physiol. Sci. 13:112–117. [DOI] [PubMed] [Google Scholar]
- Wallner, M., P. Meera, M. Ottolia, G.J. Kaczorowski, R. Latorre, M.L. Garcia, E. Stefani, and L. Toro. 1995. Characterization of and modulation by a β-subunit of a human maxi KCa channel cloned from myometrium. Receptors Channels. 3:185–199. [PubMed] [Google Scholar]
- Wallner, M., P. Meera, and L. Toro. 1996. Determinant for β-subunit regulation in high-conductance voltage-activated and Ca2+-sensitive K+ channels: an additional transmembrane region at the N terminus. Proc. Natl. Acad. Sci. USA. 93:14922–14927. [DOI] [PMC free article] [PubMed] [Google Scholar]
- Wei, A., C. Solaro, C. Lingle, and L. Salkoff. 1994. Calcium sensitivity of BK-type KCa channels determined by a separable domain. Neuron. 13:671–681. [DOI] [PubMed] [Google Scholar]
- Xia, X.M., X. Zeng, and C.J. Lingle. 2002. Multiple regulatory sites in large-conductance calcium-activated potassium channels. Nature. 418:880–884. [DOI] [PubMed] [Google Scholar]
- Yu, S.P., and G.A. Kerchner. 1998. Endogenous voltage-gated potassium channels in human embryonic kidney (HEK293) cells. J. Neurosci. Res. 52:612–617. [DOI] [PubMed] [Google Scholar]
- Zarei, M.M., M. Eghbali, A. Alioua, M. Song, H.G. Knaus, E. Stefani, and L. Toro. 2004. An endoplasmic reticulum trafficking signal prevents surface expression of a voltage- and Ca2+-activated K+ channel splice variant. Proc. Natl. Acad. Sci. USA. 101:10072–10077. [DOI] [PMC free article] [PubMed] [Google Scholar]
- Zhang, X., C.R. Solaro, and C.J. Lingle. 2001. Allosteric regulation of BK channel gating by Ca2+ and Mg2+ through a nonselective, low affinity divalent cation site. J. Gen. Physiol. 118:607–636. [DOI] [PMC free article] [PubMed] [Google Scholar]
- Zheng, J., and W.N. Zagotta. 2003. Patch-clamp fluorometry recording of conformational rearrangements of ion channels. Sci. STKE. 2003:PL7. [DOI] [PubMed]