

Abstract
The functioning of nitric oxide (NO) as a biological messenger necessitates that there be an inactivation mechanism. Cell suspensions from a rat brain region rich in the NO signalling pathway (cerebellum) were used to investigate the existence of such a mechanism and to determine its properties.
The cells consumed NO in a manner that could not be explained by reaction with O2, superoxide ions or contaminating red blood cells. Functionally, the mechanism was able to convert constant rates of NO formation into low steady-state NO concentrations. For example, with NO produced at 90 nm min−1, the cells (20 × 106 ml−1) held NO at 20 nm. Various other cell types behaved similarly.
The influence of NO inactivation on the ability of NO to access its receptor, soluble guanylyl cyclase, was explored by measuring cGMP accumulation in response to the clamped NO concentrations. The extrapolated steady-state EC50 for NO was 2 nm, a concentration readily achieved by low NO release rates, despite inactivation.
When confronted by higher NO release rates for several minutes, the clamping mechanism failed, resulting in a progressive rise in NO concentration. While the clamp was maintained, cellular respiration was unaffected but, as it failed, respiration became inhibited by NO. The IC50 was measured to be 120 nm (at 100–140 μm O2).
It is concluded that cerebellar (and other) cells possess a powerful NO inactivation mechanism that, extrapolated to the whole tissue, would impose on NO a half-life of around 100 ms. This and other properties of the device appear ideal for shaping low-level NO signals for activating its receptor, soluble guanylyl cyclase, whilst avoiding adverse effects on mitochondrial function. The exhaustibility of the mechanism provides a scenario for NO to become toxic.
To function as such, biological signalling molecules need to be inactivated. In the case of nitric oxide (NO), which serves as an intercellular messenger throughout the body (Moncada et al. 1991), much has been learnt during the last decade about the synthetic pathway, but how the molecule is disposed of under physiological conditions remains unknown.
NO is generated in cells from l-arginine and O2 by NO synthases. Two isoforms, neuronal and endothelial (nNOS and eNOS) are constitutively expressed and typically become activated transiently as a result of a rise in cytosolic Ca2+. A third type, the inducible NO synthase (iNOS), can be expressed in many different cell types after exposure to inflammatory or proinflammatory mediators and this isoform manufactures NO continuously (Stuehr, 1999). Once produced, NO diffuses rapidly in three dimensions to elicit biological actions in neighbouring cells. Physiological NO signal transduction occurs through binding to the haem group of soluble guanylyl cyclase (sGC), leading to enzyme activation and cGMP accumulation (Waldman & Murad, 1987; Ignarro, 1991). However, NO can also contribute to tissue pathology by inhibiting mitochondrial respiration and promoting the generation of reactive free radicals (Gross & Wolin, 1995; Clementi et al. 1998; Brown, 1999; Heales et al. 1999). The rate of inactivation of NO will govern, inter alia, how far NO spreads within a tissue and at what concentrations (Wood & Garthwaite, 1994), and so is expected to be a critical determinant of whether NO acts as a physiological signal or as a toxin.
The chemical reactivity of NO has been considered to be one means of disposal. NO can react with O2 (a process termed autoxidation) but this is far too slow at the concentrations existing in vivo to be of relevance (Ford et al. 1993; Kharitonov et al. 1994). A much more rapid reaction is with superoxide ions, but the resulting peroxynitrite anion is highly toxic, making it unlikely that this would serve as the primary physiological pathway (Beckman & Koppenol, 1996). Various biological mechanisms have also been proposed. Foremost among these is the reaction with haemoglobin (Hb) in circulating red blood cells, which yields nitrosylhaemoglobin and/or methaemoglobin plus nitrate ions (Beckman & Koppenol, 1996). The extent to which this reaction contributes to NO inactivation under physiological conditions remains uncertain, however, even in the case of NO produced by eNOS in blood vessels (Liao et al. 1999).
We report here that mammalian cells themselves contain a powerful NO inactivating mechanism(s), or sink, that has properties that are well suited for shaping the kinetics and tissue concentrations of NO for targeting its receptor, sGC. The sink, however, is exhaustible so that during prolonged release NO rises to levels that exert pathological effects.
METHODS
Most experiments used cerebellar cell suspensions from 8-day-old Wistar rats. The animals were killed by decapitation and associated exsanguination as approved by the UK Home Office and the local ethics committee. Cell suspensions were prepared according to published procedures (Garthwaite & Garthwaite, 1987) except that the pups were not pretreated with hydroxyurea. The incubation medium contained (mm): NaCl, 130; KCl, 3; CaCl2, 1.5; MgSO4, 1.2; Na2HPO4, 1.2; Tris-HCl, 15; and glucose, 11; adjusted to pH 7.4 at 37 °C. Unless otherwise stated, the medium also contained superoxide dismutase (SOD, 100–1000 U ml−1). Protein concentrations were measured by the bicinchoninic acid method and cGMP by radioimmunoassay. Red blood cells were prepared from whole blood as described previously (Liu et al. 1998) and resuspended in the same medium used for the cerebellar cells. To quantify the contamination of cerebellar cell suspensions by red blood cells, aliquots were fixed (4 % paraformaldehyde in 0.1 m phosphate buffer, pH 7.4, at room temperature for 30 min), dried onto gelatin-coated slides and stained with haemalum for 15 s. Darkly stained nucleated cells were then clearly distinguishable from the unstained red blood cells. In each experiment, counts were made from six randomly chosen fields each containing about 300 cells. Murine macrophages (RAW 264.7 and J774.1 cells), baby hamster kidney (BHK) cells and HeLa cells were purchased from the American Type Culture Collection (Manassas, VA, USA). These cell lines were harvested by trypsinisation and incubated as cell suspensions at 0.7–0.9 mg ml−1 protein in the same medium used for cerebellar cells.
For NO and O2 measurements, samples (1 ml) of cell suspension were incubated in a sealed, stirred vessel (at 37 °C) equipped with an O2 electrode (Rank Brothers, UK) and an NO electrode (Iso-NO, World Precision Instruments, UK). Three different NONOate donors differing in their decomposition rates were used to supply NO: diethylamine/NO adduct (DEA/NO), proline/NO adduct (PROLI/NO) and diethylenetriamine/NO adduct (DETA/NO) (all from Calbiochem, UK). Stock solutions were made in 10 mm NaOH and kept on ice until use. To describe the decay of NO quantitatively, in buffer or following addition of PROLI/NO, the rate of decline over the concentration range 0.2–0.4 μm was analysed by plotting the natural logarithm of the concentration against time. This was linear and the gradient gave the rate constant. The response time of the NO electrode was determined by the addition of excess oxyhaemoglobin (100 μm) to a solution of 100 μm DETA/NO in incubation buffer that had been left to accumulate NO to a steady-state concentration of about 0.4 μm. The quantity of NO released by 1 μm PROLI/NO (1.6 ± 0.5 μm; n = 3) was determined by allowing the donor to decompose in incubation buffer (30 min at 37 °C) and measuring the resulting concentrations of nitrite and nitrate ions by chemiluminescence (Salter et al. 1996). The autoxidation rate constant for NO was calculated (Schmidt et al. 1997) by measuring the rate of NO decay at 1 μm NO following the addition of 2 μm PROLI/NO to the cell incubation buffer.
Data are given as means ±s.e.m.
RESULTS
NO breakdown by cerebellar cells
The central nervous system, and the cerebellum in particular, is enriched in nNOS activity and so any specialised NO inactivation mechanism is likely to be found there. Most experiments were therefore carried out on cell suspensions of the developing rat cerebellum, in which the NO-cGMP pathway is active and coupled to NMDA receptor activity (Garthwaite et al. 1988). NO concentrations were monitored using an electrochemical probe. Initially DEA/NO (1 μm), which releases NO with a half-life of 2.1 min (at 37 °C), was tested. In incubation buffer (containing 100 U ml−1 SOD), the NO concentration rose to a peak after about 3 min and then slowly fell, consistent with the known rates of NO release and autoxidation (Schmidt et al. 1997). In the presence of cerebellar cells (20 × 106 ml−1), however, the peak occurred earlier (about 1 min), was smaller, and was followed by rapid NO depletion such that the baseline was regained in less than 5 min (Fig. 1A).
Figure 1. Inactivation of NO by cerebellar cells.
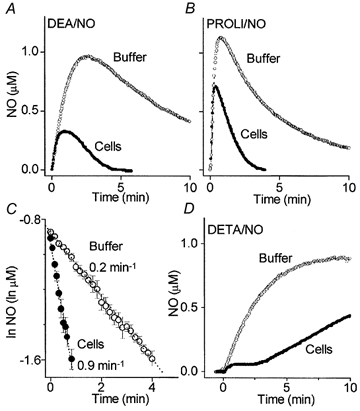
Profiles of NO concentration over time following addition of 1 μm DEA/NO (A), 1 μm PROLI/NO (B) or 250 μm DETA/NO (D) to buffer and cerebellar cell suspensions (Cells), as indicated. In C, the data from B at 0.2–0.4 μm NO have been plotted semi-logarithmically to obtain the rate constants.
The experiments were repeated using PROLI/NO, which has a much shorter half-life (1.8 s). In buffer alone, the measured peak NO concentration (about 1 μm) was followed by a gradual decline to about 20 % of the peak value after 10 min. With cerebellar cells included, the decay of NO following the peak was greatly hastened (Fig. 1B), confirming the finding with DEA/NO. Because of the rapid decay of PROLI/NO, the measured NO concentration profile after about 10 s has elapsed is determined solely by the rate of disappearance of NO and the electrode response time. The latter was quite slow, the time constant being 8.6 ± 0.7 s (n = 3), so that rapid changes in concentration were not reported accurately. As found before (Sharpe & Cooper, 1998) the decay of NO at submicromolar concentrations (0.2–0.4 μm) in buffer fitted first-order kinetics (Fig. 1C), the rate constant being 0.19 ± 0.03 min−1 (n = 6). In the cerebellar cell suspension, the corresponding rate constant was about 4-fold larger, at 0.93 ± 0.07 min−1 (n = 6). Omission of SOD speeded the decay (1.68 ± 0.36 min−1; n = 4) whereas doubling the concentration to 200 U ml−1 had no additional effect (not shown).
The possibility that NO was being consumed by reaction with intracellular superoxide ions was examined by lysing the cells by sonication. The rate of NO inactivation in the lysed cells (originally 20 × 106 ml−1) in the presence of up to 1000 U ml−1 of SOD was 98 ± 12 % (n = 3) of that observed in intact cells.
NO inactivation produces an NO concentration clamp
A third NONOate (DETA/NO) with a very long half-life (20 h) was used to determine how the cells handle a constant source of NO. The strength of the source was selected on the basis of the maximum NO synthase activity in rat brain, which ranges between 5 and 50 nmol g−1 min−1 in different areas (Salter et al. 1995). Diluted to 1 mg ml−1 protein (corresponding approximately to the usual cell suspension), this range equates roughly to 0.05–0.5 μm min−1. Therefore, we first tested 250 μm DETA/NO whose initial rate of NO release was measured (in virtually O2-free buffer) to be 0.23 ± 0.02 μm min−1 (n = 3), giving a stoichiometry of 1.6 moles of NO per mole of DETA/NO.
In buffer, the NO concentration rose slowly to reach a plateau at 0.8 μm after about 7 min (Fig. 1D). At this point the rate of NO production is balanced by autoxidation. When cerebellar cells were present at 20 × 106 ml−1, a different profile was seen. The NO concentration rose initially but, within a minute, was held (‘clamped’) at the much lower concentration of 55 ± 2 nm (n = 3). The concentration was maintained for about 3 min but then rose again, albeit at a slower rate (0.06 μm min−1) than in buffer (0.2 μm min−1).
A potential contributor to the consumption of NO in the cell suspension is the presence of contaminating red blood cells. Direct counting indicated that these comprised 0.85 ± 0.21 % (n = 4) of the total cell number. According to previous measurements (Liu et al. 1998), this level of contamination could not account for the observations. In agreement, the equivalent concentration of red blood cells (0.17 × 10⁶ ml−1) behaved more like buffer than the cerebellar cell suspension in response to DETA/NO, except for a transient shoulder appearing at about 0.2 μm NO (Fig. 2A). This is as predicted from the earlier work (Liu et al. 1998). Furthermore, a variety of cell lines, uncontaminated by red blood cells, also inactivated NO, as indicated by their ability to generate clamped NO concentrations in response to DETA/NO (Fig. 2B). The amplitudes of the plateaux varied with cell type from about 50 nm (HeLa cells) to 300 nm (BHK cells).
Figure 2. NO inactivation by red blood cells and various cell lines.
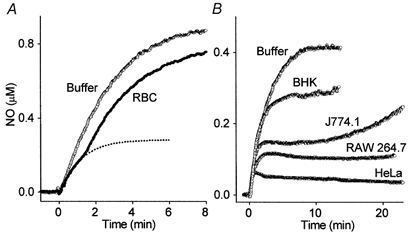
A, NO concentration profile obtained following addition of 250 μm DETA/NO (at t = 0) to buffer in the absence (Buffer) or presence (RBC) of red blood cells at the concentration (0.17 × 10⁶ ml−1) contaminating cerebellar cell suspensions. Each trace is the mean of three experiments. The dotted line is a plot of eqn (3) assuming a k2 value of 7.74 × 10⁻⁸ s−1 (red blood cell ml−1)−1 as reported by Liu et al. (1998). The data initially follow this line closely but deviate after about 1.5 min because the capacity of the haemoglobin to bind/inactivate NO becomes saturated. B, 100 μm DETA/NO was added (at t = 0) to buffer and freshly prepared suspensions of various cell lines (as indicated) all at 0.7–0.9 mg ml−1 protein; each trace represents a single experiment that was performed at least twice, with similar results.
The NO concentration profiles observed in the cell suspensions incubated with DETA/NO show that the cells contain a mechanism that clamps the NO concentration in the face of a continuous supply, and that the clamp is exhaustible. Considering just the plateau phase and ignoring autoxidation (which is negligible at the low NO concentrations being considered), the following consecutive scheme should apply:
| (1) |
The NO concentration with respect to time (t) is given by:
| (2) |
where x is the stoichiometry of NO release from the donor. Since k1 is very small (5.76 × 10⁻⁴ min−1 for a 20 h half-life) and much less than k2, the equation simplifies to:
| (3) |
This predicts that a steady-state NO concentration will be achieved at a rate governed by k2 and that, at the steady state:
| (4) |
With 250 μm DETA/NO and x = 1.6, the measured plateau in the cell suspension (55 nm NO) corresponds to a k2 of 4.18 ± 0.33 min−1 (n = 3), a value 5-fold greater than the inactivation rate constant estimated using 1 μm PROLI/NO. A plot of eqn (4) using this derived k2 value described well the kinetics of the NO concentration up to, and including, the plateau (Fig. 3A). When the DETA/NO concentration was reduced to 100 μm, the measured NO plateau was close to 2.5-fold lower (20 ± 3 nm; n = 3), as predicted if k2 was constant. Moreover, the plateau was sustained for longer (about 7 min) than it was at the higher concentration. As the cells were diluted and challenged with 250 μm DETA/NO, the plateau became progressively more shoulder-like (Fig. 3B). Nevertheless, the amplitudes and kinetics of the early phases (bearing in mind the response time of the electrode) were consistent with the k2 value being proportional to cell concentration (continuous lines, Fig. 3B).
Figure 3. NO inactivation at different release rates and cerebellar cell concentrations: implication for sGC activation.
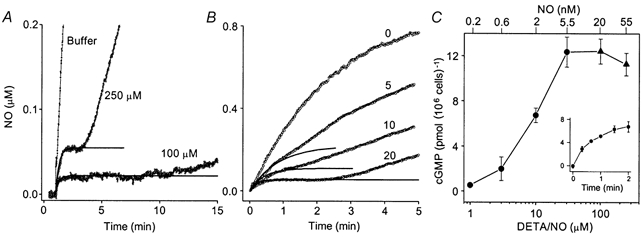
A, NO concentration profiles obtained after addition of 250 μm or 100 μm DETA/NO (as indicated) to a cerebellar cell suspension (20 × 106 cells ml−1) at t = 1 min. The response to 250 μm DETA/NO in buffer alone is shown for comparison. Each trace is the mean of three experiments. Continuous lines are plots of eqn (3) with k2= 4.18 min−1. B, NO profiles (mean of three experiments) after addition of 250 μm DETA/NO (at t = 0) to buffer containing 0, 5, 10 and 20 × 106 cells ml−1. Continuous lines are plots of eqn (3) with the k2 value decreasing proportionately with cell concentration (i.e. 4.18, 2.09 and 1.05 min−1). C, concentration-response curve for cGMP accumulation in the cerebellar cell suspension (20 × 106 cells ml−1) exposed to different concentrations of DETA/NO for 2 min (n = 3). The corresponding clamped NO concentrations are indicated on the upper abscissa (▴, measured values; •, extrapolated values). The inset shows the time course of cGMP accumulation in response to 10 μm DETA/NO (n = 3).
Implications for sGC activation
The low clamped NO concentrations imposed by the cells, even with what would be a high NO release rate (considering the activity of NO synthase in brain tissue), raises concerns about the compatibility of the mechanism with the ability of NO to activate its receptor, sGC, particularly should the potency of NO for sGC be similar to that measured using the purified enzyme (EC50= 250 nm; Stone & Marletta, 1996). Estimating the potency of NO for sGC activation has been problematic in the past because, with NO itself or a short-acting donor, the concentration of NO changes continuously. The finding that the cells themselves maintain clamped NO concentrations when exposed to a long-acting donor provided a simple way to address this important issue.
Measurements of cGMP accumulation in the cerebellar cells in response to different concentrations of DETA/NO (applied for 2 min) were therefore carried out. At 100 μm DETA/NO, which gives a clamped NO concentration of 20 nm, the cGMP response was found to be already supramaximal (Fig. 3C). Indeed, the EC50 for DETA/NO was an order of magnitude less, giving an extrapolated EC50 for NO on cellular sGC of only 2 nm.
Implications for mitochondrial function
Another potential target for NO is cytochrome c oxidase, which is responsible for mitochondrial O2 utilisation (Brown, 1999). NO competes with O2 at this site and so can act as a respiratory inhibitor. Experiments in which the cellular O2 consumption was measured were carried out to investigate how NO inactivation might affect its ability to engage this target. Even with a high NO release rate (250 μm DETA/NO) O2 consumption by the cerebellar cells was unaffected as long as the NO concentration remained clamped (55 nm; Fig. 4A). Exhaustion of the clamp after a few minutes, however, was associated with a progressive inhibition of respiration, which became marked as NO reached about 100 nm (at around 100 μm O2). The inhibition could be reversed immediately by scavenging NO with haemoglobin (10 μm; data not shown). To determine the potency of NO for reversible inhibition of mitochondrial respiration, transient exposure to NO was achieved using the rapid NO releaser, PROLI/NO. Addition of 1 μm PROLI/NO to cell suspensions at 100–140 μm O2 resulted in an immediate cessation of respiration, which remained inhibited until the NO concentration returned almost back to baseline (Fig. 4B). A plot of O2 consumption against NO concentration indicated an IC50 of 120 nm, with complete inhibition at 300 nm (Fig. 4C).
Figure 4. Duration of the NO concentration clamp: effect on mitochondrial function.
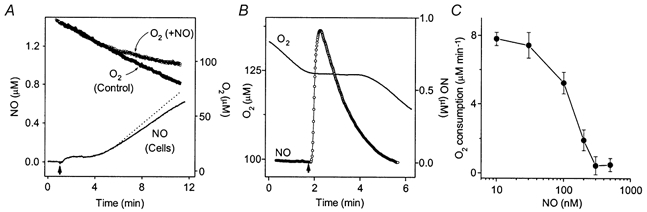
A, simultaneous recordings of the concentrations of O2 (top trace) and NO (continuous line) following addition of 250 μm DETA/NO to a cerebellar cell suspension (20 × 106 cells ml−1) at t = 1 min. The data are from a single experiment that was representative of three performed. The O2 consumption in the absence of DETA/NO in the same experiment is shown for comparison (O2 Control). The dashed line is the NO concentration corrected for the amount degraded by autoxidation, calculated from the autoxidation rate constant measured at 37 °C in buffer (20 × 106m−2 s−1) assuming an O2 concentration of 100 μm. B, concentration profiles of NO and O2 in a cerebellar cell suspension (20 × 106 cells ml−1) following addition of 1 μm PROLI/NO (at arrow). The traces are from a single experiment performed three times with similar results. C, rate of O2 consumption at different NO concentrations, derived by taking the average values for 10 s bins of the electrode traces (n = 3).
DISCUSSION
The results show that cerebellar cells possess a powerful NO-consuming activity that could not be attributed to reaction with O2, superoxide ions, or haemoglobin in contaminating red blood cells. A similarly acting sink is present, albeit at differing levels, in several cell lines indicating that there may be a general mechanism for inactivating NO in mammalian cells. The fact that the activity was preserved after cell lysis offers the possibility for the future identification of the species responsible. In preliminary experiments, we have found that the activity is both heat- and protease sensitive, implying the involvement of a protein (C. Griffiths & J. Garthwaite, unpublished observations). A recent study using liver cells pulsed with 3 μm NO found that they also rapidly consumed NO and did so in a manner that depended on the O2 concentration (Thomas et al. 2001). The contribution of superoxide ions to the consumption in this case was not investigated and, unlike in the cells examined here, the mechanism appeared not to saturate even with repeated additions totalling 30 μm NO.
In the cerebellar cells, the saturability of the sink explains why a lower rate constant was obtained using a pulse of NO (delivered using PROLI/NO) compared with the value derived from the plateau NO concentration formed in response to DETA/NO. Thus, the total NO generated within a few seconds by 1 μm PROLI/NO (1.6 μm NO) is the same as that produced by 250 μm DETA/NO after 7 min. At this time, the clamp has already failed and the NO concentration has risen to about 0.3 μm (Fig. 1D and Fig. 4A). Equation (4) predicts that, to achieve this concentration, the inactivation rate constant would be 0.8 min−1, which is close to that measured directly using PROLI/NO (0.9 min−1). Hence, the results with the two donors are mutually consistent. It should be stressed that the treatment of inactivation as a first-order process is purely for simplicity at this stage; details of the underlying chemistry will be needed to know the true kinetics.
Because of technical limitations, the NO clamp could be investigated over only a restricted range of NO release rates and cell concentrations. Assuming that the inactivation rate is proportional to tissue concentration and independent of the rate of NO release, the specific NO inactivation rate constant for the cerebellar cells would be 0.21 min−1 (106 cells ml−1)−1, or 5.0 min−1 (mg protein ml−1)−1. Extrapolating to a typical protein concentration in whole tissue (100 mg ml−1 protein), gives a rate of 8 s−1, which is equivalent to a half-life of 83 ms. Whilst, admittedly, the extrapolation is large and open to question, the resulting value is of the same order as the half-life of other paracrine signalling molecules, such as 5-hydroxytryptamine and dopamine (Bunin & Wightman, 1999) and is very similar to the NO half-life measured in living heart tissue (Kelm & Schrader, 1990), and to that extrapolated for liver from measurements of NO inactivation in isolated cells (Thomas et al. 2001).
Physiological significance
Physiologically, the NO clamp is likely to be important for several reasons. The most likely scenario in vivo to consider is when there are multiple point sources of NO within a tissue volume that switch on and off roughly simultaneously. This corresponds, for example, to event-related activity in discrete brain regions (Buckner & Koutstaal, 1998; Shoham et al. 1999), or to smooth muscle relaxation following stimulation of nitrergic nerves (Wiklund et al. 1997). First of all, the sink translates different rates of NO formation within a tissue volume into proportional steady-state NO concentrations. In other words, the device serves to ‘amplitude-code’ NO signals. In the target cells, desensitisation of sGC then allows cGMP to accumulate rapidly to levels (which may be transient or sustained) that are graded with the prevailing NO concentration (Bellamy et al. 2000). Together, the two mechanisms provide an explanation of how tissues respond to NO-releasing stimuli in a way that is graded with stimulus strength (Furchgott & Zawadzki, 1980; Garthwaite, 1985).
The inactivation rate will also govern the rates of rise and fall of NO concentration as sources switch on and off (Wood & Garthwaite, 1994). In central neurones, a typical stimulus for NO formation is a rise in cytosolic Ca2+ due to activation of the NMDA type of glutamate receptor (Garthwaite et al. 1988). A single Ca2+ transient produced in this way lasts for less than 1 s (Murthy et al. 2000) and so a minimal NO pulse should have a similar duration. The tissue NO inactivation rate extrapolated from the data here (8 s−1) implies that the kinetic behaviour of a locally generated NO ‘cloud’ will match the kinetics of even the shortest stimulus, thereby endowing the NO signal with temporal meaning.
Physiological inactivation mechanisms for signalling molecules generally have properties that are tuned to those of the receptor(s). If a previous measurement of the EC50 of NO for purified sGC (250 nm; Stone & Marletta, 1996) applied to the enzyme in cells, the sink described here would prevent such a concentration being attained, even with an NO release rate as high as the highest possible in the cerebellum. We estimate that in living cells NO is more than two orders of magnitude more potent (extrapolated EC50= 2 nm), enabling the entire concentration-cGMP response curve to be attained by steady-state NO production rates well below the maximum.
Exploring this point quantitatively, if one takes cerebellar cells incubated at 20 × 106 cells ml−1, NMDA receptor activation causes NO release which elevates cGMP to levels that are, at best, about one-third of those found with a maximally effective concentration of an NO donor (Garthwaite et al. 1988). From Fig. 3C, this equates to a steady-state NO concentration of about 1 nm. To attain this concentration, the rate of NO formation would need to be 100 fmol s−1. This extrapolates to only about 10 pmol g−1 s−1 for the intact tissue, a value that is roughly 1 % of the maximum cerebellar nNOS activity (Salter et al. 1995).
That NO is so much more potent as a sGC activator in intact cells than when the enzyme is isolated agrees with other recent evidence from this laboratory. It was found that, because of rapid desensitisation of sGC, the apparent potency of NO increases with the time of exposure to NO. When sGC was minimally desensitised (after 100 ms), the EC50 was about 45 nm whereas after only 1 s, the value fell to 20 nm (Bellamy & Garthwaite, 2001). The value of 2 nm obtained in the present experiments (2 min exposure) is based on the assumption that the NO inactivation rate constant remains unchanged when the NO concentration falls below 20 nm, which may be incorrect. Nonetheless, evidence from different directions is now converging to suggest that the potency of NO for sGC is of the same order as that determined for smooth muscle relaxation by NO, where EC50 values of 5 nm (Kelm et al. 1988) and 10 nm (Carter et al. 1997) have been measured using different methods of application.
Finally, it is worth noting that the tissue half-life of NO in the cerebellum extrapolated from the present data (83 ms) is similar to the measured rate of decline of sGC activity in the cerebellar cells when NO is removed, which occurs with a half-time of 190 ms (Bellamy & Garthwaite, 2001). When NO synthesis ceases, a similar (or somewhat faster) rate of decline of the NO concentration compared with the rate at which NO dissociates from its receptor is what would be expected for a dynamic signalling pathway.
Pathological significance
While it lasts, the NO clamp is likely not only to shape NO concentration profiles for physiological signalling but also to keep NO at subtoxic levels. As an index of potential toxicity, we measured the ability of NO to inhibit O2 consumption and found that (at 100–140 μm O2) the IC50 for NO was 120 nm. This is about one-half the value determined for brain synaptosomes (Brown & Cooper, 1994) but matches that measured for isolated brown fat mitochondria (Koivisto et al. 1997) under comparable conditions. Because NO competes with O2 for the relevant site in mitochondria (cytochrome c oxidase), NO will be more potent in vivo where the concentration of O2 is lower. The IC50 for NO under in vivo conditions (about 30 μm O2) has been estimated to be 60 nm in synaptosomes and 11 nm in the brown fat mitochondria. Whilst our results do not address the possible physiological role of a control of respiration by NO (Brown, 1999; Clementi et al. 1999), they do imply that the NO clamp enables the entire steady-state concentration- response curve for sGC activation by NO to be achieved without respiration being adversely affected.
The duration of the NO clamp in the face of continued NO release was limited. Its capacity in the cerebellar cells, indicated by the total NO consumed up to the end of the clamp, is about 0.6 μm (20 × 106 cells ml−1)−1, or 0.7 nmol (mg protein)−1. Taking the rate of NO formation induced by maximal NMDA stimulation in the cells, as calculated above (100 fmol s−1), it would take 1.7 h before the capacity was exceeded (assuming no regeneration of the sink during that time). Scaling-up to the in vivo situation gives the same duration. Whilst such a capacity (with a mechanism for restoration) presumably caters well for physiological NO signals, the fact that it can be exceeded provides a scenario for NO to become important pathologically.
Inactivation of NO did not cease when the clamp failed. Rather, the cells continued to consume NO for relatively long periods of time. At the highest DETA/NO concentration tested (250 μm, yielding 0.23 μm min−1 NO), the rate of consumption by the cerebellar cells after correcting for autoxidation (Fig. 4A) corresponded to 0.13 μm min−1 and this rate was maintained for at least 6 min. Whether the process is a residue of the one generating the clamp or another mechanism altogether remains to be determined. Nevertheless, this additional consumption of NO may represent a second line of defence for cells exposed to pathological rates of NO production. It is likely to be most relevant to when iNOS, which produces NO continuously, is expressed. From data on activated macrophages, the rate of NO generation by iNOS-expressing cells is about 6 pmol s−1 (106 cells)−1 (Lewis et al. 1995), which is 1000-fold higher than the estimated maximal NMDA-evoked NO release rate in the cerebellar cell suspension. Hence, a low density of iNOS-expressing cells may cause the NO clamp in surrounding cells to become saturated quite rapidly. By slowing the rate of NO accumulation, the secondary NO consumption could, at least, offer temporary protection.
Acknowledgments
This research was supported by The Sir Jules Thorn Charitable Trust and The Wellcome Trust; C.G. held a Wolfson Institute for Biomedical Research PhD studentship. We are grateful to David A. Goodwin for skilled help with the histology and Dr Barry J. Gibb for assistance with the cell lines.
References
- Beckman JS, Koppenol WH. Nitric oxide, superoxide, and peroxynitrite: the good, the bad, and ugly. American Journal of Physiology. 1996;271:C1424–1437. doi: 10.1152/ajpcell.1996.271.5.C1424. [DOI] [PubMed] [Google Scholar]
- Bellamy TC, Garthwaite J. Sub-second kinetics of the nitric oxide receptor, soluble guanylyl cyclase, in intact cerebellar cells. Journal of Biological Chemistry. 2001;276:4287–4292. doi: 10.1074/jbc.M006677200. [DOI] [PubMed] [Google Scholar]
- Bellamy TC, Wood J, Goodwin DA, Garthwaite J. Rapid desensitization of the nitric oxide receptor, soluble guanylyl cyclase, underlies diversity of cellular cGMP responses. Proceedings of the National Academy of Sciences of the USA. 2000;97:2928–2933. doi: 10.1073/pnas.97.6.2928. [DOI] [PMC free article] [PubMed] [Google Scholar]
- Brown GC. Nitric oxide and mitochondrial respiration. Biochimica et Biophysica Acta. 1999;1411:351–369. doi: 10.1016/s0005-2728(99)00025-0. [DOI] [PubMed] [Google Scholar]
- Brown GC, Cooper CE. Nanomolar concentrations of nitric oxide reversibly inhibit synaptosomal respiration by competing with oxygen at cytochrome oxidase. FEBS Letters. 1994;356:295–298. doi: 10.1016/0014-5793(94)01290-3. [DOI] [PubMed] [Google Scholar]
- Buckner RL, Koutstaal W. Functional neuroimaging studies of encoding, priming, and explicit memory retrieval. Proceedings of the National Academy of Sciences of the USA. 1998;95:891–898. doi: 10.1073/pnas.95.3.891. [DOI] [PMC free article] [PubMed] [Google Scholar]
- Bunin MA, Wightman RM. Paracrine neurotransmission in the CNS: involvement of 5-HT. Trends in Neurosciences. 1999;22:377–382. doi: 10.1016/s0166-2236(99)01410-1. [DOI] [PubMed] [Google Scholar]
- Carter TD, Bettache N, Ogden D. Potency and kinetics of nitric oxide-mediated vascular smooth muscle relaxation determined with flash photolysis of ruthenium nitrosyl chlorides. British Journal of Pharmacology. 1997;122:971–973. doi: 10.1038/sj.bjp.0701549. [DOI] [PMC free article] [PubMed] [Google Scholar]
- Clementi E, Brown GC, Feelisch M, Moncada S. Persistent inhibition of cell respiration by nitric oxide: crucial role of S-nitrosylation of mitochondrial complex I and protective action of glutathione. Proceedings of the National Academy of Sciences of the USA. 1998;95:7631–7636. doi: 10.1073/pnas.95.13.7631. [DOI] [PMC free article] [PubMed] [Google Scholar]
- Clementi E, Brown GC, Foxwell N, Moncada S. On the mechanism by which vascular endothelial cells regulate their oxygen consumption. Proceedings of the National Academy of Sciences of the USA. 1999;96:1559–1562. doi: 10.1073/pnas.96.4.1559. [DOI] [PMC free article] [PubMed] [Google Scholar]
- Ford PC, Wink DA, Stanbury DM. Autoxidation kinetics of aqueous nitric oxide. FEBS Letters. 1993;326:1–3. doi: 10.1016/0014-5793(93)81748-o. [DOI] [PubMed] [Google Scholar]
- Furchgott RF, Zawadzki JV. The obligatory role of endothelial cells in the relaxation of arterial smooth muscle by acetylcholine. Nature. 1980;288:373–376. doi: 10.1038/288373a0. [DOI] [PubMed] [Google Scholar]
- Garthwaite J. Cellular uptake disguises action of L-glutamate on N-methyl-D-aspartate receptors. With an appendix: diffusion of transported amino acids into brain slices. British Journal of Pharmacology. 1985;85:297–307. doi: 10.1111/j.1476-5381.1985.tb08860.x. [DOI] [PMC free article] [PubMed] [Google Scholar]
- Garthwaite J, Charles SL, Chess-Williams R. Endothelium-derived relaxing factor release on activation of NMDA receptors suggests role as intercellular messenger in the brain. Nature. 1988;336:385–388. doi: 10.1038/336385a0. [DOI] [PubMed] [Google Scholar]
- Garthwaite J, Garthwaite G. Cellular origins of cyclic GMP responses to excitatory amino acid receptor agonists in rat cerebellum in vitro. Journal of Neurochemistry. 1987;48:29–39. doi: 10.1111/j.1471-4159.1987.tb13123.x. [DOI] [PubMed] [Google Scholar]
- Gross SS, Wolin MS. Nitric oxide: pathophysiological mechanisms. Annual Review of Physiology. 1995;57:737–769. doi: 10.1146/annurev.ph.57.030195.003513. [DOI] [PubMed] [Google Scholar]
- Heales SJ, Bolanos JP, Stewart VC, Brookes PS, Land JM, Clark JB. Nitric oxide, mitochondria and neurological disease. Biochimica et Biophysica Acta. 1999;1410:215–228. doi: 10.1016/s0005-2728(98)00168-6. [DOI] [PubMed] [Google Scholar]
- Ignarro LJ. Signal transduction mechanisms involving nitric oxide. Biochemical Pharmacology. 1991;41:485–490. doi: 10.1016/0006-2952(91)90618-f. [DOI] [PubMed] [Google Scholar]
- Kelm M, Feelisch M, Spahr R, Piper HM, Noack E, Schrader J. Quantitative and kinetic characterization of nitric oxide and EDRF released from cultured endothelial cells. Biochemical and Biophysical Research Communications. 1988;154:236–244. doi: 10.1016/0006-291x(88)90675-4. [DOI] [PubMed] [Google Scholar]
- Kelm M, Schrader J. Control of coronary vascular tone by nitric oxide. Circulation Research. 1990;66:1561–1575. doi: 10.1161/01.res.66.6.1561. [DOI] [PubMed] [Google Scholar]
- Kharitonov VG, Sundquist AR, Sharma VS. Kinetics of nitric oxide autoxidation in aqueous solution. Journal of Biological Chemistry. 1994;269:5881–5883. [PubMed] [Google Scholar]
- Koivisto A, Matthias A, Bronnikov G, Nedergaard J. Kinetics of the inhibition of mitochondrial respiration by NO. FEBS Letters. 1997;417:75–80. doi: 10.1016/s0014-5793(97)01258-1. [DOI] [PubMed] [Google Scholar]
- Lewis RS, Tamir S, Tannenbaum SR, Deen WM. Kinetic analysis of the fate of nitric oxide synthesized by macrophages in vitro. Journal of Biological Chemistry. 1995;270:29350–29355. doi: 10.1074/jbc.270.49.29350. [DOI] [PubMed] [Google Scholar]
- Liao JC, Hein TW, Vaughn MW, Huang KT, Kuo L. Intravascular flow decreases erythrocyte consumption of nitric oxide. Proceedings of the National Academy of Sciences of the USA. 1999;96:8757–8761. doi: 10.1073/pnas.96.15.8757. [DOI] [PMC free article] [PubMed] [Google Scholar]
- Liu X, Miller MJ, Joshi MS, Sadowska-Krowicka H, Clark DA, Lancaster JR., Jr Diffusion-limited reaction of free nitric oxide with erythrocytes. Journal of Biological Chemistry. 1998;273:18709–18713. doi: 10.1074/jbc.273.30.18709. [DOI] [PubMed] [Google Scholar]
- Moncada S, Palmer RM, Higgs EA. Nitric oxide: physiology, pathophysiology, and pharmacology. Pharmacological Reviews. 1991;43:109–142. [PubMed] [Google Scholar]
- Murthy VN, Sejnowski TJ, Stevens CF. Dynamics of dendritic calcium transients evoked by quantal release at excitatory hippocampal synapses. Proceedings of the National Academy of Sciences of the USA. 2000;97:901–906. doi: 10.1073/pnas.97.2.901. [DOI] [PMC free article] [PubMed] [Google Scholar]
- Salter M, Duffy C, Garthwaite J, Strijbos PJ. Substantial regional and hemispheric differences in brain nitric oxide synthase (NOS) inhibition following intracerebroventricular administration of Nω-nitro-L-arginine (L-NA) and its methyl ester (L-NAME) Neuropharmacology. 1995;34:639–649. doi: 10.1016/0028-3908(95)00036-6. [DOI] [PubMed] [Google Scholar]
- Salter M, Duffy C, Garthwaite J, Strijbos PJ. Ex vivo measurement of brain tissue nitrite and nitrate accurately reflects nitric oxide synthase activity in vivo. Journal of Neurochemistry. 1996;66:1683–1690. doi: 10.1046/j.1471-4159.1996.66041683.x. [DOI] [PubMed] [Google Scholar]
- Schmidt K, Desch W, Klatt P, Kukovetz WR, Mayer B. Release of nitric oxide from donors with known half-life: a mathematical model for calculating nitric oxide concentrations in aerobic solutions. Naunyn-Schmiedeberg's Archives of Pharmacology. 1997;355:457–462. doi: 10.1007/pl00004969. [DOI] [PubMed] [Google Scholar]
- Sharpe MA, Cooper CE. Reactions of nitric oxide with mitochondrial cytochrome c: a novel mechanism for the formation of nitroxyl anion and peroxynitrite. Biochemical Journal. 1998;332:9–19. doi: 10.1042/bj3320009. [DOI] [PMC free article] [PubMed] [Google Scholar]
- Shoham D, Glaser DE, Arieli A, Kenet T, Wijnbergen C, Toledo Y, Hildesheim R, Grinvald A. Imaging cortical dynamics at high spatial and temporal resolution with novel blue voltage-sensitive dyes. Neuron. 1999;24:791–802. doi: 10.1016/s0896-6273(00)81027-2. [DOI] [PubMed] [Google Scholar]
- Stone JR, Marletta MA. Spectral and kinetic studies on the activation of soluble guanylate cyclase by nitric oxide. Biochemistry. 1996;35:1093–1099. doi: 10.1021/bi9519718. [DOI] [PubMed] [Google Scholar]
- Stuehr DJ. Mammalian nitric oxide synthases. Biochimica et Biophysica Acta. 1999;1411:217–230. doi: 10.1016/s0005-2728(99)00016-x. [DOI] [PubMed] [Google Scholar]
- Thomas DD, Liu X, Kantrow SP, Lancaster JR. The biological lifetime of nitric oxide: implications for the perivascular dynamics of NO and O2. Proceedings of the National Academy of Sciences of the USA. 2001;98:355–360. doi: 10.1073/pnas.011379598. [DOI] [PMC free article] [PubMed] [Google Scholar]
- Waldman SA, Murad F. Cyclic GMP synthesis and function. Pharmacological Reviews. 1987;39:163–196. [PubMed] [Google Scholar]
- Wiklund NP, Cellek S, Leone AM, Iversen HH, Gustafsson LE, Brundin L, Furst VW, Flock A, Moncada S. Visualisation of nitric oxide released by nerve stimulation. Journal of Neuroscience Research. 1997;47:224–232. doi: 10.1002/(sici)1097-4547(19970115)47:2<224::aid-jnr11>3.0.co;2-2. [DOI] [PubMed] [Google Scholar]
- Wood J, Garthwaite J. Models of the diffusional spread of nitric oxide: implications for neural nitric oxide signalling and its pharmacological properties. Neuropharmacology. 1994;33:1235–1244. doi: 10.1016/0028-3908(94)90022-1. [DOI] [PubMed] [Google Scholar]