

Abstract
Translation initiation factors have complex functions in cells that are not yet understood. We show that depletion of initiation factor eIF4GI only modestly reduces overall protein synthesis in cells, but phenocopies nutrient starvation or inhibition of protein kinase mTOR, a key nutrient sensor. eIF4GI depletion impairs cell proliferation, bioenergetics, and mitochondrial activity, thereby promoting autophagy. Translation of mRNAs involved in cell growth, proliferation, and bioenergetics were selectively inhibited by reduction of eIF4GI, as was the mRNA encoding Skp2 that inhibits p27, whereas catabolic pathway factors were increased. Depletion or overexpression of other eIF4G family members did not recapitulate these results. The majority of mRNAs that were translationally impaired with eIF4GI depletion were excluded from polyribosomes due to the presence of multiple upstream open reading frames and low mRNA abundance. These results suggest that the high levels of eIF4GI observed in many breast cancers might act to specifically increase proliferation, prevent autophagy, and release tumor cells from control by nutrient sensing.
Introduction
Translational control is an important regulatory point that affects diverse processes such as development, differentiation, apoptosis, cellular growth, responses to cellular stresses, and tumorigenesis. Translation of most mRNAs is controlled at the rate-limiting step of initiation, the assembly of an elongation-competent 80S ribosome. The eukaryotic 5′ end 7-methyl-GTP (m7GTP) cap-tags mRNAs for translation by recruiting the eukaryotic initiation factor (eIF)4F complex, which is composed of three proteins: cap-binding protein eIF4E, scaffolding protein eIF4G, and ATP-dependent RNA helicase eIF4A. The multi-domain adaptor proteins eIF4GI and related family member eIF4GII are key initiation factors in this process. For instance, absence of eIF4GI from in vitro translation systems prevents initiation complex formation and protein synthesis (Ali et al., 2001). Moreover, apoptosis and picornavirus infection both result in general translational repression, which is associated, in part, with proteolytic cleavage of eIF4G (Marissen and Lloyd, 1998; Connolly et al., 2006; Constantinou and Clemens, 2007).
An important regulatory signaling pathway for translation is the AKT/mTOR protein kinase network, which responds to growth factors, stress, and the nutritional state of the cell (Holcik and Sonenberg, 2005). When activated, mTOR phosphorylates and inactivates key translation regulatory proteins known as eIF4E binding proteins (4E-BPs) (Gingras et al., 1998). Stresses such as lack of growth factors, nutrient deprivation, or hypoxia inhibit mTOR, generating hypo-phosphorylated (active) forms of the 4E-BPs that sequester eIF4E, preventing eIF4F complex formation and blocking cap-dependent mRNA translation (Gingras et al., 1998). mTOR may also phosphorylate eIF4GI, possibly indirectly (Raught et al., 2000). Although a role for eIF4GI phosphorylation in translation is not established, it may be required for efficient eIF4F formation in some tissues (Vary et al., 2007).
Deregulation of the mTOR pathway, and of mRNA translation from negative feedback responses, is associated with increased transformation and oncogenesis (Cully et al., 2006). In this regard, overexpression of eIF4GI is also associated with malignancy in some human cancers (Schneider and Sonenberg, 2007), particularly breast cancers (Braunstein et al., 2007). Engineered overexpression of eIF4GI in immortalized fibroblasts also results in malignant transformation (Fukuchi-Shimogori et al., 1997). In this paper, we demonstrate that the eIF4GI member of the eIF4G family selectively promotes translation of mRNAs involved in cellular bioenergetics and mitochondrial activity, the majority of which are of low abundance and contain multiple upstream open reading frames (ORFs). Reduction of eIF4GI abundance, in turn, is shown to partially but distinctly phenocopy depletion of mTOR, impairing nutrient sensing and inducing autophagy.
Results
Silencing of eIF4GI and DAP5, but not other eIF4G factors, only modestly reduces global protein synthesis rates
To address the physiological functions of eIF4G, levels of eIF4GI were reduced by siRNA silencing in MCF10A cells, an immortalized breast epithelial cell line that preserves translational control pathways that are often uncoupled with frank transformation (Connolly et al., 2006). Transfection of siRNA to eIF4GI rapidly reduced eIF4GI protein levels by ∼10-fold for more than 4 d (Fig. 1 A; Fig. S1, A and B, available at http://www.jcb.org/cgi/content/full/jcb.200710215/DC1). Indirect immunofluorescence analysis revealed that eIF4GI was down-regulated in almost all cells (Fig. S1 C), in both the nucleus and cytoplasm (Fig. S1 D). Unexpectedly, protein synthesis rates in eIF4GI-silenced cells were decreased by only 20% compared with control cells (measured by [35S]-methionine incorporation rate) (Fig. 1 A, right), despite a 90% reduction in eIF4GI protein levels (Fig. 1 A; Fig. S1, A and B). Results were unchanged by normalization to equal cell number rather than equal protein content, and there was no evidence for increased [35S]-methionine uptake in eIF4GI-silenced cells (unpublished data). Identical results were also obtained in other cell types including primary human neonatal dermal fibroblasts and BT-474 breast cancer cells (Fig. S2). The siRNA transfection itself had no effect on protein synthesis, as mock-transfected and control siRNA-transfected cells behaved identically (unpublished data).
Figure 1.

eIF4GI silencing does not significantly alter global translation rates. MCF10A cells were transfected with the indicated siRNAs. (A) Cells were harvested and protein levels determined by immunoblot analysis (left). Protein synthesis rates for eIF4GI-silenced cells compared with control siRNA-transfected cells (set at 100%, right). (B) Protein synthesis rates in siRNA-transfected cells (left). Extent of silencing determined by immunoblot (right). (C) Protein and phospho-protein levels determined by immunoblot analysis. (D) siRNA transfected cells were treated with 100 nM rapamycin and 10 μM LY294002, or vehicle for 2 h, and protein synthesis rates determined after 2 h of recovery (left). eIF4G1 levels and 4E-BP1 phosphorylation determined (right). (E) Translation elongation was blocked with 200 μM puromycin for 10 min, and protein synthetic rates were measured after treatment or after 30 min of recovery. (F) Translation rates were determined in siRNA silenced cells (top). Efficiency of silencing shown by immunoblot (bottom). Quantification of immunoblots was performed by autoradiogram densitometry using multiple exposures and dilution series. Error bars represent standard deviation, calculated from at least three independent experiments. Statistical analysis used the t test; *, P < 0.05.
eIF4GI is the major eIF4G isoform in most mammalian cells (>85%) (Bovee et al., 1998). In the budding yeast, which also possesses two homologues of eIF4G, single knockout of either eIF4G causes minor growth defects, but the combined knockout is lethal (Goyer et al., 1993). We therefore investigated whether eIF4GII maintains translation in eIF4GI-silenced cells. Efficient silencing of both eIF4GI and II did not decrease protein synthesis more than depletion of eIF4GI alone (Fig. 1 B). In contrast, modest silencing of initiation factor eIF3 S1 and S8 expression impaired protein synthesis by more than 50% (Fig. 1 B), as did moderate silencing of eIF3 S8 alone (∼50%) (unpublished data). Importantly, silencing of eIF4GI largely blocked assembly of eIF4F cap-initiation complexes, shown by recovery of complexes using m7GTP-cap chromatography and visualization by immunoblot analysis (Fig. S2 E). eIF4GI, but not eIF4GII-silenced cells, also showed decreased levels of eIF4E (Fig. 1 C; Fig. S4 A), consistent with a previous report (Svitkin et al., 2005), and phosphorylation of eIF4E at serine 209 was abolished. eIF4E phosphorylation requires assembly of eIF4E with eIF4G and the kinase Mnk1 (Pyronnet et al., 1999). It is therefore unlikely that an occult pool of functional eIF4GI remains in silenced cells.
Inhibition of cap-dependent translation by treatment of eIF4GI or eIF4GI/II-silenced cells with the cap-dependent mRNA translation inhibitors rapamycin (targeting mTOR) and LY294002 (targeting PI3K) blocked cap-dependent mRNA translation and activated 4E-BP1 (shown by its dephosphorylation) (Fig. 1 D, right). Nevertheless, after drug removal, both control and silenced cells fully and rapidly recovered protein synthesis. Similar results were obtained when cells were challenged with other physiological stresses that also down-regulate cap-dependent mRNA translation such as hypertonic and hypoxic stress (Fig. S2, C and D). Inhibition of translation elongation mediated by puromycin treatment was also readily reversed with drug wash-out in eIF4GI-silenced cells (Fig. 1 E). Rates of de novo mRNA translation, as tested by transfection of a bicistronic reporter after eIF4GI silencing, were similar in both eIF4GI-depleted and control cells (Fig. S2 F). eIF4GI silencing also had no impact on translation elongation rates. eEF2 phosphorylation was unaltered and ribosome half-transit times were similar in control and eIF4GI-depleted cells (71 and 64 s, respectively, P = 0.3; Fig. S3, and unpublished data).
The eIF4G family member DAP5 has recently been shown to participate in the maintenance of overall protein synthesis (Lee and McCormick, 2006; Nousch et al., 2007). Independent silencing of eIF4GI or DAP5 reduced overall protein synthesis by 20–30%, whereas co-depletion blocked it by >60% (Fig. 1 F). In contrast, double depletion of eIF4GI and eIF4G family member Paip1, reportedly a global translation-enhancing factor, did not further decrease overall protein synthesis compared with eIF4GI depletion alone (Fig. 1 F; Fig. S4, A and B) (Craig et al., 1998). Thus, both eIF4GI and DAP5 together are required to maintain high rates of global protein synthesis.
Proliferative and bioenergetic alterations in eIF4GI-silenced cells phenocopy mTOR pathway inhibition
Despite a very limited reduction of protein synthesis, eIF4GI-silenced cells were morphologically quite distinct compared with control or DAP5-silenced cells, displaying a spindly and vacuolated appearance with membrane roughing (Fig. 2 A). Forward scatter flow cytometry analysis showed a >15% decrease in overall cell size in eIF4GI-silenced compared with control cells (Fig. 2 B), or eIF4GII or DAP5-silenced cells (unpublished data). The doubling time of eIF4GI-depleted cells was also increased 40% compared with control cells, beginning 48 h after eIF4GI silencing (Fig. 2 C), and involved decreased S phase accumulation and pronounced G1 phase restriction (Fig. 2 D). eIF4GII-silenced cells showed no alterations in cell cycle (Fig. 2, C and D). In agreement with our results, Dap5 silencing has been shown to decrease proliferation (Lee and McCormick, 2006), similar to eIF4GI silencing.
Figure 2.

Morphological and proliferative changes in eIF4GI-silenced cells. (A) Immunofluorescence microscopy of cells, performed as described in Materials and methods. Nuclei were stained with propidium iodide and the cytoskeleton with β-actin. Bar, 5 μM. (B) Cell size of control and eIF4GI-depleted cells were analyzed by flow cytometry. X-axis shows cell number, y-axis represents forward scatter (a measure of cell size). Average forward scatter of three independent experiments is shown; P < 0.002 (t test). (C) Proliferation of control (♦), eIF4GII-silenced (▴), and eIF4GI-silenced (▪) cells. (D) Cell cycle distribution of control, eIF4GI-, eIF4GII-, raptor-, and eIF4GI/raptor-silenced cells was determined as indicated in Materials and methods. Data are representative of at least three independent experiments.
Cell size and proliferation are in large part controlled by the PI3K/AKT/mTOR pathway (Sarbassov et al., 2005). Treatment of cells with the mTOR inhibitor rapamycin, or specific silencing of the mTOR partner protein raptor, blocks proliferation and diminishes cell size (Kim et al., 2002; Sarbassov et al., 2005), similar to the phenotype of eIF4GI-silenced cells. Accordingly, we found that raptor depletion also restricts cells at G1, similar to eIF4GI depletion (Fig. 2 D). Combined silencing of eIF4GI and raptor slightly increased arrest of cells in G1 and inhibition of proliferation (Fig. 2 D, Fig. S4, C and D; also shown later). eIF4GI is therefore linked to the mTOR network to influence cell size and proliferation.
In Saccharomyces cerevisiae, eIF4GI is connected to the mTOR pathway in response to nutrient cues that control eIF4GI stability (Berset et al., 1998). Consistent with the results in yeast, we found that inhibition of mTOR function with LY294002 and rapamycin for 12 h reduced eIF4GI levels by half, without altering levels of eIF4E or eIF4A (Fig. 3 A). Drug inhibition of mTOR was shown by abolition of ribosomal protein S6 phosphorylation at mTOR target sites S240/S244 (Fig. 3 A). Furthermore, eIF4GI is reportedly phosphorylated at position S1108 with activation of the mTOR pathway and nutrient sensing (Raught et al., 2000). To determine whether eIF4GI is directly connected to the mTOR pathway, we examined its phosphorylation by mTOR in response to nutrient signaling.
Figure 3.

Metabolic alterations in eIF4GI-depleted cells. (A) MCF10A cells treated with vehicle or 10 μM LY294002 and 100 nM rapamycin (Rapa/Ly) were immunoblotted for the indicated proteins. (B) Control or raptor shRNA-transduced cells were serum/insulin starved and harvested (time 0), or allowed to recover in full medium for the indicated times (minutes, min). Phosphorylation state and total levels of the indicated proteins were determined by immunoblot. (C) As in A, control or raptor shRNA-expressing cells were starved for leucine for 48 h and either frozen or allowed to recover by leucine restitution for 12 h before harvesting. (D) In vitro mTORC1 kinase assays using S6K1 or eIF4GI as substrates. Phospho- and total levels of the indicated proteins were detected by immunoblot. (E) Cells transfected with the specified siRNAs were leucine starved and allowed to recover by leucine restitution. Cell size changes were captured by analysis of forward scatter by flow cytometry showing actual values. (F) Quantitation of cell size changes in control and silenced cells after leucine starvation and recovery, as described in E. (G) Mitochondrial polarization, as measured by the incorporation of the mitochondrial-permeable dye TMRE. Average TMRE loading values of three independent experiments shown; t test, P < 0.005 (right). Quantitation of TMRE incorporation in a panel of siRNA-transfected cells with standard deviations shown (right). (H) ATP levels in control and eIF4GI-silenced cells measured as described in Materials and methods (top). Error bars represent standard deviation, calculated from at least three independent experiments. Statistical analysis used the t test; *, P < 0.005; **, P < 0.01. Immunoblot analysis of control and silenced cells (bottom).
mTOR complex 1 (mTORC1) is composed of the kinase mTOR, and the proteins raptor and mLST8, which collectively mediate many mTOR kinase functions (Guertin et al., 2006). We asked whether serum- and insulin-mediated phosphorylation of eIF4GI at position S1108 is mediated by mTORC1 because eIF4GI phosphorylation is coordinately decreased by serum withdrawal or hypertonic stress, both of which also inhibit mTORC1 activity (Raught et al., 2000). eIF4GI phosphorylation at S1108 (P-eIF4GI) was rapidly increased in serum- and insulin-starved cells after serum/insulin restitution, but was blocked in raptor-silenced cells, indicating that mTORC1 signals to eIF4GI (Fig. 3 B). mTORC1 integrates multiple signals including amino acid availability to control growth and proliferation (Nobukuni et al., 2007). Accordingly, eIF4GI phosphorylation in leucine-starved cells increased upon leucine restoration, and was reduced by raptor silencing (Fig. 3 C). To determine whether eIF4GI is directly phosphorylated by mTOR, immunoprecipitated mTORC1 complex from MCF10A cellular lysates was mixed with isolated S6K1 or eIF4GI (obtained from cells treated with rapamycin and LY294002 to reduce phosphorylation). Immunoprecipitated mTORC1 phosphorylated S6K1 at T389 (P-S6K) and eIF4GI at S1108 (P-eIF4GI) in a Wortmannin-sensitive manner (Fig. 3 D). eIF4GI therefore undergoes mTORC1-dependent phosphorylation in response to growth factors and amino acids. mTORC1 kinase activity has also been linked to eIF4GI abundance (Berset et al., 1998) and effective eIF4F complex formation (Vary et al., 2007).
Inhibition of mTORC1 signaling leads to an inability to control cell size in response to nutrients, such as leucine (Kim et al., 2002; Sarbassov et al., 2005). The effect of eIF4GI silencing on cell size was examined by forward scatter flow cytometry as a measure of cell diameter to compare control and eIF4GI-silenced MCF10A cells that had been starved for leucine for 48 h, or starved and allowed to recover by the addition of leucine for 12 h. eIF4GI-depleted cells were unable to recover cell size after leucine restitution, similar to mTORC1 inhibition (Fig. 3, E and F). In fact, reduction of eIF4GI more severely blocked cell size recovery than did inhibition of mTORC1 by depletion of raptor (Fig. 3 F). Although DAP5 silencing also prevented full cell size recovery, it was not as severe as eIF4GI or raptor depletion, whereas eIF4GII and Paip1 silencing had no effect (Fig. 3 F, and unpublished data). An inability to sense nutrients or growth factors, which depends in large part on the mTOR signaling pathway, can lead to mitochondrial dysfunction due to an inability to use extracellular nutrients (Kundu and Thompson, 2005). We tested whether eIF4GI-depleted cells, like growth factor–deprived or mTOR-inhibited cells, exhibit mitochondrial impairment (Lum et al., 2005; Schieke and Finkel, 2006). Depletion of eIF4GI, but not other translation factors (depletion shown in Fig. S4 A), resulted in a significant decrease in mitochondrial membrane potential (decreased loading of the membrane permeable fluorescent dye, TMRE) in MCF10A cells compared with control cells. (Fig. 3, G and H). Similar results were obtained in HeLa cells as well (not depicted). Moreover, we can exclude technical explanations for these results such as abnormal mTOR activation by high amino acid or serum levels in the medium because MCF10A cells are cultivated in low amino acid medium with minimal serum, whereas HeLa cells are cultivated in more enriched medium. If diminished mitochondrial function in eIF4GI-depleted cells phenocopies that of mTOR inhibition, it should be a result of an inability to use extracellular nutrients. Consequently, cellular energy stores should also be depleted, leading to an increased AMP/ATP ratio and subsequent AMPK activation (Kundu and Thompson, 2005). Indeed, ATP content is reduced by 45% in eIF4GI-depleted cells compared with control cells, which correlates with a threefold increase in activated (T172-phosphorylated) AMPK (Fig. 3 H), consistent with a key role for eIF4GI in maintenance of bioenergetics. In agreement with diminished mitochondrial function, DAP5 silencing did not activate AMPK (shown later in Fig. 5 A). An energetic defect exists in eIF4GI-silenced cells that mimics the defect observed with mTOR inhibition or nutrient deprivation.
eIF4GI depletion induces autophagy
A key phenotype of mTORC1 inhibition is induction of autophagy. During autophagy cells engulf large portions of cytoplasm into autophagosomes, which fuse with lysosomes to recycle cellular components as energy sources (Kundu and Thompson, 2005). We tested whether eIF4GI depletion results in autophagy. A widely used marker for autophagy is the intracellular distribution of LC3 protein. The LC3-I form migrates as a 16-kD band in SDS-PAGE, but is lipidated during autophagy to produce a 14-kD LC3-II form, and incorporated into growing autophagosomes (Kabeya et al., 2000). A GFP-LC3 fusion protein was expressed in 293 cells (to demonstrate cell type independence), followed by transfection of control or eIF4GI-siRNAs. GFP-LC3 presented as a diffuse cytoplasmic stain in nontransfected and control siRNA transfected cells, but was found clustered and in vacuoles in nutrient-starved or eIF4GI-silenced cells (Fig. 4 A). Moreover, treatment of MCF10A cells with the membrane-permeable dye monodansylcadaverine (MDC), which binds specifically to autophagosomes (Biederbick et al., 1995), demonstrated 50% more uptake in nutrient-starved or eIF4GI-silenced cells than in control cells, consistent with the development of autophagy (Fig. 4 B). Immunoblot analysis of endogenous LC3 protein isolated from total MCF10A protein lysates showed a significant increase in the lipidated LC3-II form at the expense of the unmodified LC3-I form in eIF4GI-silenced cells (Fig. 4 C), consistent with autophagy induction by eIF4GI depletion. It should be noted that the LC3 antiserum detects the faster-migrating LC3-II form more efficiently than the LC3-I form (Mizushima and Yoshimori, 2007).
Figure 4.

Autophagy induction and reduced cellular proliferation in eIF4GI-silenced cells. (A) 293T cells were transfected with a plasmid encoding GFP-LC3 and treated as shown. Nuclei were stained with propidium iodide (red). Bar, 5 μM. (B) MCF10A cells were treated as indicated and autophagosome formation established by MDC loading. Error bars represent standard deviation, calculated from at least three independent experiments. Statistical analysis used the t test; *, P < 0.05. (C) Endogenous LC3 cleavage in control and eIF4GI-silenced MCF10A cells determined by immunoblot. (D) MCF10A cells expressing AcGFP-LC3 transfected with (a) control (0–5% with dots), (b) eIF4GI (>90% with dots), (c) DAP5 (>90% with dots), (d) eIF4GII (0–5% with dots), (e) eIF4E (<5% with dots) siRNAs, or (f) treated with 200 μM puromycin (0–5% with dots) for 2 h. AcGFP-LC3 clustering analyzed by confocal microscopy. The number of cells with LC3-GFP dots were quantified in five fields of similar numbers of cells, t test (P < 0.001). Bar, 5 μM. (E) Immunoblot analysis showing increased levels of DAP5 in pBMN-DAP5-I-GFP transduced cells compared with vector control. (F) Growth rates on siRNA transfected cells (♦, control; ▴, DAP5; and ▪, eIF4GI). (G) Growth ratios determined from data shown in F.
To compare these results to depletion of other translation factors, we expressed GFP-LC3 in MCF10A cells and silenced eIF4GI, DAP5, eIF4GII, or eIF4E, or inhibited protein synthesis with puromycin. These cells also showed autophagy induction as visualized by GFP-LC3 clustering with DAP5 depletion, but not with silencing of eIF4GII or eIF4E. Furthermore, overall inhibition of protein synthesis with puromycin did not induce autophagy (Fig. 4 D). DAP5 depletion shares some of the characteristics observed for eIF4GI silencing, including similar effects on translation rates, reduced cellular proliferation, autophagy induction, and altered cell size regulation in response to nutrients. However, DAP5-silenced cells do not demonstrate the morphological changes, alterations in mitochondrial activity, or AMPK activation that were observed in eIF4GI-depleted cells. These data indicate a potential role for eIF4GI and DAP5 in overlapping but distinct pathways. In contrast, eIF4E silencing, although decreasing translation rates to a similar extent as eIF4GI or DAP5 silencing (Fig. S4 B), did not cause any of these same alterations including induction of autophagy (Fig. 4 D, and unpublished data) (Svitkin et al., 2005). These results therefore disclose a specific function for eIF4GI in cellular bioenergetics and suggest that eIF4GI is connected to the mTORC1 nutrient-sensing pathway. Collectively, these results also exclude trivial explanations for induction of autophagy such as the cell culture medium, leucine and other amino acid levels, or special growth supplements in medium such as hydrocortisone, insulin, and epidermal growth factor.
Because both eIF4GI and DAP5 silencing reduce protein synthesis rates, and combined depletion strongly arrests translation, we determined whether one of these two factors could physiologically substitute for the other. We characterized cell proliferation rates in control cells and MCF10A cells engineered to overexpress DAP5 (Fig. 4, E–G). DAP5 overexpression had little effect on overall translation or proliferation rates (Fig. 4 F, and unpublished data), but prevented cell growth arrest by DAP5 depletion (Fig. 4, F and G). Conversely, DAP5 overexpression did not block growth rate inhibition by eIF4GI-silencing, demonstrating that DAP5 and eIF4GI are not physiologically interchangeable (Fig. 4, F and G).
eIF4GI silencing and decreased cellular proliferation are associated with diminished translation of E3 ubiquitin ligase Skp2 mRNA
Because eIF4GI silencing results in increased G1 checkpoint accumulation, we investigated the effect on Skp2 mRNA translation. Skp2 promotes ubiquitin-dependent proteasome degradation of cell cycle inhibitor p27 (Pagano, 2004). eIF4GI silencing strongly increased levels of p27 protein, consistent with loss of Skp2 expression (Fig. 5 A). Inhibition of the proteasome with MG132 only minimally increased Skp2 levels in eIF4GI-silenced cells, suggesting that eIF4GI silencing primarily inhibits Skp2 mRNA translation (Fig. 5 B), also supported by decreased protein synthesis of Skp2 without alteration of mRNA levels (Fig. 5, C and E). In contrast, DAP5 depletion increased p27 levels without altering Skp2 levels (Fig. 5 E). Thus, despite similar effects on growth, eIF4GI and DAP5 perform distinct functions (Lee and McCormick, 2006). This result is consistent with qRT-PCR analysis of total and polysome-bound Skp2 mRNA (Fig. 5, C and D), a significant fraction of which shifts to lighter polysomes with eIF4GI depletion. In contrast, Hsp27 mRNA shifts to heavier polysomes with eIF4GI depletion, consistent with the array analysis (described later) and increased protein levels (Fig. 5 D). These results show that eIF4GI silencing impairs cell proliferation, in part, by reducing the translation of Skp2 mRNA and thereby increasing the abundance of p27 protein.
Figure 5.

eIF4GI depletion blocks Skp2 mRNA translation. (A) Immunoblot of the indicated proteins in cells transfected with specific siRNAs. (B) Control or eIF4GI-depleted cells treated with proteasome inhibitor and proteins detected by immunoblot. (C) Total Skp2 mRNA levels in eIF4GI-silenced cells, determined by qRT-PCR analysis. (D) qRT-PCR analysis of Skp2 and Hsp27 mRNA in polysomes with eIF4GI depletion. (E) Immunoprecipitation of 35S-Met labeled lysates with the indicated antibodies. Error bars represent standard deviation, calculated from at least three independent experiments. Statistical analysis used the t test; *, P < 0.05.
Polysomal association of a subset of mRNAs is altered by eIF4GI depletion, mediated in part by the presence of upstream ORFs and low mRNA abundance
We explored whether translation of a small subset of mRNAs might be highly sensitive to reduction of eIF4GI levels. We identified the constellation of polysome-associated mRNAs in control and eIF4GI-silenced cells using gene expression arrays, comparing polysome mRNA levels to total mRNA abundance. Polysome profiles for control and eIF4GI-silenced cells derived from three independent studies were similar (Fig. 6 A), displaying a slight decrease in polysome content in eIF4GI-depleted cells. Reduction in eIF4GI levels was evident in all polysome fractions, eliminating the possibility of translation by a small pool of polysome-associated eIF4GI (Fig. 6 A). eIF4GI reduction did not alter total abundance or polysome association of the majority of mRNAs (∼70%). The remaining mRNAs displayed significant changes in polysome association, overall abundance, or both (P < 0.05; SAM, false discovery rate of 5%). Hierarchical clustering analysis revealed four sets of mRNAs in eIF4GI-silenced cells (Fig. 6 B). (1) No overall mRNA change but decreased polysome association (134 genes); (2) decreased polysome association despite an increase in overall mRNA level (31 genes); (3) increased polysome association with no alteration in mRNA level (143 genes); and (4) increased polysome association despite an overall decrease in mRNA level (31 genes; see DNA microarray data section of Materials and methods). Gene array data were validated by performing immunoblot analysis on some target genes (Fig. 6 C) and real-time quantitative RT-PCR. For instance, eIF4GI-silenced cells showed increased Hsp27 and KLF4 protein levels and decreased levels of caspase 3, ARALAR, and MYCBP (and Skp2, as shown earlier), confirming array predictions at the mRNA and protein levels (Fig. 6 C).
Figure 6.

Translation of a subset of mRNAs is sensitive to eIF4GI levels. (A) Control and eIF4GI-depleted polysomes and eIF4F components determined by immunoblot analysis. (B) mRNAs collected from polysomal fractions were pooled and compared with total mRNAs by microarray hybridization. Targets were clustered according to their relative change in the polysome fractions compared with total mRNA levels. Four clusters were derived, representing mRNAs whose polysomal association in eIF4GI-depleted cells either decreases without a change in total mRNA (top left) or despite an increase in total mRNA (top right). Clusters of mRNAs whose polysomal association increases either with (bottom right) or without a decrease in total mRNA levels are shown (bottom left). (C) Control or eIF4GI-depleted cells probed for the indicated proteins by immunoblot analysis. (D) Diagram of pRL-HCV IRES-FL reporter mRNAs with mda-7 wild-type or mutant 5′ UTRs (top). Cap-dependent translation of bicistronic constructs in the indicated cells, depicted as mda-7 wild-type or mutant 5′ UTR-directed translation normalized to IRES activity. Error bars represent standard deviation, calculated from at least three independent experiments. Statistical analysis used the t test; *, P < 0.005.
A number of mRNAs revealed in these clusters are consistent with the eIF4GI-silencing phenotype. In particular, reduction in polysome association of mRNAs encoding mitochondrial regulatory proteins, such as ARALAR, a mitochondrial solute carrier that regulates ATP production in response to Ca2+ signals, and AKAP10, an anchoring protein that targets protein kinase A to mitochondria, are consistent with altered signaling to mitochondria, which could be responsible for some of the bioenergetic defects observed in eIF4GI-silenced cells (Wang et al., 2001). Translational alterations in eIF4GI-silenced cells likely also trigger indirect gene expression changes. For example, eIF4GI-silenced cells demonstrate diminished levels of the myc coactivator MYCBP, and increased levels of proliferation inhibitor KLF4 (Fig. 6 C) (Rowland and Peeper, 2006). In contrast, mRNAs encoding enzymes involved in branched-chain amino acid and fatty acid catabolism are increased in polysomes of eIF4GI-silenced cells, indicative of induction of a general catabolic state. Of interest, the PI3K/AKT/mTOR pathway regulates β-oxidation (Deberardinis et al., 2006), and multiple mRNAs involved in this process are increased in polysomes of eIF4GI-depleted cells. This increase in catabolic pathway components is likely a response to diminished nutrient sensing and mitochondrial activity. mRNAs encoding factors that participate in mitosis, particularly cytokinesis, were down-regulated in polysomes from eIF4GI-depleted cells. Altered cytokinesis with eIF4GI silencing was also reported previously (Coldwell and Morley, 2006). Interestingly, several pro-apoptotic mRNAs, including caspase 3 and Bid, were largely excluded from eIF4GI-depleted polysomes. When apoptosis is blocked, growth factor deprivation typically induces autophagy by preventing utilization of extracellular nutrients (Kundu and Thompson, 2005). The bioenergetic defects with eIF4GI silencing do not trigger apoptosis, but may promote cell death through autophagy. Conversely, mRNAs encoding several proteins involved in stress responses, including Hsp27, were increased in their polysomal association in eIF4GI-silenced cells.
The four clusters of mRNAs were examined for common 5′ and 3′ UTR elements that might play a role in their translation response to eIF4GI-depletion (Karolchik et al., 2004; Mignone et al., 2005; Huang et al., 2006). The 5′ UTR of mRNAs that decreased in polysomal association with eIF4GI silencing tended to be longer than those that are up-regulated (Table I). Although this trend is not statistically significant, mRNAs that decreased in polysomal association with eIF4GI silencing have a higher mean folding energy than those that increase in polysome association, suggesting that they are more highly structured (Fig. S5 C). Nevertheless, insertion of a stable hairpin in the 5′ UTR of a reporter mRNA did not further impair translation rates with eIF4GI silencing, demonstrating that increased secondary structure is not sufficient to impart an increased requirement for eIF4GI (Fig. S5 D).
Table I. Sequence features of mRNAs altered in polysomal association of eIF4GI-depleted cells.
| Decreased in eIF4GI-depleted polysomes |
Increased in eIF4GI-depleted polysomes |
|
|---|---|---|
| 5′ UTR | ||
| Average length | 213 | 162 |
| Range | 5–994 | 1–1,122 |
| Median | 172 | 102 |
| Longer than average (210) | 42.60% | 23.20% |
| 3′ UTR | ||
| Average length | 1,659 | 904 |
| Range | 98–5,443 | 15–7,486 |
| Median | 1,422 | 567 |
| Longer than average (740) | 79.30% | 38.70% |
| Number of mRNAs | 141 | 142 |
| % containing uORF | 42 | 20 |
| % ≥ 2 uORF | 26 | 7.7 |
| % containing GC-rich repeats | 21 | 6.2 |
Interestingly, the 3′ UTR of mRNAs down-regulated in polysomes from eIF4GI-silenced cells were longer than those that are up-regulated, suggesting the involvement of sequences or structural elements (Table I). Of note, the 3′ UTR of certain plant RNA viruses binds specifically to eIF4GI and the mRNA 5′ UTR, providing a cap-independent bridge to the ribosome. The mRNAs reduced in polysomes by depletion of eIF4GI are twice as likely to contain upstream ORFs (uORFs) in their 5′ UTRs (Skp2 mRNA contains two uORFs) (Table I). Because eIF4GI is necessary for translation reinitiation following an upstream ORF in vitro (Poyry et al., 2003), we examined the effect of uORFs on mRNA translation in eIF4GI-depleted cells. A bicistronic reporter mRNA was expressed in which the cap-dependent ORF was under the control of a wild-type 5′ UTR fragment of MDA-7 that contains three uORFs, or a mutant MDA-7 5′ UTR that harbors AUG to UUG mutations to eliminate the uORFs (Fig. 6 D). The wild-type 5′ UTR decreased translation by almost half in control cells and 80% in eIF4GI-depleted cells, in contrast to DAP5 depletion, which did not further decrease translation of the uORF-mRNA (Fig. 6 D). Similar results were obtained with a monocistronic firefly luciferase mRNA (Fig. S5, A and D). An upstream ORF in the wild-type PPP3CB 5′ UTR did not reduce translation in control cells compared with the non-ORF 5′ UTR, but did so by ∼60% in eIF4GI-silenced cells (Fig. S5, normalized for equal mRNA). Similar results were obtained with the 5′ UTR of the UBE4A mRNA (unpublished data).
The uORF-mediated suppression of mRNA translation in eIF4GI-silenced cells could be prevented by overexpression of the uORF-containing mRNA (Fig. S5 B). We therefore re-ranked the mRNAs in our microarray analysis based on total mRNA abundance, then segregated these mRNAs into abundance quartiles ranging over several hundred fold. We evaluated the percentage of eIF4GI-dependent mRNAs (clusters 1 and 2, 165 genes) that classify to each quartile (Table II). Remarkably, 54% of mRNAs decreased in polysomes with eIF4GI silencing belong to the lowest abundance quartile, whereas only 9.7% belong to the highest abundance quartile (total adds to slightly more than 100% due to multiple targets for the same mRNA in the microarray). Moreover, 92% of the mRNAs containing uORFs belong to the two lower abundance quartiles (Q3 and Q4). These data indicate that an important previously unrecognized function of eIF4GI is to promote selective translation of low abundance mRNAs.
Table II. Comparison of total mRNA abundance and polysomal decrease in eIF4GI-depleted cells (clusters 1 and 2).
| Intensity quartile | Percentage of mRNAs from clusters 1 and 2 |
Number of targets |
|---|---|---|
| Q1 (398 targets) | 9.7 | 16/165 |
| Q2 (398 targets) | 15 | 24/165 |
| Q3 (398 targets) | 28 | 46/165 |
| Q4 (400 targets) | 54 | 90/165 |
Q1, highest intensity; Q4, lowest intensity.
Discussion
In budding yeast, eIF4G is present at sub-stoichiometric concentrations compared with ribosomes (von der Haar and McCarthy, 2002), and nutritional deprivation triggers translational down-regulation and decreased levels of eIF4G (Berset et al., 1998). Our results indicate that although an artificially low level of eIF4GI is not greatly limiting for translation of most mRNAs, high levels are essential for the strong translation of a subset of mRNAs whose products are involved in regulation of mitochondrial activity, cellular bioenergetics, and cellular proliferation. It was also noted by others that eIF4GI silencing only partially diminishes protein synthesis rates (Coldwell and Morley, 2006). How does protein synthesis take place with such low levels of eIF4GI in silenced cells? Importantly, we find that even a moderate decrease in the levels of members of the eIF3 complex results in a significant reduction in overall protein synthesis rates. It has been reported that eIF3 can promote the association of mRNA with ribosomes in the absence of eIF4GI in yeast (Jivotovskaya et al., 2006), suggesting that eIF4G may act after 40S ribosome subunit association with mRNA, and is not necessary for ribosome scanning on unstructured mRNAs in vitro (Pestova and Kolupaeva, 2002). Thus, translation initiation might proceed on many mRNAs through an alternate mechanism that involves little requirement for eIF4GI. Additionally, our results with eIF4GI and DAP5 co-silencing add to the growing evidence that different eIF4G family members might promote translation of overlapping and distinct groups of mRNAs (Lee and McCormick, 2006; Baker and Fuller, 2007; Franklin-Dumont et al., 2007).
It is striking that polysome association of mRNAs encoding regulators of nutrient utilization and mitochondrial regulation were decreased in eIF4GI-silenced cells, including AKT3 (glucose homeostasis), AKAP10 and ARALAR (signaling to mitochondria) (Wang et al., 2001; Brozinick et al., 2003), as well as mRNAs encoding mitochondrial ribosomal proteins, which is also consistent with the regulation of eIF4GI levels and activity in response to cellular nutrition and growth factor status. Because activated AMPK inhibits the mTOR pathway by directly phosphorylating TSC2, an inhibitor of the mTOR-activating factor Rheb (Inoki et al., 2003; Connolly et al., 2006), the bioenergetic alterations resulting from mitochondrial dysfunction in eIF4GI-silenced cells likely act in a feedback loop to down-regulate mTOR activity, thereby promoting a nutrient deprivation phenotype.
As has been previously shown, deprivation of growth factor signaling, when coupled with an inability to undergo apoptosis, leads to starvation, withdrawal from the cell cycle, and autophagy, despite the abundance of extracellular nutrients (Lum et al., 2005). eIF4GI-silenced cells display all of these characteristics, particularly an inability to sense nutrients and maintain bioenergetics (i.e., mitochondrial dysfunction and AMPK activation), but without undergoing apoptosis, which is likely due to decreased translation of pro-apoptotic factor mRNAs. The reduced proliferation rate of eIF4GI-silenced cells can likely be accounted for by the decrease in polysome association of key transcription factors and kinases involved in cell cycle regulation (see DNA microarray data section of Materials and methods), including Skp2 (Fig. 5). In addition, reduction of mitogenic signals and decreased mTOR signaling lead to withdrawal from the cell cycle (Lum et al., 2005). Supporting our findings, eIF4GI was recently identified in a high-throughput screen as a factor that regulates cell size and cell cycle progression (Bjorklund et al., 2006). In fact, eIF4GI was categorized as a member of a “signaling” network that includes raptor, a crucial component of the mTORC1 signaling pathway, which we showed here to interact with and to phosphorylate eIF4GI in vitro. eIF4GI silencing in that screen led to increased G1 content and decreased cell size, observed in our study as well. The finding that eIF4GI abundance is responsive to mTORC1 signaling and similarities between mTOR pathway inhibition and eIF4GI silencing suggests that the PI3K/AKT/mTOR axis communicates with eIF4GI during nutrient sensing to control bioenergetics. Of note, eIF4GI silencing increases p27 stability and abundance, as has been noted in mTORC1 inhibited cells (Nourse et al., 1994). In the lower metazoan C. elegans, nutritional deprivation, TOR, and eIF4G silencing all lead to remarkably similar phenotypes (Long et al., 2002).
Our findings also suggest the intriguing possibility that the eIF4G family of factors might favor translation of partially distinct classes of mRNAs. For instance, eIF4GII or Paip1 silencing does not result in metabolic disturbances. Indeed, it has been proposed that eIF4GII is regulated during differentiation by Ca2+/calmodulin-dependent protein kinase I (CaMKI) and may selectively translate developmental mRNAs (Qin et al., 2003; Caron et al., 2004). Although the depletion of DAP5 similarly decreases translation rates (∼30%) as observed with eIF4GI depletion, only some of the metabolic alterations associated with eIF4GI depletion are apparent in DAP5-depleted cells (Lee and McCormick, 2006). Further, our results show that DAP5 silencing does not specifically decrease translation of uORF-containing mRNAs, unlike eIF4GI depletion, nor does it substitute for eIF4GI to promote cell proliferation. A newly cloned testis-specific eIF4G homologue in Drosophila is necessary for spermatogenesis but superfluous for overall protein synthesis in other tissues (Baker and Fuller, 2007; Franklin-Dumont et al., 2007), consistent with differential functions of eIF4G family members.
Fig. 7 outlines the control of translation by the mTOR signaling network and places our results in the context of known and potential regulatory components of the eIF4G family. In summary, the phenotypic similarities of eIF4GI silencing and mTORC1 inhibition described here indicate that eIF4GI is an essential factor of the nutrient-sensing pathway. These data also suggest that the function of overexpressed eIF4GI in tumors may involve suppression of autophagy-mediated cell death.
Figure 7.

eIF4GI in the context of mTORC1 and other eIF4G family members. mTORC1 signaling regulates cellular growth at various levels, including increasing anabolic processes (ribosome biogenesis and increased protein synthesis), and preventing catabolic processes such as autophagy and fatty acid oxidation. mTORC1 controls translation through the well-known factors 4E-BPs and S6K. eIF4GI total and phosphorylated levels increase in response to mTORC1 activity. eIF4GI modulates translation of low abundance, uORF-containing mRNAs such as Skp2, promoting decreased levels of p27 and therefore proliferation, as well as preventing autophagy. DAP5 and eIF4GI are both required to maintain overall protein synthesis rates, and silencing results in autophagy. Whether DAP5 is also controlled by mTOR is not known. Both DAP5 and eIF4GI are thought to participate in cap-independent translation during apoptosis. eIF4GII silencing does not alter global translation rates, and it may instead participate in translational reprogramming during differentiation.
Materials and methods
Cell culture and cell cycle distribution
All chemicals were from Sigma-Aldrich unless otherwise noted. LY294004 and rapamycin were from Calbiochem. HeLa, 293T, and 293GP cells were cultured in DMEM (Cellgro) containing 10% bovine calf serum (Gemini). MCF10A cells were cultured in Ham's F12 medium (Cellgro) supplemented with 5% horse serum (Invitrogen), 2 mM glutamine (BioWhittaker), 20 ng/ml EGF (Invitrogen), 100 ng/ml cholera toxin (Calbiochem), 0.01 mg/ml bovine insulin (Invitrogen), and 500 ng/ml hydrocortisone. Leucine-free MCF10A medium and leucine were custom ordered (Specialty Media). Cell proliferation was assessed by plating 100,000 cells in six-well plates, performing siRNA transfection, and at the indicated times cells were trypsinized and counted in a Coulter counter (Beckman Coulter). Where indicated, growth rates were measured as an exponential trend of the growth curve. For cell cycle distribution analysis, treated MCF10A cells at similar densities were trypsinized, ethanol fixed, and labeled with 200 mg/ml propidium iodide in 38 mM sodium citrate in the presence of RNaseA. DNA histograms were acquired using a FACSCalibur flow cytometer (Becton Dickinson) and analyzed using ModFit LT (Ventry Software). Inhibition of the proteasome was achieved by treatment with 10 μM MGI32 for 6 h.
Membrane potential assay, autophagy induction, and MDC labeling
Mitochondrial membrane potential was measured by incubating control or eIF4GI-silenced cells for 30 min with 50 nM of tetramethyl rhodamine ethyl ester (TMRE; Invitrogen) followed by FACS analysis. Autophagy was induced by amino acid starvation. Indicated cells were washed three times with PBS and incubated in HBSS for 30 min at 37°C. Autophagic vacuoles in starved or siRNA-transfected MCF10A cells were labeled by incubation with 0.05 mM MDC (Invitrogen) in PBS at 37°C for 10 min (Biederbick et al., 1995). Cells were washed three times with PBS and lysed in buffer containing 0.1% Triton X-100 and 10 mM Tris-HCl, pH 8. Incorporated MDC was measured by fluorescence photometry (excitation wavelength 380 nm, emission filter 525 nm) in a FluoroCount microplate reader, and normalized to DNA levels.
Confocal microscopy studies
After treatment, cells were seeded into 6-well plates with coverslips and grown for 24 h to ∼70% confluency. After three PBS washes, cells were fixed in 4% paraformaldehyde (Electron Microscopy Sciences) in PBS for 10 min at 25°C. Fixed cells were washed once with PBS and permeabilized in 0.25% Triton in PBS for 10 min at 25°C, washed with PBS and blocked in 10% BSA in PBS for 1 h at 25°C. GFP-LC3 transfected or transduced cells were washed and mounted onto slides. For antibody staining for fluorescence microscopy, cells were incubated with 100 μl of primary antibody in 3% BSA in PBS (1:100 affinity-purified eIF4GI antiserum and 1:100 mouse monoclonal β-tubulin [BD Biosciences], or 1:100 rabbit anti-β-actin [AbCam] antibody) overnight in a humidified chamber at 4°C. After three PBS washes, cells were incubated with secondary antibody in 3% BSA in PBS (1:100 FITC-conjugated donkey anti–rabbit and 1:100 TRITC-conjugated donkey anti–mouse; Jackson ImmunoResearch Laboratories) at 25°C for 1 h. Coverslips were mounted on slides using Vectashield mounting medium with propidium iodide (Vector Laboratories). Confocal immunofluorescence microscopy and image acquisition were performed at room temperature using a confocal scanning laser microscope (LSM 510 META; Carl Zeiss, Inc.) using an oil immersion Plan Apochromat 1.4 NA 63x objective. The laser scan head is equipped with a META detector (multi-channel broad spectrum photomultiplier tube arrays) and two additional single photomultipliers that assemble the images pixel by pixel using Lasersharp 2000 software (Carl Zeiss, Inc.) and converted into JPEG files, pseudo-colored, and merged for image processing with Photoshop 7 software.
Metabolic labeling of cells and preparation of extracts
Cells were pulse-labeled for 30 min with 10 μCi of [35S]-methionine and cysteine mix per ml (Easytag Express Protein Labeling Mix; PerkinElmer) in DMEM without methionine and cysteine containing 2% dialyzed FBS. After treatment, cells were washed twice in ice-cold 1x PBS and lysed in ice-cold buffer A (0.5% igepal [vol/vol], 150 mM NaCl, 50 mM Hepes, pH 7.0, 2 mM Na3VO4, 25 mM β-glycerophosphate, and complete protease inhibitor mix; Roche). Debris was removed by centrifugation at 4°C for 10 min and the supernatants were stored at −80°C. Protein concentrations were determined by the Bradford method (Bio-Rad Laboratories). Specific activity was determined by trichloroacetic acid precipitation and liquid scintillation. For immunoprecipitation of 35S-labeled proteins, cells were labeled in Easytag mix as described above for 2 h, lysed in buffer A, and sonicated with four pulses of 5 s each. For determination of LC3, KLF4, and MYCBP levels, cells were lysed in RIPA buffer (1% igepal, 0.5% deoxycholate, 0.1% SDS, 150 mM NaCl, 50 mM Tris, pH 8.0, 2 mM Na3VO4, 25 mM β-glycerophosphate, and complete protease inhibitor mix; Roche) and protein concentrations were determined using the DC Protein Assay kit (Bio-Rad Laboratories).
Polysome gradients, RNA extraction, and microarray analysis
48 h after siRNA transfection, MCF10A cells were seeded in 15-cm plates and harvested at 50% confluency (three plates per condition). Cells were treated with 100 μg/ml cycloheximide (Calbiochem) in complete medium for 5 min at 37°C, collected in ice cold PBS supplemented with complete protease inhibitor without EDTA (Roche) and 100 μg/ml cycloheximide. All subsequent steps were performed at 4°C. Cells were washed twice in PBS with 100 μg/ml cycloheximide, pelleted, and resuspended in 700 μl polysome isolation buffer (200 mM Tris, pH 7.5, 100 mM NaCl, and 30 mM MgCl2). After 5 min incubation, 250 μl detergent buffer (1.2% Triton, 0.2 M sucrose in polysome isolation buffer) was added and cells were lysed with a dounce homogenizer with 10 strokes. Lysates were clarified by centrifugation at 13,000 g for 10 min at 4°C and supernatants were transferred to new tubes containing 100 μl heparin buffer (10 mg/ml heparin [Sigma-Aldrich], 1.5 M NaCl in polysome isolation buffer). Samples were layered onto 11-ml 10–50% sucrose (Sigma-Aldrich) gradients (in polysome extraction buffer supplemented with 100 μg/ml cycloheximide), sedimented at 36,000 rpm for 2 h in a SW40 rotor (Beckman Coulter) at 4°C. Gradients were collected as 15 × 750 μl fractions by pumping 60% sucrose into the bottom of the gradient and collecting from the top using an ISCO fraction collector while simultaneously monitoring absorbance at 254 nm. 30 μl of 0.5M EDTA were added to each fraction, RNA was isolated by extraction with phenol/chloroform followed by chloroform extraction, and precipitated overnight with 1 volume isopropanol and 0.1 volume NaOAc (pH 5.2) at −20°C. Fractions were centrifuged at 13,000 g for 10 min to collect the RNA, washed twice with 70% EtOH, and resuspended in 100 μl nuclease-free water. Fractions 6–12, representing polysomes, were combined and extracted twice with phenol and twice with chloroform, followed by isopropanol precipitation. 10 μg of pooled RNA were used for microarray analysis using the one-cycle cDNA synthesis GeneChip kit and hybridized to GeneChip Human Genome U133A 2.0 chips, both from Affymetrix, according to the manufacturer's instructions. For normalization, total RNA was extracted from cells using Trizol and further purified through RNeasy mini-elute columns (QIAGEN). RNA quantity and quality were determined using a bioanalyzer (Agilent Technologies), and samples were stored in nuclease-free water at −80°C. mRNA targets with splice variants that alter 5′ and 3′ UTRs were omitted from the UTR analyses.
MTT proliferation assay
Cell growth was measured by a standard MTT Cell Proliferation Assay. In brief, cells infected with shRNA-expressing lentiviruses and selected with puromycin and/or G418S were plated in quadruplicate (per time point) in 96-well format and subsequently quantified four times over a course of 72 h. Wells were treated with 20% sterile-filtered 5 mg/ml MTT (Sigma-Aldrich) in DMEM over 6 h at 37°C. The reduced formazan was then solubilized in a 1:1 DMF/20% SDS solution overnight. Colorimetric quantification was performed with a TECAN Sunrise microplate reader at an OD of 570 nm, with a negative reference at 450 nm. Relative growth rates were determined from the first-order logarithmic regression analysis of the colorimetric change over time per cell line (P < 0.01). Results were normalized to the nonsilencing shRNA control cell line.
DNA constructs, transfections, transductions, and luciferase assays
Plasmid pEGFP-LC3 was from T. Yoshimori (National Institute for Basic Biology, Okazaki, Japan). 293T cells were transfected by the CaPO4 method. pBabe-AcGFP-LC3 was generated by subcloning the LC3 fragment from EGFP-LC3 into the BglII and EcoRI sites of pAcGFP1-C1 (BD Biosciences), and further subcloning it from the SnaBI and SalI sites of AcGFP1-C1 to those same sites in pBABE-puro. The pRL-HCV-IRES-FL plasmid (Tischendorf et al., 2004) was a gift from M. Krüger (Medizinische Hochschule Hannover, Hannover, Germany). Duplexed oligos spanning bases 17 to 105 of the 5′ UTR of mda-7/IL24 with our without uORFs (wild-type or AUG to UUG mutants) were purchased from Integrated DNA Technologies and ligated into the EcoRV site of the pRL-HCV-IRES-FL plasmid. pCMVLuc was generated by insertion of HindIII–XbaI fragment coding for luciferase from pSP-luc+ (Promega) into the same sites of pcDNA3.1 (Invitrogen). Duplexed oligos spanning the entire 5′ UTR of PPP3CB with our without uORFs (wild-type or AUG to UUG mutants) were ligated into blunt-ended HindIII-cut pCMVluc. Constructs were verified by DNA sequencing. pRhifF and pstemRhifF were provided by G. Goodall (Institute of Medical and Veterinary Science, Adelaide, Australia). The indicated concentrations of plasmids were transfected into MCF10A cells in 6-cm dishes at ∼50% confluency 48 h after siRNA transfection using Fugene (Roche). Luciferase assays were performed 24 h later using either Firefly Luciferase or Dual Luciferase Reporter Assay Systems (Promega). HA-GST-p85 S6K1 pRK5 was from D.M. Sabatini (Whitehead Institute, Cambridge, MA; Addgene plasmid 8466). pSP4GI was a gift of R. Lloyd (Baylor College of Medicine, Houston, TX). The eIF4GI primers were used to amplify eIF4GIc (the nomenclature of Byrd et al. [2002]). The amplified product was cloned into pcDNA3.1/myc-His (Invitrogen) using the introduced XhoI and HindIII sites to generate myc-His-eIF4GI. pCAN-myc-DAP5 was a gift of F. McCormick (University of California, San Francisco, San Francisco, CA). This plasmid was used to amplify the DAP5 ORF which was cloned into pBMN-I-GFP (gift of G. Nolan, Stanford University, Stanford, CA) to generate pBMN-DAP5-I-GFP. MCF10A cells were transduced in the presence of polybrene (4 μg/ml) with viruses generated by cotransfection of either pBABE-AcGFP-LC3 or pBMN-DAP5-I-GFP and pCMV-VSVG into 293GP cells (gift of M. Pagano, NYU School of Medicine), which were harvested 72 and 96 h after transfection. 72 h after transduction, AcGPF-LC3 cells were selected with 2 μg/ml puromycin (InvivoGen). DAP5-expressing cells were enriched by sorting for GFP-positive cells 1 wk after transduction.
Measurement of ATP levels
ATP levels were measured by the luciferin/luciferase method using the ATP Bioluminescence Assay kit HS II, according to the instructions of the manufacturer (Roche). Luciferase reagent (25 μl) was injected into 100 μl of lysate from equal numbers of cells (105), and the luminescence was analyzed after a 1-s delay with a 1-s integration on an LMax Luminometer (MDS Analytical Technologies). A standard curve was generated from known concentrations of ATP and used to calculate the concentration of ATP in each sample. Luminescence increased linearly with the negative log of the ATP concentration in the samples over the range of concentrations measured.
shRNAs, antibodies, and mTOR kinase assays
For the siRNA experiments, 21 nucleotide complementary RNAs with 2 nucleotide overhangs were synthesized (QIAGEN) to the following regions: bases 3587–3607 and 5183–5203 of eIF4GI (GenBank/EMBL/DDBJ accession no. AY082886), bases 5068–5088 of eIF4GII (AF012072), 2856–2876 of eIF3S8 (BC001571), 2015–2035 of eIF3S1 (NM_003758), 3510–3530 of DAP5 (NM_001418), 1744–1764 of Paip1 (NM_006451), and 1542–1562 of eIF4E (NM_001968). Control siRNAs (GFP and nonsilencing) were also from QIAGEN. Unless otherwise noted, cells were grown to 40% confluency and transfected twice 24 h apart with 5.6 μg siRNA per 10-cm plate using oligofectamine reagent (Invitrogen) according to the manufacturer's instructions. For lentivirus expression of shRNAs, target sequences were inserted into pLKO.1 (Stewart et al., 2003). For raptor silencing we used pLKO.1 raptor_1 (D.M. Sabatini; Addgene plasmid 1857 [Sarbassov et al., 2005]). To produce virus containing the shRNA-generating cassette, 293GP cells were transfected with 4 μg each of pCI-VSV-G, pCMVΔ8.2R', and pLK0.1 with Fugene reagent (Roche; plasmids were a gift of Dr. Weinberg, Whitehead Institute). Target cells were infected in the presence of polybrene (4 μg/ml) and selected with puromycin at 2.0 μg/ml for 72 h. For double silencing using the lentivirus system, the puromycin resistance cassette in pLK0.1 was substituted with that for neomycin. Cells infected with this vector were selected with 800 μg/ml G418S.
The following antibodies were used: rabbit anti-eIF4GI C terminus, 1:500 dilution (Schneider laboratory); rabbit anti-eIF4GI N terminus, 1:1,000 (gift of R. Lloyd, Baylor College of Medicine); rabbit anti-eIF4GII and rabbit anti-Paip1, both at 1:1,000 (gifts of N. Sonenberg, McGill University, Montreal, Canada); monoclonal anti-eIF4A, 1:1,000 (gift of W. Merrick, Case Western Reserve University, Cleveland, OH); rabbit anti-LC3, 1:1,000 (gift of T. Yoshimori, National Institute for Basic Biology, Okazaki, Japan); mouse anti-eIF4E, 1:1,000, mouse anti-DAP5 1:500 (BD Transduction Laboratories); rabbit anti-DAP5, 1:1,000 (gift of M. Holcik, Children's Hospital of Eastern Ontario Research Institute); rabbit anti-PABP, 1:2,000, rabbit anti-eIF3S8, 1:15,000, rabbit anti-KLF4 1:500 (AbCam); rabbit anti-eIF3S1, 1:800 (Proteintech Group); rabbit anti-eIF4G, rabbit anti-phospho eIF4G (S1108), rabbit anti-mTOR, rabbit anti-raptor, rabbit anti-phospho S6K1 (T389), rabbit anti-S6K1, rabbit anti-S6, rabbit anti-phospho S6 (S240/244), rabbit anti-4E-BP1, rabbit anti-phospho-AMPKα (T172), rabbit anti-AMPKα, rabbit monoclonal anti-caspase-3, all at 1:1,000 (Cell Signaling Technology); goat anti-Hsp27, 1:1,000 (Santa Cruz Biotechnology, Inc.); rabbit anti-MYCBP, 1:2,000 (AVIVA Systems Biology); mouse anti-β-tubulin, 1:2,000 (BD Biosciences); mouse anti-Skp2, 1:500 (Zymed Laboratories); mouse anti-HA, 1:1,000 (Covance); mouse anti-myc, 1:1,000 (Roche). HRP-labeled goat anti–rabbit and anti–mouse secondary antibodies were used at 1:10,000 dilution (GE Healthcare). Samples were separated by SDS-PAGE and transferred to PVDF membranes (Millipore). The enhanced chemiluminescence (ECL; GE Healthcare) procedure was used to detect protein signals. For cap-affinity chromatography, 500 μg of lysate were combined with 30 μl of m7GTP-Sepharose (GE Healthcare). Affinity purifications were performed for 3 h at 4°C with rotation.
For immunoprecipitation, mouse anti-Skp2 antibody (Zymed Laboratories) and goat anti-Dap5 (Santa Cruz Biotechnology, Inc.) were used at 1:50; mouse anti-HA at 1:150 (Covance); rabbit anti-myc at 1:250 (AbCam); and rabbit anti mTOR at 1:100 (Cell Signaling Technology). 30 uL of Protein A/G-agarose slurry were used for each immunoprecipitation (Santa Cruz Biotechnology, Inc.). Kinase assays were performed essentially as described, with modifications (Kim et al., 2002). 293T cells were transfected with HA GST S6K1 or myc-His-eIF4GI plasmids and 24 h later incubated with 10 μM LY294002 and 100 nM rapamycin for 12 h. For mTOR immunoprecipitation, MCF10A cells were lysed in buffer B (40 mM Hepes, pH 7.4, 120 mM NaCl, 1 mM EDTA, and 0.3% CHAPS) supplemented with complete protease inhibitor tablet (Roche) and 1x Halt Phosphatase Inhibitor Cocktail (Thermo Fisher Scientific). Lysates were clarified by centrifugation at 0.8 g for 10 min. After preclearing, 500 μg of MCF10A lysate were immunoprecipitated with mTOR antibody and protein A/G-agarose slurry. Treated 293T cells expressing either S6K1 or eIF4GIc were lysed in Buffer A, and immunoprecipitated with either HA or myc antibodies and protein A/G-agarose slurry. Captured immunoprecipitates were washed in their respective buffers three times, then washed two more times in buffer B without EDTA. mTOR immunoprecipitates were combined with either S6K1 or eIF4GI immunocomplexes and incubated with 40 μl of kinase buffer (25 mM Hepes-KOH, pH 7.4, 50 mM KCl, 20% Glycerol, 10 mM MgCl2, 4 mM MnCl2, 1 mM DTT, and 500 μM ATP) for 15 min at 37°C. The reaction was stopped by addition of 10 μl 6x SDS-loading buffer and proteins were separated by SDS-PAGE followed by immunoblot. Quantification of bands was performed by densitometry using QuantityOne software (Bio-Rad Laboratories).
Quantitative RT-PCR
RNA was extracted using Trizol (Invitrogen), and in the case of luciferase reactions, DNase treated using Turbo DNA-free kit (Ambion). Single step qRT-PCR reactions were performed using SYBR Green Quantitative RT-PCR kit (Sigma-Aldrich) in a Lightcycler (Roche) according to manufacturer's instructions. Primer pair sequences used are available upon request. mRNA changes were quantified using the ΔΔCt method using β-actin mRNA as control (Winer et al., 1999). For qRT-PCR analysis of light and heavy polysomes, fractions were pooled into unbound mRNA and subunits (1–4), monosomes and light (5–8), and heavy (9–12) polysomal pools. Virtually no RNA was amplifiable in the first pool, so comparisons were made between light and heavy polysomes only, normalized to β-actin and setting the sum of mRNA in the two pools to 100%.
Ribosome half-transit time measurements
Measurement of ribosome half-transit time was performed as described, with modifications (Ruvinsky et al., 2005; Sivan et al., 2007). Equal number of control or eIF4GI-silenced cells were resuspended in 2 ml labeling medium supplemented with 5% dialyzed FBS and 10 μCi of [35S]-methionine and cysteine mix per ml. At the indicated times, 0.25 ml aliquots were mixed with 1.75 ml ice-cold PBS with 100 μg/ml cycloheximide. Cells were lysed in ribosome buffer (20 mM Hepes [KOH], pH 7.2, 10 mM NaCl, 3 mM MgCl2, 0.5% Igepal, 0.1 mM DTT, 100 μg/ml cycloheximide, and protease inhibitor cocktail) for 20 min, nuclei and mitochondria were pelleted by centrifugation at 4°C, maximum speed for 10 min. 50% of this post-mitochondrial supernatant (PMS) was depleted of ribosomes through ultracentrifugation at 100,000 g for 20 min at 4°C to generate post-ribosomal supernatant (PRS). Incorporated radioactivity was measured in equal aliquots of PMS and PRS samples, and the ribosome half-transit time was determined as the displacement in time of the PMS (total protein) and PRS (released protein) linear regression trends.
DNA microarray data
The DNA array analysis was performed at the NYU Cancer Institute Genomics Facility. Samples were processed in triplicate for each experimental condition. The preparation of cRNA probes and hybridization to GeneChip HGU133A 2.0 arrays followed the recommendations of the manufacturer (Affymetrix). Raw data were normalized by model-based expression index algorithm using dChip (Li and Wong, 2001) filtered on presence/absence calls using GeneSpring software version 7.2 (Silicon Genetics/Agilent). Differentially abundant mRNAs were identified in a cross-validation approach using TM4 analysis software (Saeed et al., 2003) by combining t test with P value cut-off of 0.05 and/or SAM (Tusher et al., 2001) with false discovery rate (FDR) set to 5%. The complete set of microarray data was deposited for public access to the NCBI Gene Expression Omnibus database under the accession number GSE11011.
Online supplemental material
Fig. S1 shows that eIF4GI silencing was sustained and in most cells. Fig. S2 demonstrates that eIF4GI silencing does not strongly decrease protein synthesis in primary and highly transformed cells, despite disassembly of eIF4F complexes, and can be rapidly recovered after hypoxia or hypertonic stresses that inhibit initiation and elongation. Fig. S3 demonstrates that ribosome transit time on mRNAs is not significantly altered by eIF4GI silencing. Fig. S4 shows effects of silencing different eIF4G family members on protein synthesis and cellular proliferation rates. Fig. S5 provides evidence that eIF4GI silencing particularly impairs translation of mRNAs containing uORFs. Online supplemental material is available at http://www.jcb.org/cgi/content/full/jcb.200710215/DC1.
Supplementary Material
Acknowledgments
We thank the NYU Cancer Institute Genomics Facility for expert technical assistance with GeneChip array experiments and data analysis. Special thanks to Deborah Silvera, Manisha Narasimhan, and members of the laboratory for critical reading of the manuscript.
This work was supported by grants from the Breast Cancer Research Foundation, the Department of Defense Breast Cancer Research Program, and the National Institutes of Health (NIH) to S.C. Formenti and R.J. Schneider; and the American Cancer Society to S.C. Formenti. F. Ramírez-Valle was supported by NIH grant GM60428. We thank Adam Volini for technical support, Stavros Giannakopoulos for advice with confocal microscopy, and Navid Sadri for aid with Flow Cytometry.
Abbreviations used in this paper: 4E-BP1, eIF4E binding protein 1; IRES, internal ribosome entry site; MDC, monodansylcadaverine; mTOR, mammalian target of rapamycin; uORF, upstream ORF.
References
- Ali, I.K., L. McKendrick, S.J. Morley, and R.J. Jackson. 2001. Truncated initiation factor eIF4G lacking an eIF4E binding site can support capped mRNA translation. EMBO J. 20:4233–4242. [DOI] [PMC free article] [PubMed] [Google Scholar]
- Baker, C.C., and M.T. Fuller. 2007. Translational control of meiotic cell cycle progression and spermatid differentiation in male germ cells by a novel eIF4G homolog. Development. 134:2863–2869. [DOI] [PMC free article] [PubMed] [Google Scholar]
- Berset, C., H. Trachsel, and M. Altmann. 1998. The TOR (target of rapamycin) signal transduction pathway regulates the stability of translation initiation factor eIF4G in the yeast Saccharomyces cerevisiae. Proc. Natl. Acad. Sci. USA. 95:4264–4269. [DOI] [PMC free article] [PubMed] [Google Scholar]
- Biederbick, A., H.F. Kern, and H.P. Elsasser. 1995. Monodansylcadaverine (MDC) is a specific in vivo marker for autophagic vacuoles. Eur. J. Cell Biol. 66:3–14. [PubMed] [Google Scholar]
- Bjorklund, M., M. Taipale, M. Varjosalo, J. Saharinen, J. Lahdenpera, and J. Taipale. 2006. Identification of pathways regulating cell size and cell-cycle progression by RNAi. Nature. 439:1009–1013. [DOI] [PubMed] [Google Scholar]
- Bovee, M.L., B.J. Lamphear, R.E. Rhoads, and R.E. Lloyd. 1998. Direct cleavage of elF4G by poliovirus 2A protease is inefficient in vitro. Virology. 245:241–249. [DOI] [PubMed] [Google Scholar]
- Braunstein, S., K. Karpisheva, C. Pola, J. Cangiarella, J. Goldberg, B. Singh, S. Formenti, and R.J. Schneider. 2007. A hypoxia controlled cap-dependent to cap-independent translation switch in breast cancer. Mol. Cell. 28:501–512. [DOI] [PubMed] [Google Scholar]
- Brozinick, J.T. Jr., B.R. Roberts, and G.L. Dohm. 2003. Defective signaling through Akt-2 and -3 but not Akt-1 in insulin-resistant human skeletal muscle: potential role in insulin resistance. Diabetes. 52:935–941. [DOI] [PubMed] [Google Scholar]
- Byrd, M.P., M. Zamora, and R.E. Lloyd. 2002. Generation of multiple isoforms of eukaryotic translation initiation factor 4GI by use of alternate translation initiation codons. Mol. Cell. Biol. 22:4499–4511. [DOI] [PMC free article] [PubMed] [Google Scholar]
- Caron, S., M. Charon, E. Cramer, N. Sonenberg, and I. Dusanter-Fourt. 2004. Selective modification of eukaryotic initiation factor 4F (eIF4F) at the onset of cell differentiation: recruitment of eIF4GII and long-lasting phosphorylation of eIF4E. Mol. Cell. Biol. 24:4920–4928. [DOI] [PMC free article] [PubMed] [Google Scholar]
- Coldwell, M.J., and S.J. Morley. 2006. Specific isoforms of translation initiation factor 4GI show differences in translational activity. Mol. Cell. Biol. 26:8448–8460. [DOI] [PMC free article] [PubMed] [Google Scholar]
- Connolly, E., S. Braunstein, S. Formenti, and R.J. Schneider. 2006. Hypoxia inhibits protein synthesis through a 4E-BP1 and elongation factor 2 kinase pathway controlled by mTOR and uncoupled in breast cancer cells. Mol. Cell. Biol. 26:3955–3965. [DOI] [PMC free article] [PubMed] [Google Scholar]
- Constantinou, C., and M.J. Clemens. 2007. Regulation of translation factors eIF4GI and 4E-BP1 during recovery of protein synthesis from inhibition by p53. Cell Death Differ. 14:576–585. [DOI] [PubMed] [Google Scholar]
- Craig, A.W., A. Haghighat, A.T. Yu, and N. Sonenberg. 1998. Interaction of polyadenylate-binding protein with the eIF4G homologue PAIP enhances translation. Nature. 392:520–523. [DOI] [PubMed] [Google Scholar]
- Cully, M., H. You, A.J. Levine, and T.W. Mak. 2006. Beyond PTEN mutations: the PI3K pathway as an integrator of multiple inputs during tumorigenesis. Nat. Rev. Cancer. 6:184–192. [DOI] [PubMed] [Google Scholar]
- Deberardinis, R.J., J.J. Lum, and C.B. Thompson. 2006. Phosphatidylinositol 3-kinase-dependent modulation of carnitine palmitoyltransferase 1A expression regulates lipid metabolism during hematopoietic cell growth. J. Biol. Chem. 281:37372–37380. [DOI] [PubMed] [Google Scholar]
- Franklin-Dumont, T.M., C. Chatterjee, S.A. Wasserman, and S. Dinardo. 2007. A novel eIF4G homolog, Off-schedule, couples translational control to meiosis and differentiation in Drosophila spermatocytes. Development. 134:2851–2861. [DOI] [PubMed] [Google Scholar]
- Fukuchi-Shimogori, T., I. Ishii, K. Kashiwagi, H. Mashiba, H. Ekimoto, and K. Igarashi. 1997. Malignant transformation by overproduction of translation initiation factor eIF4G. Cancer Res. 57:5041–5044. [PubMed] [Google Scholar]
- Gingras, A.C., S.G. Kennedy, M.A. O'Leary, N. Sonenberg, and N. Hay. 1998. 4E-BP1, a repressor of mRNA translation, is phosphorylated and inactivated by the Akt(PKB) signaling pathway. Genes Dev. 12:502–513. [DOI] [PMC free article] [PubMed] [Google Scholar]
- Goyer, C., M. Altmann, H.S. Lee, A. Blanc, M. Deshmukh, J.L. Woolford Jr., H. Trachsel, and N. Sonenberg. 1993. TIF4631 and TIF4632: two yeast genes encoding the high-molecular-weight subunits of the cap-binding protein complex (eukaryotic initiation factor 4F) contain an RNA recognition motif-like sequence and carry out an essential function. Mol. Cell. Biol. 13:4860–4874. [DOI] [PMC free article] [PubMed] [Google Scholar]
- Guertin, D.A., D.M. Stevens, C.C. Thoreen, A.A. Burds, N.Y. Kalaany, J. Moffat, M. Brown, K.J. Fitzgerald, and D.M. Sabatini. 2006. Ablation in mice of the mTORC components raptor, rictor, or mLST8 reveals that mTORC2 is required for signaling to Akt-FOXO and PKCalpha, but not S6K1. Dev. Cell. 11:859–871. [DOI] [PubMed] [Google Scholar]
- Holcik, M., and N. Sonenberg. 2005. Translational control in stress and apoptosis. Nat. Rev. Mol. Cell Biol. 6:318–327. [DOI] [PubMed] [Google Scholar]
- Huang, H.Y., C.H. Chien, K.H. Jen, and H.D. Huang. 2006. RegRNA: an integrated web server for identifying regulatory RNA motifs and elements. Nucleic Acids Res. 34:W429-W434. [DOI] [PMC free article] [PubMed] [Google Scholar]
- Inoki, K., T. Zhu, and K.L. Guan. 2003. TSC2 mediates cellular energy response to control cell growth and survival. Cell. 115:577–590. [DOI] [PubMed] [Google Scholar]
- Jivotovskaya, A.V., L. Valasek, A.G. Hinnebusch, and K.H. Nielsen. 2006. Eukaryotic translation initiation factor 3 (eIF3) and eIF2 can promote mRNA binding to 40S subunits independently of eIF4G in yeast. Mol. Cell. Biol. 26:1355–1372. [DOI] [PMC free article] [PubMed] [Google Scholar]
- Kabeya, Y., N. Mizushima, T. Ueno, A. Yamamoto, T. Kirisako, T. Noda, E. Kominami, Y. Ohsumi, and T. Yoshimori. 2000. LC3, a mammalian homologue of yeast Apg8p, is localized in autophagosome membranes after processing. EMBO J. 19:5720–5728. [DOI] [PMC free article] [PubMed] [Google Scholar]
- Karolchik, D., A.S. Hinrichs, T.S. Furey, K.M. Roskin, C.W. Sugnet, D. Haussler, and W.J. Kent. 2004. The UCSC Table Browser data retrieval tool. Nucleic Acids Res. 32:D493–D496. [DOI] [PMC free article] [PubMed] [Google Scholar]
- Kim, D.H., D.D. Sarbassov, S.M. Ali, J.E. King, R.R. Latek, H. Erdjument-Bromage, P. Tempst, and D.M. Sabatini. 2002. mTOR interacts with raptor to form a nutrient-sensitive complex that signals to the cell growth machinery. Cell. 110:163–175. [DOI] [PubMed] [Google Scholar]
- Kundu, M., and C.B. Thompson. 2005. Macroautophagy versus mitochondrial autophagy: a question of fate? Cell Death Differ. 12(Suppl. 2):1484–1489. [DOI] [PubMed] [Google Scholar]
- Lee, S.H., and F. McCormick. 2006. p97/DAP5 is a ribosome-associated factor that facilitates protein synthesis and cell proliferation by modulating the synthesis of cell cycle proteins. EMBO J. 25:4008–4019. [DOI] [PMC free article] [PubMed] [Google Scholar]
- Li, C., and W.H. Wong. 2001. Model-based analysis of oligonucleotide arrays: expression index computation and outlier detection. Proc. Natl. Acad. Sci. USA. 98:31–36. [DOI] [PMC free article] [PubMed] [Google Scholar]
- Long, X., C. Spycher, Z.S. Han, A.M. Rose, F. Muller, and J. Avruch. 2002. TOR deficiency in C. elegans causes developmental arrest and intestinal atrophy by inhibition of mRNA translation. Curr. Biol. 12:1448–1461. [DOI] [PubMed] [Google Scholar]
- Lum, J.J., D.E. Bauer, M. Kong, M.H. Harris, C. Li, T. Lindsten, and C.B. Thompson. 2005. Growth factor regulation of autophagy and cell survival in the absence of apoptosis. Cell. 120:237–248. [DOI] [PubMed] [Google Scholar]
- Marissen, W.E., and R.E. Lloyd. 1998. Eukaryotic translation initiation factor 4G is targeted for proteolytic cleavage by caspase 3 during inhibition of translation in apoptotic cells. Mol. Cell. Biol. 18:7565–7574. [DOI] [PMC free article] [PubMed] [Google Scholar]
- Mignone, F., G. Grillo, F. Licciulli, M. Iacono, S. Liuni, P.J. Kersey, J. Duarte, C. Saccone, and G. Pesole. 2005. UTRdb and UTRsite: a collection of sequences and regulatory motifs of the untranslated regions of eukaryotic mRNAs. Nucleic Acids Res. 33:D141–D146. [DOI] [PMC free article] [PubMed] [Google Scholar]
- Mizushima, N., and T. Yoshimori. 2007. How to interpret LC3 immunoblotting. Autophagy. 3:542–545. [DOI] [PubMed] [Google Scholar]
- Nobukuni, T., S.C. Kozma, and G. Thomas. 2007. hvps34, an ancient player, enters a growing game: mTOR complex1/S6K1 signaling. Curr. Opin. Cell Biol. 19:135–141. [DOI] [PubMed] [Google Scholar]
- Nourse, J., E. Firpo, W.M. Flanagan, S. Coats, K. Polyak, M.H. Lee, J. Massague, G.R. Crabtree, and J.M. Roberts. 1994. Interleukin-2-mediated elimination of the p27Kip1 cyclin-dependent kinase inhibitor prevented by rapamycin. Nature. 372:570–573. [DOI] [PubMed] [Google Scholar]
- Nousch, M., V. Reed, R.J. Bryson-Richardson, P.D. Currie, and T. Preiss. 2007. The eIF4G-homolog p97 can activate translation independent of caspase cleavage. RNA. 13:374–384. [DOI] [PMC free article] [PubMed] [Google Scholar]
- Pagano, M. 2004. Control of DNA synthesis and mitosis by the Skp2-p27-Cdk1/2 axis. Mol. Cell. 14:414–416. [DOI] [PubMed] [Google Scholar]
- Pestova, T.V., and V.G. Kolupaeva. 2002. The roles of individual eukaryotic translation initiation factors in ribosomal scanning and initiation codon selection. Genes Dev. 16:2906–2922. [DOI] [PMC free article] [PubMed] [Google Scholar]
- Poyry, T.A., A. Kaminski, and R.J. Jackson. 2003. What determines whether mammalian ribosomes resume scanning after translation of a short upstream open reading frame? Genes Dev. 18:62–75. [DOI] [PMC free article] [PubMed] [Google Scholar]
- Pyronnet, S., H. Imataka, A.C. Gingras, R. Fukunaga, T. Hunter, and N. Sonenberg. 1999. Human eukaryotic translation initiation factor 4G (eIF4G) recruits mnk1 to phosphorylate eIF4E. EMBO J. 18:270–279. [DOI] [PMC free article] [PubMed] [Google Scholar]
- Qin, H., B. Raught, N. Sonenberg, E.G. Goldstein, and A.M. Edelman. 2003. Phosphorylation screening identifies translational initiation factor 4GII as an intracellular target of Ca(2+)/calmodulin-dependent protein kinase I. J. Biol. Chem. 278:48570–48579. [DOI] [PubMed] [Google Scholar]
- Raught, B., A.C. Gingras, S.P. Gygi, H. Imataka, S. Morino, A. Gradi, R. Aebersold, and N. Sonenberg. 2000. Serum-stimulated, rapamycin-sensitive phosphorylation sites in the eukaryotic translation initiation factor 4GI. EMBO J. 19:434–444. [DOI] [PMC free article] [PubMed] [Google Scholar]
- Rowland, B.D., and D.S. Peeper. 2006. KLF4, p21 and context-dependent opposing forces in cancer. Nat. Rev. Cancer. 6:11–23. [DOI] [PubMed] [Google Scholar]
- Ruvinsky, I., N. Sharon, T. Lerer, H. Cohen, M. Stolovich-Rain, T. Nir, Y. Dor, P. Zisman, and O. Meyuhas. 2005. Ribosomal protein S6 phosphorylation is a determinant of cell size and glucose homeostasis. Genes Dev. 19:2199–2211. [DOI] [PMC free article] [PubMed] [Google Scholar]
- Saeed, A.I., V. Sharov, J. White, J. Li, W. Liang, N. Bhagabati, J. Braisted, M. Klapa, T. Currier, M. Thiagarajan, et al. 2003. TM4: a free, open-source system for microarray data management and analysis. Biotechniques. 34:374–378. [DOI] [PubMed] [Google Scholar]
- Sarbassov, D.D., S.M. Ali, and D.M. Sabatini. 2005. Growing roles for the mTOR pathway. Curr. Opin. Cell Biol. 17:596–603. [DOI] [PubMed] [Google Scholar]
- Schieke, S.M., and T. Finkel. 2006. Mitochondrial signaling, TOR, and life span. Biol. Chem. 387:1357–1361. [DOI] [PubMed] [Google Scholar]
- Schneider, R.J., and N. Sonenberg. 2007. Translational control in cancer development and progression. In Translational Control in Biology and Medicine. M.B. Mathews, N. Sonenberg, and J.W.B. Hershey, editors. Cold Spring Harbor Laboratory Press, Cold Spring Harbor, NY. 401–432.
- Sivan, G., N. Kedersha, and O. Elroy-Stein. 2007. Ribosomal slowdown mediates translational arrest during cellular division. Mol. Cell. Biol. 27:6639–6646. [DOI] [PMC free article] [PubMed] [Google Scholar]
- Stewart, S.A., D.M. Dykxhoorn, D. Palliser, H. Mizuno, E.Y. Yu, D.S. An, D.M. Sabatini, I.S. Chen, W.C. Hahn, P.A. Sharp, et al. 2003. Lentivirus-delivered stable gene silencing by RNAi in primary cells. RNA. 9:493–501. [DOI] [PMC free article] [PubMed] [Google Scholar]
- Svitkin, Y.V., B. Herdy, M. Costa-Mattioli, A.C. Gingras, B. Raught, and N. Sonenberg. 2005. Eukaryotic translation initiation factor 4E availability controls the switch between cap-dependent and internal ribosomal entry site-mediated translation. Mol. Cell. Biol. 25:10556–10565. [DOI] [PMC free article] [PubMed] [Google Scholar]
- Tischendorf, J.J., C. Beger, M. Korf, M.P. Manns, and M. Kruger. 2004. Polypyrimidine tract-binding protein (PTB) inhibits Hepatitis C virus internal ribosome entry site (HCV IRES)-mediated translation, but does not affect HCV replication. Arch. Virol. 149:1955–1970. [DOI] [PubMed] [Google Scholar]
- Tusher, V.G., R. Tibshirani, and G. Chu. 2001. Significance analysis of microarrays applied to the ionizing radiation response. Proc. Natl. Acad. Sci. USA. 98:5116–5121. [DOI] [PMC free article] [PubMed] [Google Scholar]
- Vary, T.C., G. Deiter, and C.J. Lynch. 2007. Rapamycin limits formation of active eukaryotic initiation factor 4F complex following meal feeding in rat hearts. J. Nutr. 137:1857–1862. [DOI] [PubMed] [Google Scholar]
- von der Haar, T., and J.E. McCarthy. 2002. Intracellular translation initiation factor levels in Saccharomyces cerevisiae and their role in cap-complex function. Mol. Microbiol. 46:531–544. [DOI] [PubMed] [Google Scholar]
- Wang, L., R.K. Sunahara, A. Krumins, G. Perkins, M.L. Crochiere, M. Mackey, S. Bell, M.H. Ellisman, and S.S. Taylor. 2001. Cloning and mitochondrial localization of full-length D-AKAP2, a protein kinase A anchoring protein. Proc. Natl. Acad. Sci. USA. 98:3220–3225. [DOI] [PMC free article] [PubMed] [Google Scholar]
- Winer, J., C.K. Jung, I. Shackel, and P.M. Williams. 1999. Development and validation of real-time quantitative reverse transcriptase-polymerase chain reaction for monitoring gene expression in cardiac myocytes in vitro. Anal. Biochem. 270:41–49. [DOI] [PubMed] [Google Scholar]
Associated Data
This section collects any data citations, data availability statements, or supplementary materials included in this article.
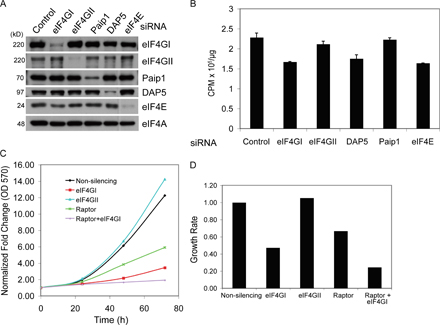