

Abstract
Trimers of the HIV-1 envelope glycoprotein (Env) effectuate viral entry into susceptible cells. Therefore Env trimers are the targets for neutralizing antibodies. This study models the number of trimers required for virion infectivity. It also delineates the minimum number of antibody molecules that would neutralize a virion. First, Env function was assumed to be incremental (all envelope-glycoprotein units contribute equally) or liminal (characterized by thresholds). Then, such models were combined and shown to fit published data on phenotypically mixed pseudotype viruses. Virions with 9 trimers would require around a median of 5 of them for strong infectivity; the proportion varies among strains and mutants. In addition, the models account for both liminal and incremental protomeric effects at the trimer level: Different inert Env mutants may affect trimer function in different degrees. Because of compensatory effects at the virion and trimer levels, however, current data cannot differentiate between all plausible models. But the biophysically and mathematically rationalized blurring of thresholds yields candidate models that fit different data excellently.
Keywords: HIV-1, entry, envelope glycoprotein, trimer, phenotypic mixing, neutralization, molecularity, occupancy
INTRODUCTION
How many envelope glycoprotein (Env) molecules does it take to render an HIV-1 particle infectious? The answer would inform anti-viral strategies.
HIV-1 Env consists of a surface moiety, SU, and a transmembrane protein, TM. These subunits form non-covalent hetero-dimers. Trimers of such hetero-dimers stud the virion. At the start of an infectious cycle, the trimers bind to the main receptor for the virus, CD4, on the target-cell surface. This binding induces conformational changes in the Env oligomer that promote interactions with a co-receptor, CCR5 or CXCR4 (for reviews, see (Moore and Doms, 2003; Poignard et al., 2001)). Then, as a consequence of these interactions, TM refolds into a coiled coil that fuses the viral and cellular membranes (Chan et al., 1997; Gallo et al., 2003; Matthews et al., 2004; Weissenhorn et al., 1997). Because of these functions, Env is the target for neutralizing antibodies (NAbs) (Poignard et al., 2001; Wyatt and Sodroski, 1998).
A specific tool now aids the quantitative analysis of Env-mediated entry: cells are transfected with genes for functional and defective forms of Env. Mixed trimers form in these cells and are eventually incorporated into virions. The infectivity of the resulting virus can be analyzed with combinatorial models. Analogously, one can model the infectivity of virus containing different proportions of antigenic and non-antigenic Env in the presence of an excess of NAbs. Such modeling has suggested that all three subunits must be unencumbered for the Env trimer to function (Herrera et al., 2006; Iwatani et al., 2001; Schonning et al., 1999; Yang et al., 2005a; Yang et al., 2005b).
Yang et al. drew further conclusions: that a single trimer is capable of mediating the infectivity of a virion; that therefore neutralization requires the occupancy of all functional trimers by NAbs (Yang et al., 2005a; Yang et al., 2005b). A single trimer per virion was also deemed sufficient for the infectivity of other retroviruses: amphotropic murine leukemia virus (A-MLV) and avian sarcoma/leucosis virus type A (ASLA-A) (Yang et al., 2005b). The authors furthermore posited that HIV-1 virions have only the bare minimum of trimers required for infection (Yang et al., 2005a; Yang et al., 2005b). They inferred this from the low ratio of infectious to total number of particles for HIV (ranging from ~10−2 to ~10−5) (Bourinbaiar, 1994; Dimitrov et al., 1993; Klasse and McKeating, 1993; Layne et al., 1992). On this view, retroviral particles usually only have a single functional trimer, which is exactly what they require for entry into target cells.
More recently, Yang et al. analyzed the effects on infectivity of incorporating Env with mutations in the CD4-binding site, in the chemokine-receptor-binding site or in the fusion segment of TM. Again, they came to the conclusion that a single trimer mediates the infectivity of a virion. But they concluded that with these Env defects, a trimer can tolerate one mutant protomer and still have intact function (Yang et al., 2006a).
The following mathematical modeling delineates alternative hypotheses. In order to model, we must make assumptions about Env and virions. First, we must explore how the three subunits in a trimer may contribute to its function. Secondly, we must assume that virions have a certain number of trimers, e.g. about 9–14 (Zhu et al., 2003; Zhu et al., 2006) or a wider range. Thirdly, we must ask how many trimers are required for infectivity.
In order to analyze the number of NAbs per virion involved in neutralization, a previous framework postulated thresholds above which the virions are inactivated (Klasse and Moore, 1996). An empirical study of neutralization was unable to refute such thresholds (Schonning et al., 1999). As a viable alternative, however, that study promulgated proportionally incremental effects of the binding of NAbs to Env. The data thus sustained principally different hypotheses of how infectivity varied with the amount of NAb bound.
In the current modeling, these two accounts of infectivity are explored further. On the one hand there is the possibility of thresholds, or liminal effects: the infectivity of a virion depends on a critical number of functional trimers, below which it is completely inert. On the other hand, there may be incremental effects: each Env unit contributes independently to the infectivity of a virion. It makes biological sense to blend these two accounts. What is more, the resulting mixed models closely fit distinct sets of data on phenotypically mixed pseudotype virus. Several of the best-fitting models suggest that different virions need around half of their trimers for strong infectivity.
But this modeling remains tentative for several reasons. The premises cannot yet be anchored in definitive knowledge about infectious virions. The problems are complex and the data scant and imprecise. Numerous variants of principally distinct models can be derived. Some mathematical functions can have more than one biological interpretation. Rivaling models may be empirically indistinguishable. Nevertheless, published data refute vast arrays of models.
RESULTS
The modeling was performed in five steps:
The mathematical models of Env function were derived. These apply to virions with randomly mixed active and inert Env protomers. Combinatorial analysis was applied at two levels, the trimer and the virion. This yielded a basic framework for liminal and incremental models.
The available data on phenotypically mixed virus (Herrera et al., 2006; Yang et al., 2005a; Yang et al., 2005b; Yang et al., 2006a) were contrasted with the basic liminal and incremental models. The models generally diverged substantially from the data.
As a prelude to optimal model design, the proximity of the data to an incremental extreme or a liminal alternative was explored. For the latter, the number of trimers per virion, as well as the number of trimers at the threshold of inhibition, was varied. Some mixed models along the spectra fit better than pure ones.
Virion heterogeneity and incremental effects were taken into account by allotting differential, gradual weights to thresholds. Such softening of the thresholds brought the models closer to the data.
Incremental effects were allowed also at the trimer level. The resulting mixed liminal-incremental models suggested variable effects on trimer function among mutants. Nevertheless, the first inert protomer in a trimer maintined a strong effect in different models that best fit all the data sets.
1. The basic models of infectivity as a function of active Env
The infectivity of phenotypically mixed virions is normalized against that of virions with purely functional Env protomers. The models express the relative infectivity, I, on the y axis and the proportion of functional Env protomers, p, on the x axis (see Table 1 for all symbols).
Table 1.
Symbols of quantities and parameters(I)
| I | The average relative infectivity of a virion |
| p | The probability that a protomer is functional |
| q | The probability that a trimer is functional |
| C,r,R,P,N | Standard symbols in combinatorial and probability analysis; the number of ways of combining r objects out of N is expressed as NCr=N!/(r!(N−r)!). P(R) is the probability of R. (This R is unrelated to the R2 that is a measure of the goodness of fits.) |
| n | The number of trimers per virion. For virions with mixed Env, n is the number of functional trimers plus the number trimers that are inactive because of incorporation of inert Env. Thus n does not include spontaneously inactived trimers. |
| S | Number of non-functional protomers that inactivate a trimer |
| L | Number of non-functional trimers that inactivate a virion |
| T | Minimum number of functional trimers a virion requires for infectivity |
| a | Parameter allotting weight to liminal or incremental component in a model spectrum at the level of the virion. Constrained as 0≤a≤1; the greater the value of a, the more weight given to the incremental component |
| c | Coefficient allotting weight to a particular threshold, i.e., a value of L in a gradual liminal model |
| b | Parameter given various exponents (z=[0,1,2,3]) that give optimal values to the coefficients for each respective threshold; constrained to b≥1 |
| h | Parameter giving weight to protomeric contributions to trimer function along the spectrum from S=1 to proportionally incremental effects of protomers, 0≤h≤1; the greater the value of h, the more weight given to the incremental protomeric component |
Since the current modeling is more comprehensive and complex than that in (Herrera et al., 2006), and in order to maximize consistency with the rest of the literature, some of these symbols differ from those in that reference or signify quantities that are not found there.
S is the minimal number of non-functional protomers required to inactivate a trimer (Figure 1A). S=1 means that a single non-functional Env protomer renders the whole trimer inert. Then the functional fraction of trimers, q, is p3.
Figure 1. Absolute-liminal models at both the trimer and the virion level.
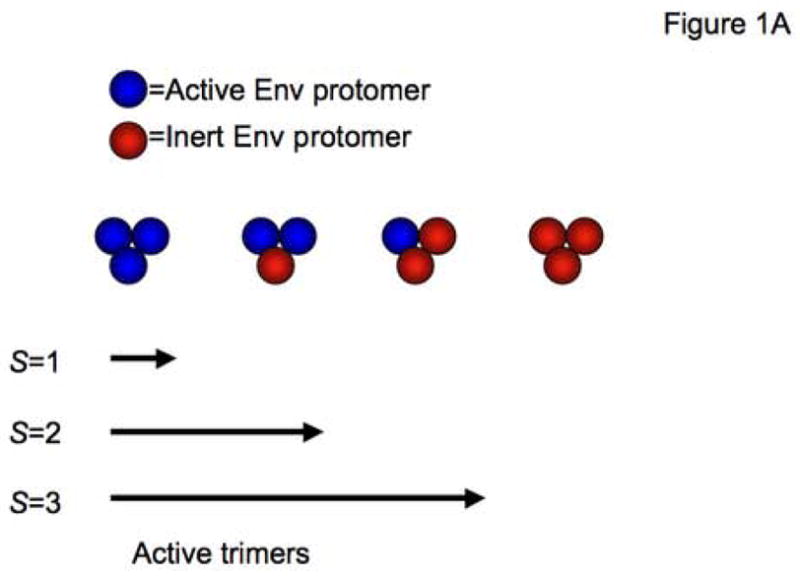

A. The cartoon illustrates an all-or-nothing model of Env function. Env trimers are represented as groups of three spheres, each sphere being either an active (blue) or an inert (red) SU-TM hetero-dimeric protomer. The array of four different trimers in the middle row of the figure illustrates all the possible combinations of active and inert protomers. Below, three different thresholds for inactivation of the trimer are stipulated. S=1 means that one inactive protomer is sufficient to knock out the function of a trimer completely; only homo-trimers consisting purely of active protomers are functional. When S=2, i.e. the threshold for trimer inactivation is two inert protomers, only trimers with zero or one inactive subunit are functional. Finally, S=3 means that the only inactive trimers are those with three inert protomers; all the trimers with one or more active protomers are equally functional. Note that these models do not allow for any intermediate activity of mixed trimers.
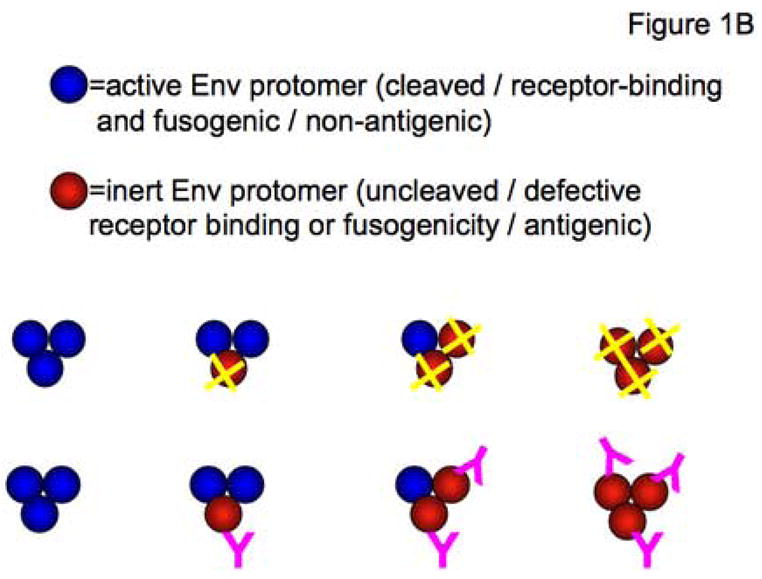
B. The cartoon illustrates that the same basic modeling applies to Env that is active or inert through different causes. In one situation, wild-type Env is active but mutant Env is defective in a vital function (red spheres with yellow crosses in the top row). Alternatively, wild-type Env is inactivated by the binding of NAbs (magenta Y shapes in lower row), which are present in excess. In this situation, the mutant Env is active because it contains amino-acid changes that prevent NAb binding while not compromising Env function.
C. Three kinds of trimers are shown on the surface of the two model virions. Blue trimers are active, whereas red trimers are rendered inactive because they contain inert protomers, as outlined in A and B. Grey trimers have been spontaneously inactivated over time by a constitutive process associated with decay of infectivity. Both model virions bear nine trimers (n) that have not undergone spontaneous inactivation. A threshold for virion inactivation of at least four inactive trimers is postulated; i.e. L=4. Thus the minimum number of active trimers a virion requires is set at six; i.e. T=6. The virion on the left, with seven functional trimers, is therefore infectious, whereas the virion on the right, which has only four functional trimers, is non-infectious.
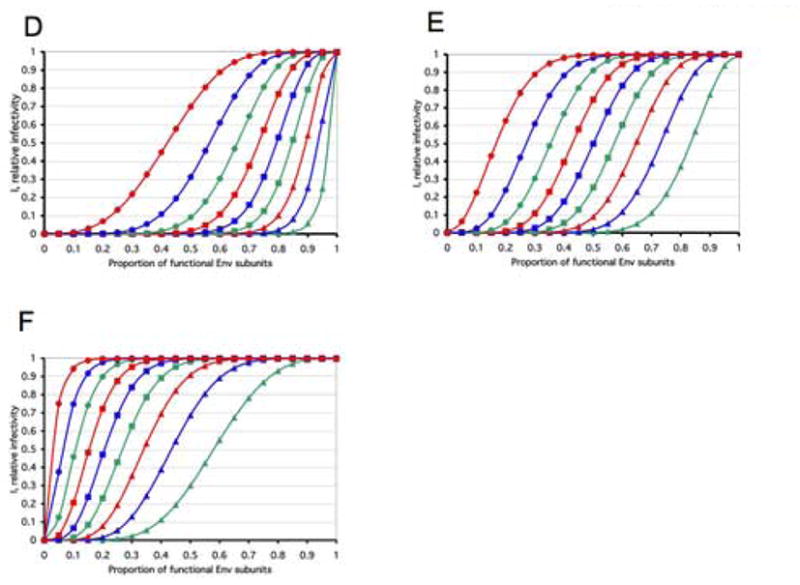
D–F. The total number of trimers per virion is assumed to be constant, n=9, an average that has been described empirically (Zhu et al., 2003). All possible discrete thresholds are illustrated: L, the minimal number of trimers that have to be inactivated for the virion to lose its infectivity, ranges from 1 to 9. The diagrams show the relative infectivity on the y-axis as a function of the relative amount of functional Env protein that was incorporated into the virions (x-axis). The graphs show the consequences of three different assumptions about trimer function: (D) one non-functional protomer per trimer is sufficient to inactivate it, S=1; (E) two non-functional protomers are required to inactivate a trimer, S=2; (F) three non-functional protomers in the trimer render it inert, S=3. In all three diagrams (D–F) L=1, green triangles; L=2, blue triangles; L=3, red triangles; L=4, green squares; L=5, blue squares; L=6, red squares; L=7, green circles; L=8, blue circles; L=9, red circles. It is apparent that the slopes of the curves for the same threshold at the virion level, L, vary drastically between different protomer thresholds at the trimer level, S: e.g., the three left-most (L=9) curves in the three diagrams D–F (S=1, 2 or 3), or the corresponding right-most (L=1) curves in the same three diagrams. Furthermore, when instead S=1 is kept constant, the slope of the middle of the curve flattens as one goes from L=1 to L=9 (D); for S=2, there is more of a parallel shift (E), and for S=3, the slope instead becomes steeper as L increases (F). It is also apparent that the ranges of the curves overlap widely.
For S=2, the fraction of functional trimers is q=3p2−2p3. For S=3, q=3p−3p2+p3 (see Figure 1A for illustration and Methods for derivations).
The goal is a general framework for the analysis of HIV-1 with randomly mixed functional and non-functional Env protomers. Here “functional” can mean different things. It can be the absence of mutations that abrogate the Env-mediated entry process. Conversely, when neutralization is modeled, “non-functional Env” means wild-type Env that is completely occupied by a NAb present in excess (Figure 1B). It also deserves emphasis that randomness, or independence of the individual combinatorial events, is a central premise when the binomial theorem is applied. Any deviation from independence invalidates the straightforward interpretation of the best fits of binomial-derived functions. There are strong indications that different versions of HIV Env protomers do hetero-trimerize: the dominant negative effect of defective Env is best explained if wild-type and defective Env hetero-trimerize (Iwatani et al., 2001; Yang et al., 2005b). Immunoprecipitations indicate that hetero-trimers form in cells co-transfected with two forms of Env (Salzwedel and Berger, 2000), but it cannot be entirely ruled out that contiguous trimers that have co-localized to imperfectly solubilized fragments of phospholipid bilayer are immunoprecipitated together (Herrera et al., 2006). But evidence for hetero-trimers does not equate evidence for independence. The latter has been obtained for influenza HA trimerization: when sufficiently similar HA protomers oligomerize, the relative frequency of hetero-trimers conforms with the predicted binomial distribution (Boulay et al., 1988). In contrast, HIV-1 and -2 Env co-expression gives rarer hetero-trimer formation than independence would predict. It can be argued but not proven that the combinations of the more similar forms of Env that are analyzed here have a correspondingly weaker tendency to favor homo-oligomerization. But the point is that any deviation from random trimerization can lead to spurious inferences from binomial analyses. This caveat deserves to be re-entered and mathematically explicated at the two levels of analysis: the trimer and the virion.
We call the total number of potentially functional trimers per virion n. If we postulate a threshold, L (Figure 1C), of the number of trimers that must be inactivated for the virion to lose infectivity, the fraction of infectious virions, i.e., the relative infectivity will be:
| Eq. 1 |
(see Table 2 and Methods). Conversely, we let T be the minimum number of functional trimers required for infection. Initially, we postulate n=9. This value is the average total number that has been described for HIV-1 (Zhu et al., 2003). But it could also be viewed as a realistic number of functional trimers for virions with a higher total number of trimers, some of which have decayed spontaneously (cf. (Briggs et al., 2004; Chertova et al., 2002; Poignard et al., 2003; Zhu et al., 2006).
Table 2.
General definitions and equations of pure liminal and incremental models at the virion level
Figure 1D–F illustrates these different possibilities of absolute requirements at the trimer and virion levels. Obviously, the relative infectivity at a certain value of p will be lower if one non-functional protomer knocks out the trimer (S=1, as in Figure 1D), than if trimer inactivation requires a greater number of protomers to be inert (S=2 or S=3, as in Figure 1E and F).
2. Comparison with data on phenotypically mixed virus
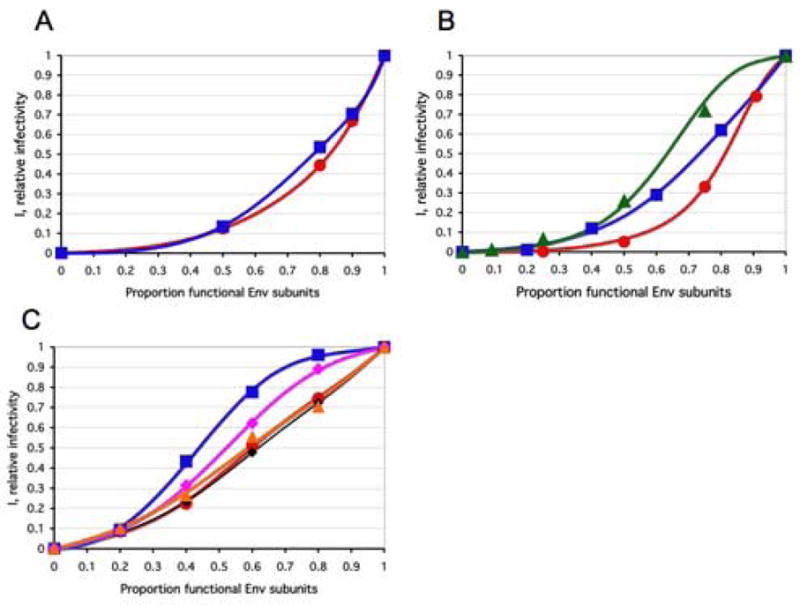
The relevant empirical studies have expressed infectivity and neutralization of phenotypically mixed viruses in disparate manners. In order to model all these data comparatively, they were converted here to a uniform format: relative infectivity on the y axis and the proportion of functional Env protomers on the x axis. Figure 2A shows pooled relative infectivities from two studies on viruses with mixed cleavage-competent and -defective Env (Herrera et al., 2006; Yang et al., 2005b). It also shows the mean relative infectivities of viruses bearing wild-type Env mixed with mutants defective in binding to CD4 or to coreceptors (Yang et al., 2006a). Furthermore, it shows the mean relative infectivities of virus with mixed antigenic and non-antigenic Env in the presence of NAbs (Yang et al., 2005a). Further details on the pooling and averaging of data are given in the legend to Figure 2A. In brief, since information about intra- and inter-experimental variation, as well as about biological variation between strains and NAbs, differs among the data sets, only one mean relative infectivity value (I) per relative Env-content value (p) has been used within each modeled data set. More definitive differentiation between models, with the theoretical uncertainty discussed here, would require fits based on a large number of replicates of each experimental condition and smaller incremental steps in p. The data from the earlier neutralization study (Schonning et al., 1999) are not included in this re-analysis because of the considerably greater experimental variation in that study. In each of the three categories of data (neutralization, cleavage defect and receptor-binding defect), curves are plotted separately for T-cell line-adapted viruses (TCLAs) and primary isolates (PIs).
Figure 2. Comparison of models and data phenotypically mixed virus.
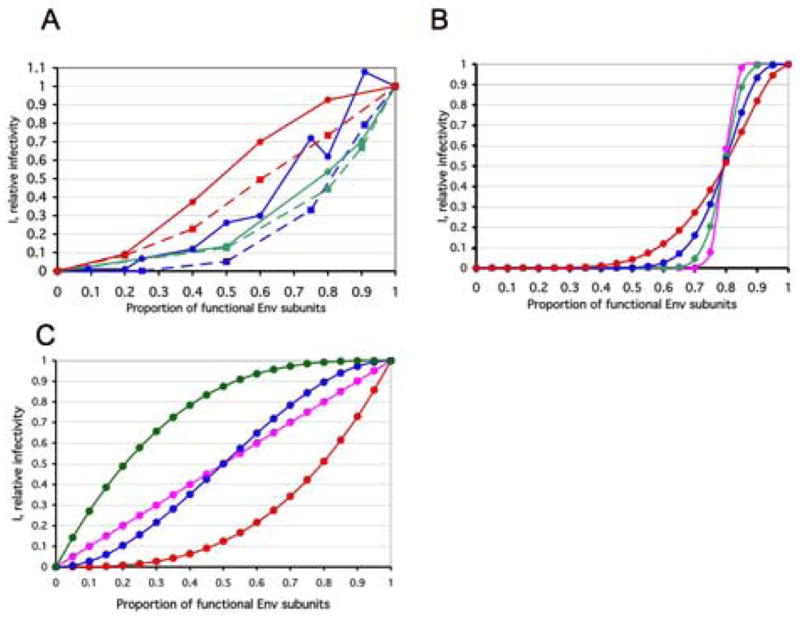
A. Data from four empirical studies were converted to a common format, for ease of comparison. All curves for PIs are continuous lines with circles; TCLA viruses are represented by stippled lines and squares. The data from two studies on phenotypically mixed cleavage-defective and cleavage-competent Env are represented by the blue curves; only data from experiments using Env with full-length cytoplasmic tails were included (Herrera et al., 2006; Yang et al., 2005b). The PI curve (blue continuous lines, circles) shows the pooling of data from the PIs YU2 (Yang et al., 2005b) and JR-FL (Herrera et al., 2006). (Neither a fusion-segment mutant (V513E) nor cytoplasmic-tail and matrix-protein mutants described in (Yang et al., 2005b) are included in the current re-analysis.) The data for the TCLA virus HXBc2 (Herrera et al., 2006) (blue stippled lines, squares) fall below. Two neutralization curves are shown in green (Yang et al., 2005a). The PI curve represents the mean of data for three strains and three NAbs (green continuous line, circles). The TCLA curve describes the mean of data on HXBc2 and 8 NAbs; it falls somewhat below (green stippled line, squares). The red curves show average data for viruses containing wild-type Env and Env with defects in receptor interactions (Yang et al., 2006a). The PI curve (red continuous line, circles) shows the mean of data for YU2 viruses containing Env with defects in either CD4 or CCR5 binding. The TCLA curve depicts the mean of data for HXBc2 viruses containing Env with defects in either CD4 or CXCR4 binding. Insufficient information is available to illustrate experimental variation or to separate it from biological variation. Data sets for some mutants and similar strains -- pooled here in order to indicate approximate trends -- were analyzed separately in the following.
B. The number of trimers per virion affects the slope of the curve
The diagrams show the relative infectivity on the y-axis as a function of the relative content of functional Env protein that is incorporated into the virions (x-axis). The steepness is determined by n, the number of functional trimers per virion at p=1: The absolute threshold, L, is assumed to be constantly the median, (n+1)/2, for four odd values of n from 3 to 81. In all four cases, one non-functional protomer per trimer is assumed sufficient for inactivating the trimer, i.e., S=1; n=3, L=2: red circles; n=9, L=5: blue circles; n=27, L=14: green circles; n=81, L=41: magenta circles.
C. Proportionally incremental models
Incremental models based on the assumption that virion infectivity is exactly proportional to trimer functionality are illustrated. They are independent of the value of n. The three special cases of protomeric thresholds at the trimer level, S=1 (red circles), S=2 (blue circles), S=3 (green circles) are illustrated. In addition, a protomeric incremental model, i.e., the absence of thresholds at both the trimer and virion levels, is shown (magenta circles). This function is also the average of those for S=1, S=2 and S=3. Mathematically, models of the extreme case of n=1 and T=1 will be identical to the incremental ones for S=1, S=2, S=3 here, but their interpretations and implications differ.
Some of the variation in the re-plotted data in Figure 2A is experimental, but some of it may reflect genuine differences between strains and mutants. The curves for TCLAs consistently fall below those for PIs. However, the differences between the three categories -- cleavage-defective Env, receptor-binding-defective Env and neutralization -- are also apparent. Even for the neutralization data, for which the PI-TCLA difference was the smallest, at p=0.80, the PI I values were significantly higher than the TCLA I values: representative single-experiment I values for 7 PI-NAb combinations (3 isolates and 2–3 NAbs) vs. 8 TCLA-Nab combinations (one isolate and 8 NAbs) (Yang et al., 2005a) (Mann-Whitney U test, one-tailed, in order answer whether the observed difference was significant, P=0.003). Although the NAbs were not the same in the two groups, this difference is compatible with a generally greater neutralization resistance of PIs than of TCLAs.
Cleavage-defective Env has been called dominant-negative because of its strong interfering effect (Herrera et al., 2006; Iwatani et al., 2001; Yang et al., 2005b). In contrast, CD4- and co-receptor-binding-site Env mutants seem to interfere less strongly with wild-type Env in the phenotypically mixed virus than does cleavage-defective Env, although the former Env mutants on their own confer no significant residual infectivity (Yang et al., 2006a). Furthermore, the curves for the neutralization data are lower than most of the others; this indicates that NAbs interfere with Env function more effectively than do some defective forms of Env. Finally, the theoretical curves in Figure 1 are noticeably steeper than the empirical ones in Figure 2A. Why do the models thus disagree with the data?
The total number of trimers per virion n affects the steepness of the theoretical curves. In Figure 2B, the relative value of the threshold at the level of the virion, L, is kept fixed at the median threshold (and S=1), while n is varied. As n goes from 3 to 81, the slope gets steeper and the similarity to the data decreases. Does this mean that the premise of a high n is wrong or are other aspects of the modeling responsible for the gap between theory and data? This is uncertain. On the one hand an infectious virion may have higher n than the average virion; on the other hand, n is the sum of active trimers and those that are inactive only because of incorporation of inert protomers; n does not include trimers that have undergone spontaneous inactivation. Thus n may represent only a fraction of the physically detectable trimers on a virion. Furthermore, it should be emphasized that any deviation from randomness, i.e. from the independence of the combinatorial events, towards a tendency for preferential homo-oligomerization, or for homogenous incorporation of trimers into virions, would flatten the curves; this could therefore also lead to spuriously low apparent n.
In general, closeness to the data is a problematic criterion for choosing between the models. It is impossible for the data to differentiate among the plethora of theoretical possibilities. The Supplement illustrates this problem of model redundancy.
If the fit is better the lower the value of n, there may be the temptation to conclude that virions usually only have one trimer, which is precisely what they require for infectivity (Yang et al., 2005a; Yang et al., 2005b; Yang et al., 2006a). Figure 2C shows the three curves for n=1, L=1, T=1 and S=[1,2,3]. However, the same mathematical functions correspond to a principally different kind of model as well: proportionally incremental effects of functional Env on infectivity, i.e. a complete absence of thresholds at the virion level. According to the incremental hypothesis, a virion with nine functional trimers has exactly nine times greater propensity to infect than one that has a single trimer. Yet another possibility is that each protomer contributes to the infectivity in a proportionally incremental manner. Such a protomer-incremental function is represented by the linear, diagonal curve in Figure 2C. That model stipulates no thresholds at either virion or trimer level.
But for now we assume S=1, as proposed (Herrera et al., 2006; Yang et al., 2005a; Yang et al., 2005b). We then explore a spectrum of models between an incremental and a liminal pole.
3. Fitting data on a spectrum between liminal and incremental models
As a rough adjudication between the two kinds of model, the simple incremental model
| Eq. 2 |
was compared consecutively with liminal models having different numbers of trimers per virion (n=[5,9,15,45]) and all possible thresholds, L, described by I=Σnr=(n-L+1)nCrqr(1-q)n−r (Eq. 1, Table 2). The closeness of the data to either kind of model was determined along the spectrum by fitting the parameter a in
| Eq. 3 |
where 0≤a≤1 (Table 1). A small value of a thus indicates closeness to a particular liminal model; a large value suggests proximity to the incremental alternative. In Figure 3, the parameter a, fit to the data (Herrera et al., 2006; Yang et al., 2005a; Yang et al., 2005b; Yang et al., 2006a), is plotted for each L. Only fits yielding R2>0.9 are displayed and the standard error of the non-linear regression indicates the uncertainty of the results. The rationale is not to find optimal modeling but to locate any zones of L values that make liminal models good competitors with the incremental one.
Figure 3. Closeness of data to models along liminal-incremental spectra.
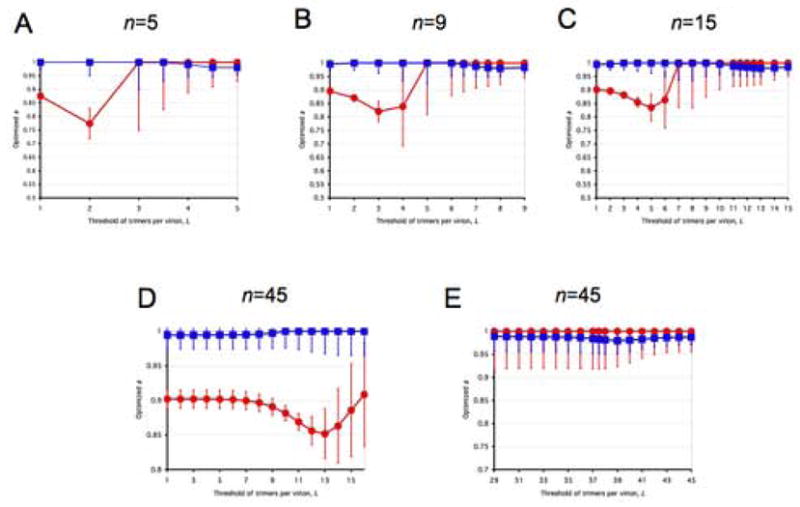
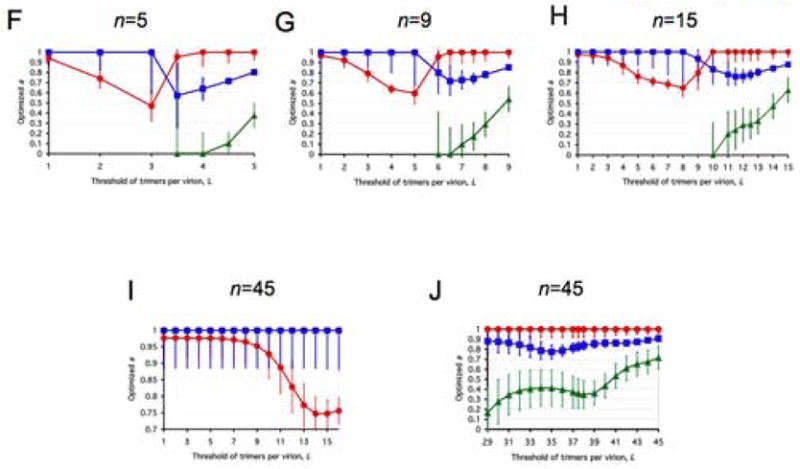
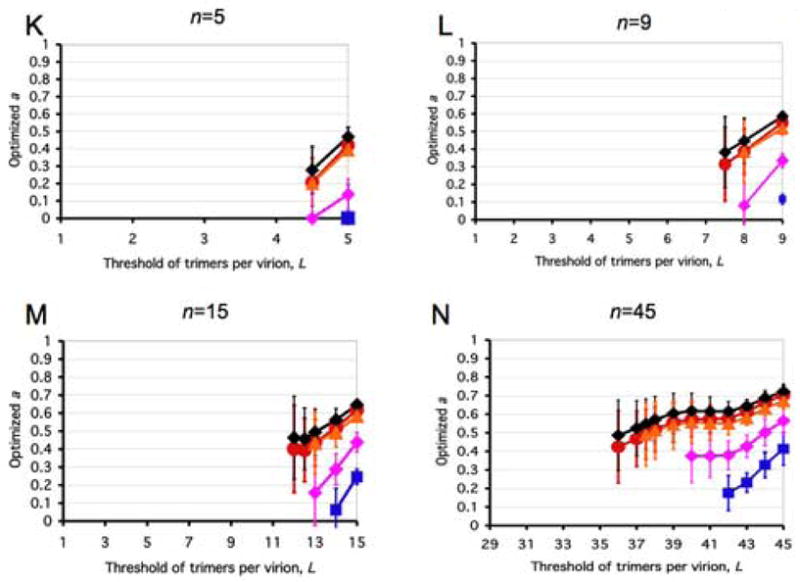
All panels represent spectra between one incremental and a variety of virion-level liminal models. Both the incremental and the liminal models have S=1 as a premise. Virions are postulated to have 5, 9, 15 or 45 potentially active trimers in total (n, marked above each diagram). The threshold of inactivation, L, in the liminal component of the model spectrum is depicted on the x-axis. On the y-axis, the value of the parameter a ± S.E.M, optimized by non-linear regression, is expressed for each value of L. The parameter a, constrained 0≤a≤1, gives the differential weights to the incremental and liminal components of the model spectra: the higher the value of a, the greater the incremental component; the lower the value of a, the greater the liminal component. Thus a minimum on the curve indicates the greatest proximity to the liminal function with that particular threshold. The R2 value corresponding to the minimum a value is invariably among the higher ones. But other adjacent thresholds, with a higher a, can sometimes give even higher R2 values. For some data (Yang et al., 2006a), the incremental and some liminal models fit so poorly that no good fit was found within the spectrum between them. Such a values giving R2 < 0.9 have not been plotted. Panels A–E show modeling of virus with mixed antigenic and non-antigenic Env in the presence of an excess of NAb (Yang et al., 2005a), the TCLA virus HXBc2 (mean of I for 8 NAbs, red circles) and the PIs YU2, ADA and KB9 (mean of pooled I for 2–3 NAbs, blue squares). Panels F–J show modeling of virus with mixed cleavage-defective and functional Env: the TCLA virus HXBc2 (Herrera et al., 2006) (red circles); the PI YU2 (Yang et al., 2005b) (blue squares) and the PI JR-FL (Herrera et al., 2006), green triangles. Panels K–N show viruses containing mixed mutant and wild-type Env, where the mutant is defective in CD4 binding, co-receptor interaction or gp41-fusion function (Yang et al., 2006a). The TCLA virus HXBc2 has varying proportions of Env defective in binding CD4 (red circles) or CXCR4 (black diamonds); the PIs have varying proportions of Env defective in binding CD4 (blue squares) or CCR5 (magenta diamonds) or in respect of the fusion function of gp41 (orange triangles).
A, F and K: n=5. B, G and L: n=9. C, H and M: n=15. D and I: n=45, the threshold L varied from 1 to 16. E, J and N: n=45, the threshold varied from 29 to 45.
The dips on the curves in Figure 3 indicate which threshold, L, brings the liminal model closest to the data. (In some cases mid-point thresholds between two adjacent values of L in a zone of minimal a have also been explored.) TCLA and PI viruses differ in all diagrams in Figure 3. The TCLAs tend to approach lower thresholds than the PIs.
Panels A–E in Figure 3 show data from neutralization experiments (Yang et al., 2005a). Deviations from the incremental model are small. And they are still smaller for the PI than for the TCLA. The preferred threshold for each is nevertheless nearly constant as a fraction of the varied total number of trimers, n: about 30% for the TCLA and 90% for the PI. (In addition minute deviations of a from 1 are observed at low L values for the PI.) This would make the TCLA more neutralization-sensitive than the PI, all other things being equal. Yet, of course, it does not exclude affinity as a dominant influence on neutralization sensitivity (Klasse and Moore, 1996; Yang et al., 2006b).
Panels F–J of Figure 3 model the same spectra between incremental and liminal extremes for data on wild-type Env mixed with cleavage-defective mutants (Herrera et al., 2006; Yang et al., 2005b). Again, the TCLA approximates lower thresholds than the PIs. The TCLA thresholds are 30–50% of n and the PI thresholds 70–80% of n. These data are close to the liminal end of the spectrum, particularly for the PI strain JR-FL. For example, a purely liminal model, S=1, n=5, L=4 and a=0, gave R2=0.9753. This is higher than that of the rigid model with S=1, n=1, T=1 proposed in (Yang et al., 2005b) and applied to the JR-FL data (Herrera et al., 2006): R2=0.8390.
Panels K–N of Figure 3 show that the receptor-binding and fusion-segment mutants (Yang et al., 2006a) differ from the others. In contrast to the mutants in Figure 3A–J, the L values at the a minima coincide for the TCLA and PI mutants, at about 80% of n. The mutants segregate in another way: TCLA CD4- and CXCR4-binding and the PI fusion-segment mutants generally fit well (R2 peaks > 0.99, not shown) on the spectrum and often better than to the proposed model (n=1, T=1, S=2 (Yang et al., 2006a)), although S=1 is here kept constant along the whole spectrum. Furthermore, the a minima for those three data sets are not as low as for the PI CD4- and CCR5-binding mutants. The latter two mutants tend closely towards the liminal pole but still fit poorly along the spectrum.
In conclusion, Figure 3 illustrates differences both among strains and mutants. It gives strong evidence for specific thresholds that are relatively constant as a proportion of the assumed total number of trimers, n. But it also shows that mixed liminal-incremental models can fit better than the simpler ones. In general, a was lower for the lower values of n, as expected from how n affects the steepness of the curves and thus the proximity to the data (Figure 2B).
4. Gradual thresholds
Env trimers mediate a chain of events that culminate in the release of the viral core into the cytoplasm of the target cell. How many trimers participate in these events, such as attachment to CD4, co-receptor interactions and hemi-fusion culminating in the creation and expansion of a fusion pore? The answer may not be a single integer. Different numbers of molecules may be involved in the distinct steps. Cellular factors, such as receptor density, may influence how many trimers are needed. And infectivity may dwindle at low trimer numbers without disappearing entirely.
Furthermore, populations of virions are heterogeneous. The number of functional trimers on the surface of virions varies. And this number may be declining over time because of shedding of SU, conformational inactivation or de-oligomerization (Moore et al., 1990; Moore et al., 2006; Poignard et al., 2003).
Env trimers form clusters over the virion sphere (Zhu et al., 2006). Random constellations of active trimers will differ and may confer distinct infectious propensities to the virion. Only adjacent trimers might function together (Figure 4A). The spherical distribution of trimers could thus add to virion heterogeneity.
Figure 4. Virion heterogeneities can soften thresholds.
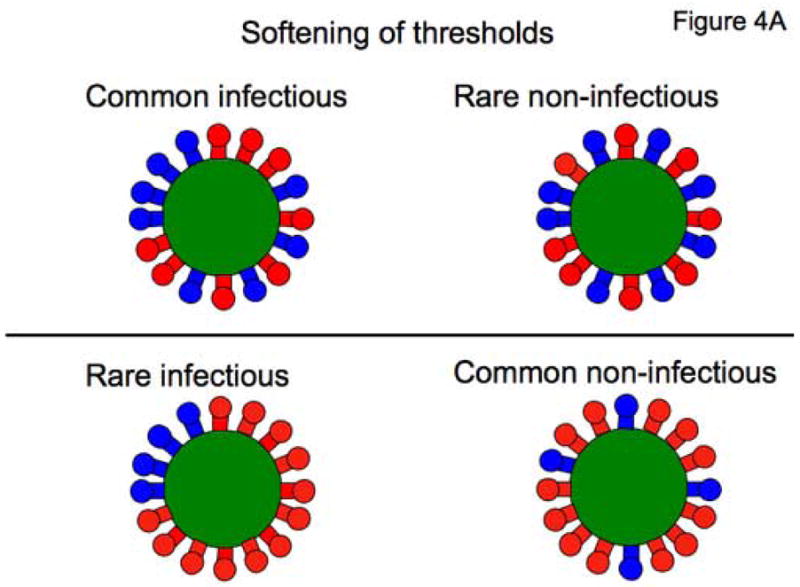
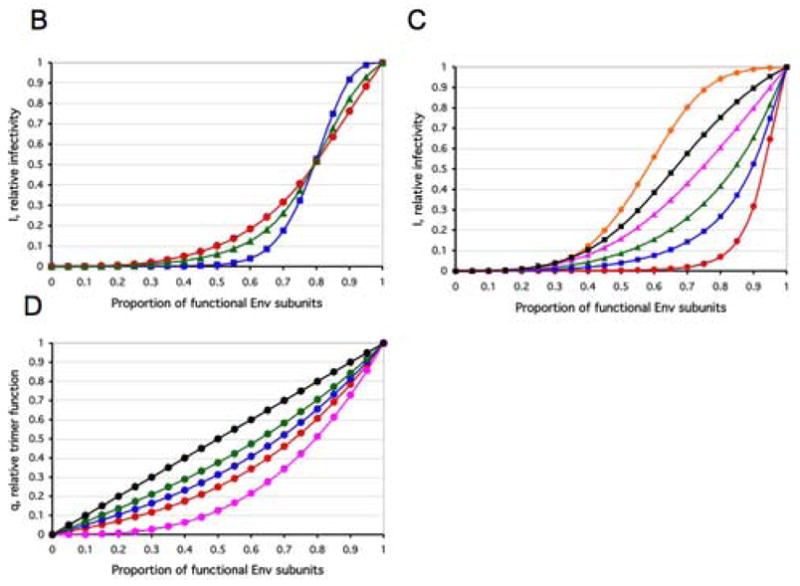
A. The cartoon shows how heterogeneity in Env distribution over virion spheres can soften threshold effects. The virions all have 16 trimers (active in blue, inert in red). In the top row, the virions have eight active trimers, in the bottom row, only four. If the condition for infectivity is a minimum of four contiguous trimers, infectivity will be common among the virions in the top row, but rare among those in the bottom row. Thus the number of active trimers will affect the probability that the requisite number will be present in a contiguous constellation conducive to infectivity; this scheme differs from the all-or-nothing effect of thresholds on infectivity that is determined solely by the number of active trimers regardless of how they are spread over the virion sphere. The consideration of spherical distribution causes a softening of the infectivity thresholds. Different spatial constellations of a the same number of contiguous trimers may also have different propensities to function in entry, a further blurring effect. In addition, any spare trimers that are outside entry-competent constellations could still modulate infectivity by contributing tp virus-cell attachment, creating yet more blurring of any simple threshold effect.
B. If the infectivity of the average virion is neither all-or-nothing nor exactly proportional to the number of functional trimers present, then a certain proportion of inert trimers would reduce the relative infectivity disproportionately without eliminating it. The infectivity may drop more precipitously in an intermediate zone than when the first and last trimers are knocked out. Such mixed liminal-incremental models assign different weights to each absolute-liminal equation. We assume n=9. Three curves for a soft threshold around L=5, I=(IL=1+bIL=2+b2IL=3+b4IL=4+b8IL=5+b4IL=6+b2IL=7+bIL=8+IL=9)/(2+2b+2b2+2b4+b8) are shown with a low (b=2) (blue squares), intermediate (b=1.3) (green triangles), and high (b=1.1) (red circles) degree of softness of the threshold.
C. Three curves with the same three values of b as in (B) for a low threshold around L=2, I=(b6IL=1+ b9IL=2+ b6IL=3+ b5IL=4+ b4IL=5+ b3IL=6+ b2IL=7+ bIL=8+ IL=9)/(1+b+b2+b3+b4+b5+2b6+b9) (b=2, red circles; b=1.3, blue squares; b=1.1, green triangles) and three for a high threshold around L=8, I=(IL=1+bIL=2+b2IL=3+b3IL=4+b4IL=5+b5IL=6+b6IL=7+b9IL=8+b6IL=9)/(1+b+b2+b3+b4+b5+2b6+b9) (b=2, orange circles; b=1.3, black squares; b=1.1, magenta triangles).
D. The blending of the two most realistic models at the trimer level, S=1 and the protomer-incremental one, is shown. Five different curves on the spectrum between the two extremes are shown for values of the parameter h=0 (magenta circles), h=0.33 (red circles), h=0.5 (blue circles) h=0.67 (green circles) and h=1 (black circles). Note that unlike in the other diagrams, the y axis here represents the relative trimer function, q.
These influences may render the apparent n lower than the real one. Indeed closeness to liminal models generally increased with diminishing n in Figure 3. Thus as a compromise among all considerations of the relevant number of active trimers per virion, the continued modeling was done with n=9.
All the outlined heterogeneities may result in a softening of the virion-level thresholds. The soft-threshold models for virions with 9 trimers are given by the equation
| Eq. 4 |
where IL=Σ9r= (9-L+1)9 Crqr(1-q)9-r(Eq. 1 with n=9).
The coefficients, c1-9, give weights to the thresholds. In order to reduce the number of parameters for fitting by non-linear regression, one can let cL=bz. Then the exponent z can be given different constant, low, arbitrary, whole-number values to place more or less weight on the different thresholds. If linear regression gives b>1, that favors a gradual-liminal model over a purely incremental one. If all potential thresholds are blended in (all cL=bz), and b=1 gives the best fit, that refutes any tendency towards a threshold. The model then coalesces with the proportionally incremental ones in Figure 2C for the respective S. Conversely, a best fit with b>1 refutes a purely incremental model, although it does so with a certain risk of over-fitting the data.
Figure 4B and C and Supplementary Figures 3 and 4 illustrate how different virion heterogeneities and incremental effects, one kind at a time, may soften thresholds and thereby reduce the slope of the infectivity curves. In reality, all these blurring effects may combine.
5. Differential protomeric contributions
As argued in the Supplement, if S=1 (q=p3) does not give good fits there are more plausible other options than S=2 or S=3. One is a proportionally incremental protomeric contribution to trimer function, q=p. This can be interpreted as a probability or a propensity: the chance of the all-or-nothing functioning of a trimer varies with its content of functional protomers; or the biochemical capacity of the trimer takes four values, 0, 1/3, 2/3 and 1. Combining S=1 and incremental protomeric contributions, one can ask where within such a spectrum the relative trimer function, q, lies:
| Eq. 5 |
Figure 4D illustrates trimer function for different values of h between 0 and 1. Any deviation from S=1 decreases the steepness of the curve. The parameter h is constrained (0≤h≤1) and can be fit (simultaneously with b at the virion level) by non-linear regression.
Thus allowing threshold flexibility at both levels, one can optimize the mixed model. This is illustrated in Table 3 and Figure 5.
Table 3.
Comparison of a flexible model based on n=1, L=1, T=1, and S=1 or 2, with the best mixed liminal-incremental models
| Neutralization(I) | Cleavage-defective(I) | Receptor-fusion defective(I) | |||||||||
|---|---|---|---|---|---|---|---|---|---|---|---|
| TCLA | PI | TCLA | PI YU2 | PI JR-FL |
TCLA CD4− |
TCLA CXCR4− |
PI CD4− |
PI CCR5− |
PI fusion− |
||
| Previous models T=1, S=1 or S=2(II) | R2 | 0.99 | 0.9980 | 0.99 | 0.98 | 0.90 | 0.97 | 0.96 | 0.98 | 0.9981 | 0.97 |
| k | 0.96 ±0.026 |
1.0 ±0.013 |
0.99 ±0.038 |
1.1 ±0.049 |
1.2 ±0.11 |
0.88 ±0.048 |
0.87 ±0.053 |
1.1 ±0.036 |
0.98 ±0.012 |
0.89 ±0.045 |
|
| Mixed incremental-liminal models | R2 | 1.0 (III,IV) |
1.0 (III,V) |
1.0 (III,VI) |
1.0 (III,VII) |
0.99 (III,VII) |
1.0 (III,IX) |
1.0 (III,IX) |
1.0 (III,X) |
0.9999 (III,XI) |
1.0 (III,IX) |
| Peak in threshold weight at virion level | L | 2 | 1,7,8 | 4,5 | 7 | 6 | 8 (5)XII | 8(5)XII | 7(5)XII | 5 | 8(5)XII |
| Weight of virion-level threshold | b | 1.2 ±0.0038 |
1.3 ±0.025 |
2.0 ±0.18 |
1.2 ±0.051 |
3.2 ±1.4 |
2.3 ±0.11 |
2.0 ±0.023 |
7.3 ±0.87 |
2.0 ±0.056 |
2.0 ±0.29 |
| Protomeric spectrum weight | h | 0.083 ±0.0039 |
0.0086 ±0.0050 |
0 ±0.026 |
0.10 ±0.024 |
0.39 ±0.068 |
0.21 ±0.019 |
0.24 ±0.0054 |
0.60 ±0.013 |
0.94 ±0.0067 |
0.31 ±0.069 |
| Akaike’s Corrected Score difference, |Δ| | Mixed incremental-liminal models preferred in all cases | 19 | 1.1 | 16 | 9.9 | 7.9 | 15 | 33 | 12 | 5.6 | 1.9 |
| Probability that preferred model is correctXIII | >99% | 64% | >99% | 99% | 98% | >99% | >99% | >99% | 94% | 72% | |
The neutralization data are from (Yang et al., 2005a): the mean I for the TCLA HXBc2 neutralized by 8 NAbs was calculated; the data for the PIs YU2, ADA and KB9 were pooled (mean I for 2–3 NAbs). The data on cleavage-defective TCLA HXBc2 were derived from (Herrera et al., 2006) and on cleavage-defective PI YU2 from (“HIV-1” in Figure 4B, 5B and 6B in (Yang et al., 2005b); neither a fusion-segment mutant (V513E) nor cytoplasmic-tail and matrix-protein mutants described in (Yang et al., 2005b) are included in the current re-analysis.); those for cleavage defective PI JRFL are from (Herrera et al., 2006). The mean I values for receptor-binding- and fusion-defective mutants are given in (Yang et al., 2006): the TCLA CD4− is HXBc2 with the Env mutation D368R; TCLA CXCR4− is the HXBc2 Env V3 mutant R308L; PI CD4− is YU2 Env D368R; PI CCR5− is the YU2 double V3 mutant R315G/L317S; PI fusion− is the YU2 TM mutant L520E. Results have been rounded off to two significant digits except where it would obscure a small difference in R2 between the models. The R2 values are based directly on the [p, I] coordinates derived from the individual studies. The data points modeled are illustrated by symbols in Figure 5.
Previous models for S=1 (Yang et al., 2005a; Yang et al., 2005b) and S=2 (Yang et al., 2006) are here given some flexibility in order to enhance their fits and render them more comparable with the highly plastic liminal-incremental models. The parameter values T=1, n=1 are shared. For S=1, the equation is I=kp3 (Eq. 9) and for S=2, it is I=k(3p2 − 2p3) (Eq. 10).
The trimer function is described by the spectrum q=hp+(1 − h)p3 in all equations. The infectivity equation has the general form I=(c1IL=1+ c2IL=2+ c3IL=3+ c4IL=4+ c5IL=5+c6IL=6+ c7IL=7+c8IL=8+c9IL=9)/(c1+ c2+ c3+ c4+ c5+ c6+ c7+ c8+ c9) (Eq. 4), where IL=Σ9r=(9−L+1)9 Crqr (1−q)9−r (Eq. 1 with n=9). The coefficients cL give different weights to the nine possible thresholds.
c1=b2, c2=b3, c3=b2 c4=b1, c5= b0, c6= b0, c7= b0, c8= b0, c9= b0
c1=b3, c2=b0, c3=b0 c4=b0, c5= b0, c6= b1, c7= b2, c8= b2, c9= b1
c1=b0, c2=b0, c3=b1 c4=b2, c5= b2, c6= b1, c7= b0, c8= b0, c9= b0
c1=b0, c2=b0, c3=b0 c4=b0, c5= b1, c6= b2, c7= b3, c8= b2, c9= b1
c1=b0, c2=b0, c3=b0 c4=b1, c5= b2, c6= b3, c7= b2, c8= b1, c9= b0
c1=b0, c2=b0, c3=b0 c4=b0, c5= b0, c6= b0, c7= b1, c8= b2, c9= b1
c1=b0, c2=b0, c3=b0 c4=b0, c5= b0, c6= b1, c7= b2, c8= b1, c9= b0
c1=b0, c2=b0, c3=b1 c4=b2, c5= b3, c6= b2, c7= b1, c8= b0, c9= b0
Alternative models with L peaking at 5 and compensatory, higher values of h are given in Supplementary Table 2. The information content of the current data is insufficient to distinguish between those options but it should be noted that nearly all data sets fit models with a middle range peak of L excellently.
The probability the model is correct is calculated from the corrected score difference, Δ, as (e−0.5Δ/(1+e−0.5Δ))*100%. The Akaike term “probability the model is correct” should not be taken literally; it pertains only under the assumption that the two models compared exhaust all possibilities, which the bulk of this study shows is absurd.
Figure 5. Empirical fit of combined liminal-incremental modeling at both trimer and virion levels.
The optimized liminal-incremental models presented in Table 3 are illustrated graphically. Here n=9 throughout. A. The infectivity, I, of virus with mixed antigenic and non-antigenic Env in the presence of an excess of NAb (Yang et al., 2005a) is expressed on the y-axis as a function of the proportion of functional Env on the x-axis. The red curve for the function with a soft threshold around L=2 is shown to fit the data for the TCLA virus HXBc2 (mean of I for 8 NAbs, red circles). The blue curve for the function with threshold peaks at L=[1,7,8] is shown to fit the data for the PIs YU2, ADA and KB9 (mean of pooled I for 2–3 NAbs, blue squares). B. The infectivity, I, of virus with mixed cleavage-defective and functional Env is plotted on the y-axis with the proportion of cleavable Env on the x-axis. The red curve shows how well a function with a gradual threshold around L=[4,5] fits the data for the TCLA virus HXBc2 (Herrera et al., 2006) (red circles); the blue curve represents the function with a gradual threshold around L=7 to fit the data for the PI YU2 (Yang et al., 2005b) (blue squares); the green curve shows how the function with a threshold of around L=6 fits the data for the PI JR-FL (Herrera et al., 2006) (green triangles).
C. The infectivity, I, is plotted on the y-axis as a function of the proportion of active Env on the x-axis for virus with mixed mutant and wild-type Env, where the mutant is defective in CD4 binding, co-receptor interaction or in the fusion function of gp41 (Yang et al., 2006a). The liminal-incremental model curves are shown to fit the data points of the same color: The TCLA virus HXBc2 defective in binding CD4, L around 8 (red, circles) or CXCR4, L around 8 (black, diamonds); PIs defective in binding CD4, L around 7 (blue, squares) or CCR5, L around 5 (magenta, diamonds); PIs defective for gp41 fusion function, L around 8 (orange, triangles). As shown in Supplementary Table 2, L around 5 can fit all these five data sets well with concomitantly high h values. L around 8 can also fit all five well and then the h values are lower. This compensatory effect of the two soft threshold levels is also seen among the individual five models in Table 3.
The combined liminal-incremental models of neutralization and cleavage-defective Env are close to the assumption of S=1 at the trimer level (h remains low in Table 3). There are, however, even in those categories two deviant h values, 0.10 and 0.39, for the cleavage-defective mutants of the PIs. The models for receptor-fusion-defective Env deviate considerably more from S=1: h ranges from 0.21 to 0.94. This variation among those five fits may be accidental. For it illustrates the interconnectedness of the thresholds at the two levels: the lower the value of L, the higher the value of h. As shown in Supplementary Table 2, models with either L=5 or L=8 can fit all five data sets approximately equally well. When L=5, h ranges from 0.7 to 1.0. When L=8, h ranges from 0.21 to 0.31. When L=5, the model approaches incremental protomer contribution. Whether L=8 or L=5, however, the first protomer that is knocked out reduces trimer function by at least a third, often more. In contrast, a previous model (Yang et al., 2006a) postulated that the first and third receptor-binding or fusion-segment mutant protomer had zero effect. It is also pertinent that a distinct fusion-segment mutant (V513E in YU2 Env (Yang et al., 2005b), not analyzed here) was previously identified and found to require S=1. Thus, although mutants seem to differ, there is no salient dichotomy among them.
The current variation in h proves two points: first, the more universal the peak in weight given to L values, e.g. around 5–6 (corresponding to a T of 4–5), the clearer the difference in h becomes between the neutralization and cleavage-defective Env models, on the one hand, and the receptor-fusion-defective models on the other. Secondly, within the mixed liminal-incremental models, deviations from S=1 can be satisfactorily accommodated by incremental protomer contributions without any need for postulating S=2.
Still, as mentioned in the introduction, any deviation from randomness, i.e. from the independence of the combinatorial events analysed, could have devastating effects on the validity of inferences to the best model. Specifically, if only homo-oligomerization occurred, that would simulate total protomeric incremental effects at the trimer level; for trimer activity would be strictly proportional to p. The apparent h would be =1 but that would not be because of incremental protomeric contributions to trimer function. More plausibly than such an extreme situation, mutants may deviate slightly and differentially from randomness in their oligomerization with wild-type. This source of erroneous stoichiometric interpretations must not be dismissed. Ideally, it ought to be addressed through immunoprecipitations for different values of p (cf. (Boulay et al., 1988)). Correspondingly, any tendency for homogenous incorporation of trimers into virions would militate against manifestation of the threshold effects predicted from binomial assumptions: the apparent b would be spuriously low.
If, however, there is a difference in threshold at the trimer level between cleavage-defective and other mutations, the cleavage-defective more dominant-negative effect may not best represent the true contribution by subunits to trimer function: the uncleaved polypeptide chain, with its different conformation, may pose a steric impediment to the function of the other two. The fusion-segment mutants should best address the number of subunits participating in the fusion reaction. But a strong negative effect of the first inert protomer cannot be refuted even for that reaction (Table 3, Supplementary Table 2).
In the three panels in Figure 5, the TCLA curves fall below the corresponding PI curves. As shown in Table 3, this is reflected in somewhat lower threshold values for TCLA than for PI virus (cf. (Klasse and Moore, 1996)), at the virion level in the case of neutralization and the cleavage defect, as well as at the trimer level for the receptor-binding-site and fusion-segment mutant. Whether this is a real biological difference or not, in order to represent it, a model requires plasticity and therefore complexity. Although only two parameters are fit in the final modeling, already that goes beyond the power of the existent data to discriminate unambiguously between different options. A strong caveat must be entered because of the great number of assumptions about the variables that are not fit. The complexity also carries a risk of overfitting the data.
That risk is particularly great for the model chosen to fit the PI neutralization data. As shown in Table 3 and by the equation, that model differs from all the others by encompassing two peaks in weights given to thresholds: a high and a low one. The very minor deviations from a purely incremental model in Figure 3 also suggested this distribution of the data. A speculative interpretation of such a double-threshold model would be that the first Ab gives a slightly greater dent in the infectivity than the subsequent ones. But then when two-thirds of the trimers are occupied the infectivity declines more sharply; each Ab that binds reduces the infectivity but not to entirely equal extents along the whole gamut. Such a view is possible. But much more detailed and precise data would be required to rule out a simpler model, e.g. a low and broad peak in L around 5, which fits so many of the other data sets excellently (Table 3 and Supplementary Table 2).
The excellent fits notwithstanding, all current modeling thus remains tentative. This is so not only because of uncertainty about premises, data imprecision, too few data points for discriminating between models and possible systematic errors in wild-type-mutant mixing and incorporation, but also because of model redundancy that arises partly from compensatory effects at the two levels of modeling (Supplementary Information).
Overall, the modeling suggests real thresholds of inactivation that are blurred by virion heterogeneities and that may co-exist with real incremental effects.
DISCUSSION
When an HIV virion has landed on the cell surface, a certain number of Env trimers will initially dock on to receptor molecules. Subsequently, infection may not ensue unless additional Env trimers make contact with receptor and co-receptor molecules. Such recruitment would ultimately create a fusion complex of Env, CD4 and co-receptors. We do not know the minimal numbers of the different components that comprise such a complex. Yang et al. (Yang et al., 2005a; Yang et al., 2005b; Yang et al., 2006a) posit that one trimer per virion is a sufficient and indeed the typical Env contribution to the fusion reaction. The modeling performed here gives alternative accounts of the data. Both kinds of modeling can approximate the data on virus pseudotyped with wild-type and mutant Env, although the current more flexible functions can yield superior fits (Table 3). In order to decide between these alternatives, however, one also needs, first, to scrutinize the realism of their premises. Then one has to examine whether they agree with various other independent bodies of data, distinct from those on mixed pseudotypes of wild-type and mutant Env.
Yang et al. (Yang et al., 2005a; Yang et al., 2005b) argue that since most virions are not infectious, the infectious minority on average has close to the minimum number of trimers, T, which they call an “infectious unit”. But such a paucity of infectious capacity would not exclude all spare capacity of Env: if n=9 and T=5, the spare capacity would be 4 trimers. Thus even if virions rarely had double the minimal number of trimers (n<2T or less than two “infectious units” as defined by Yang et al.) that does not preclude an influence of n on infectivity and its inhibition. Furthermore, the argument from the rarity of infectious virions also requires re-examination.
The estimated ratios of infectious units to total number HIV virions in the range 10−2–10−5 (Bourinbaiar, 1994; Klasse and McKeating, 1993; Layne et al., 1992; Piatak et al., 1993) must be cautiously interpreted. The fraction of infectious HIV-1 in a suspension of virions that is lost through infection or other interactions with receptor-bearing cells is negligible (Kabat et al., 1994; Thomas, Ott, and Gorelick, 2007). This would be in line with the Law of Mass Action, if the virion concentration is lower than the virion Kd for the binding to cellular receptors (cf. (Yu, Soong, and Anderson, 1995)). Indeed, when viral encounters with target cells are facilitated, the fraction of virus that infects increases several-fold (Haim, Steiner, and Panet, 2007; O’Doherty, Swiggard, and Malim, 2000; Platt, Durnin, and Kabat, 2005; Thomas, Ott, and Gorelick, 2007). Furthermore, infectivity is lost through unproductive cell-surface interactions (Platt, Durnin, and Kabat, 2005). Some of these lead to endocytic internalization and viral degradation (Marechal et al., 1998). Furthermore, proteasomes degrade a proportion of viral core particles in the cytoplasm after fusion (Schwartz et al., 1998). Therefore a large proportion of the potentially infectious virus that interacts with the susceptible cells does not give rise to infectious events. This rationalizes the distinction between infectious and infecting virus (Klasse, 1996). We cannot measure how much greater is the potential infectivity of a viral stock than the fraction that gives rise to diffusion-limited detectable infectious events. But the ratio of potentially infectious to total number of virions may not be so low (Thomas, Ott, and Gorelick, 2007), particularly before the infectivity of a viral stock has decayed substantially. This may invalidate the inference that each infectious virion has only the minimal amount of Env required for infection: the amount of functional Env is not the only limitation of infection. Thus, having tentatively refuted a central premise for the single-trimer modeling, we can turn to a number of independent areas where that model and the mixed liminal-incremental alternative have divergent implications. The redundancy among all the possible models (Supplementary Information) emphasizes this need to find independent ways of adjudicating between hypotheses.
An analysis of HIV-1 and -2 neutralization by sCD4 found it to be proportional to binding up to around 50% occupancy; higher degrees of binding yielded positive cooperativity (Layne et al., 1990). This suggests incremental effects on the probability of docking on to cellular CD4, followed by liminal effects on virion fusion. It corroborates the involvement of multiple trimers in entry.
Mathematical modeling of the infectability of cells with different CCR5 densities suggested that 4–6 coreceptor molecules are recruited into fusion complexes (Kuhmann et al., 2000). If Env mediates that recruitment, such interactions would require more than one Env trimer per virion. Indeed, the creation of a fusion pore may involve several Env trimers, while its subsequent dilation requires even greater numbers (Munoz-Barroso et al., 1998).
A recent electron-tomography study of the contact region between SIV and HIV-1 particles and the surface of susceptible cells describes an “entry claw” consisting of around five rods (presumably corresponding to Env-trimers making contact with receptors). Pertinent to the spherical distribution of functional trimers over the virion surface -- as discussed here (Fig. 4A) -- is the observation that the rods in the claw are somewhat closer to each other than the trimer spikes on free virions (Sougrat et al., 2007). Of course, there is no telling yet whether the claw is necessary for entry. Even if it were, that would not preclude that a single trimer in the claw, surrounded by fusion-defective ones, effected fusion (Sougrat et al., 2007; Yang et al., 2005b). In contrast, the binding of NAbs would quite plausibly prevent claw formation if it left fewer than a handful of contiguous trimers unoccupied (cf. (Yang et al., 2005a)); similarly, CD4-binding capacity of a single trimer would not allow claw formation, if the rods consist of Env-CD4 complexes (cf. (Yang et al., 2006a)). In conclusion, the results from disparate approaches converge on suggesting that around five trimers per virion, with a wide range of uncertainty, participate in entry.
HIV-1 fusion is a slow stochastic process; its rate depends on the density of the molecules involved. Some hybrids between CD4 and co-receptors yield enhanced infection, possibly because they obviate the need for a slow co-receptor-recruitment step (Klasse et al., 1999). And when receptors are sparse, their clustering in rafts promotes fusion (Gallo et al., 2003). These characteristics of fusion are more suggestive of multi-molecular processes than of the mediation of fusion by a single Env trimer. It has also recently been argued that the rate of infection depends on what proportion of virions make the requisite number of CCR5 contacts in order to overcome the activation energy for the fusogenic conformational changes in gp41 (Platt, Durnin, and Kabat, 2005). This hypothesis translates into mixed liminal-incremental effects.
How is infectivity affected by variations in the total number of trimers per virion? This is highly pertinent to evaluating single-trimer versus mixed liminal-incremental models. A truncation of 113 residues from the cytoplasmic domain of SIV Env resulted in 25- to 50-fold increases in the Env content of the virions, which translated into merely a 2- to 3-fold increase in infectivity (Yuste et al., 2004). The same truncation in two variants of SIV, with moderate to high sensitivity to neutralization, increased the amount of Env incorporated into virions as well as their neutralization resistance. For a moderately sensitive strain, a 10-fold rise in Env content led to a 24-fold increase in infectivity and a slight increase in neutralization resistance. For the more neutralization-sensitive variant, a 14-fold rise in Env content yielded 480-fold higher infectivity and near complete insensitivity to neutralization by Ab but not by sCD4 (Yuste et al., 2005). These non-linear relationships between amount of Env, on the one hand, and infectivity and sensitivity to neutralization, on the other, are amenable to quantitative modeling within the mixed liminal-incremental framework. So is the more extreme finding of a lack of any additional infectivity per virion with increased Env incorporation (Lopez-Verges et al., 2006). The latter result suggests a strong liminal component in an explanatory model. Neither the single-trimer hypothesis nor the pure incremental models can account for these non-linear effects.
Regarding neutralization, the hypothesis T=1 (Yang et al., 2005a) means that only when all trimers are occupied by Ab is the virion neutralized. Let us assume that the total number of trimers is around 10. Then the hypothesis T=1 implies that the neutralizing concentrations will be several-fold above the Kd for Ab binding to the Env trimer. The Kd for Ab binding to trimeric Env is thought to be higher than for binding to soluble SU (Kim et al., 2001; Sattentau and Moore, 1995), although a new study suggests that is not the case for the binding of the MAb b12 to trimers of uncleaved Env (Sharma et al., 2006). And some mid-neutralizing concentrations (IC50) recorded are in a range similar to those of Kd for SU (Parren et al., 1998). If the IC50 ≤ the relevant Kd, that refutes the T=1 hypothesis for high values of n. But this consequence does not arise if T=1 is combined with n=1, the hypothesis that has been advocated (Yang et al., 2005a; Yang et al., 2005b). Then the IC50 and the Kd for Ab binding to trimers would approximate each other (Klasse and Sattentau, 2002); they would coincide if S=1 and only one Ab can bind per trimer. Instead, the combination of T=1 with n=1 undermines the evolutionary explanation for why T would be so low: when every single Ab that binds to a previously unoccupied trimer neutralizes a virion, the virus has gained nothing in fitness by evolving towards such a low T. The requirement of complete occupancy does not yield a relative neutralization resistance unless there are several functional trimers per virion to occupy (Klasse and Sattentau, 2002). In contrast, a high threshold of neutralization, i.e., a great difference between minimal and total trimer number would yield that gain in fitness in the presence of a NAb (Klasse and Moore, 1996).
The multi-trimer hypotheses also more readily explain why more Ab is required to neutralize virions when the receptor and cell densities rise (Choudhry et al., 2006; Layne et al., 1991). Furthermore, if inactivation of Env, by shedding of gp120 or otherwise, contributes to viral decay in suspension, the liminal models with n>1 imply increased neutralization sensitivity when viral stocks age, as observed (Layne et al., 1991). The T=n=1 hypothesis implies no such difference. Indeed, the neutralization-modulating effects of receptor density specifically strengthens the case for gradual, i.e. mixed liminal-incremental, models. Therefore, virion infectivity and its sensitivity to inhibition may be propensities best described by continuous variables; all-or-nothing infectivity seems unrealistic (cf. Figure 4A).
To determine more precisely where in the liminal-incremental spectra the infectivities really fall will require further investigation of different strains, mutants and Abs (Maloveste, Klasse and Poignard, in preparation). It was recently reported that three strains of HIV-1 with widely different sensitivities to NAbs directed to natural epitopes acquired similar sensitivity to Abs directed to an engineered epitope inserted into their respective gp120s (Yang et al., 2006b). All differences in neutralization sensitivity were attributed to variations in affinity of the NAbs. This result is compatible with a strong incremental component in the neutralization (mathematically similar to T=n=1 but different in its implications), as suggested particularly for the PI in Figure 3. Alternatively, it could result from similar ratios of L to n in liminal models for the three strains studied.
Post-attachment neutralization of HIV-1 is well-documented, even for sCD4 and CD4bs NAbs (Lu, Putney, and Robinson, 1992; McInerney et al., 1997). It is most readily explained if entry, after initial attachment to the first CD4 molecule, involves the subsequent recruitment of additional receptors by neighboring trimers (Klasse and Sattentau, 2002; Parren and Burton, 2001). That sequence of events rationalizes the liminal-incremental models. A parallel may be found in influenza virus infection. Many HA trimers on a virion initially do not contact sialic-acid receptors. These so-called “outsiders” nevertheless crucially contribute to the infectivity of the virion (Leikina et al., 2004).
The enhancement of infectivity by sub-neutralizing concentrations of Abs (Schutten et al., 1995; Sullivan et al., 1995) has been explained by liminal theories of neutralization-critical levels of occupancy (Burton, Saphire, and Parren, 2001; Klasse and Burton, 2007; Klasse and Moore, 1996; Morens, Halstead, and Marchette, 1987; Pierson et al., 2007). Such explanations are not compatible with n=T=S=1. For under that condition, no intermediate -- and hence no sub-neutralizing -- occupancies are possible.
In conclusion, a universal T=n=1 model would not be able to account for any differences between strains, Abs or kinds of mutations in relative infectivity as a function of the proportion of active Env. In contrast, the liminal-incremental models fit data for different strains, Abs and mutants. Thus, compared with previous models, the current modeling yields improved fits based on more rational accounts of protomer contributions to trimer function and of trimer contributions to virion infectivity. Overall, the enhanced plasticity may increase rather than compromise the realism of the models.
METHODS
Derivation of the equations
In relation to cells transfected with two forms of the env gene, the binomial theorem pertains to two processes: when Env trimerizes and when virions assemble. First, it thus applies at trimerization in the endoplasmic reticulum (ER), where potentially functional Env protomers have a relative frequency of p and non-functional protomers a relative frequency 1-p. (Strictly speaking, functionality is merely potential at this stage since the protomers are not yet cleaved.) The sample space is [0,1,2,3] of either kind of Env in the trimer. Trimer formation can be regarded as three trials, N=3, and in each trial the probability that the protomer incorporated will be functional is the same, p. The number of functional subunits incorporated into a trimer is r. Thus the probability of r functional protomers in a trimer is
| Eq. 6 |
And thus the probability of no functional protomer in a trimer is P(R=0)=[3!/(0!(3-0)!)]p0(1-p)3-0=(1-p)3=1-3p+3p2−p3. The probability of only one functional subunit in a trimer is P(R=1)=[3!/(1!(3-1)!)]p1(1-p)3-1=3p(1-2p+p2)=3p-6p2+3p3. The probability of exactly two functional subunits in a trimer is P(R=2)=[3!/(2!(3-2)!)]p2(1-p)3-2=3p2−3p3. The probability of exactly three functional subunits in a trimer is P(R=3)=[3!/(3!(3-3)!)]p3(1-p)3-3=p3. This exhausts all combinatorial possibilities, because P(R=0)+P(R=1)+P(R=2)+ P(R=3)=1.
We now assume that a trimer is either completely active or inactive in entry. We call the minimal number of non-functional Env protomers needed to inactivate a trimer S (see Table 1 for a list of symbols of quantities). If S=1, then the proportion of functional trimers is equal to that without any non-functional trimers in it, i.e. homotrimers of functional protomers, P(R=3)=p3 which is also 1-[P(R=0)+P(R=1)+P(R=2)].
The non-functional fraction of trimers is [P(R=0)+P(R=1)+P(R=2)]=1-P(R=3) =1-p3. Thus, naming the functional fraction of trimers q, for all possible values of S, one gets: S=1, fraction of functional trimers, q=p3; for S=2, q=3p2−2p3; and for S=3, q=3p-3p2+p3.
The second cell-biological instance of a possible binomial distribution occurs at the cytoplasmic membrane, where the Gag protein drives viral budding. But we do not know how many Env trimers a virion incorporates. Early electron micrographs suggested an array of 72 Env spikes per virion (Grewe, Beck, and Gelderblom, 1990). Recently, electron-microscopic analyses concluded that there are only 8–10 trimers per virion of the HIV-1 strain MN but 70–79 per virion of some mutants of simian immunodeficiency virus (SIV) (Zhu et al., 2003). The number of Gag protein molecules inside the virion was estimated to be 1400 in the same study. The number of Env molecules per virion has also been derived from a ratio of 60 Gag molecules per Env protomer (Chertova et al., 2002; Yuste et al., 2004). Using that ratio and a postulated average of 1200–2500 Gag molecules per virion, the authors estimated that there are 7–14 trimers per virion. Subsequently, an approximate number of 5000 Gag molecules per HIV particle was determined by electron microscopy (Briggs et al., 2004), which would thus yield an at least two-fold higher range of Env trimers. Adding to the variability among viruses, varying proportions of SU may dissociate from TM (Moore et al., 1992). Furthermore, only a subset of the Env on the virion may be functional (Moore et al., 2006; Poignard et al., 2003). Therefore, one must explore a wide range of different total numbers of trimers per virion, when modeling infectivity.
For simplicity we assume, first, that the virion has 9 potentially active trimers. Secondly, we assume that the incorporation of functional or non-functional trimers is a random event: every uptake of a trimer is an independent trial with two possible outcomes. Thus again, we have a distribution of virions with different fractions of trimers in accordance with the binomial theorem,
| Eq. 7 |
where r is the number of functional trimers and n is the number of trimers per virion. Now n=9 and therefore R is a discrete random variable with sample space [0,1,2,…,9]. For the time being we make the drastic assumption that a virion only has two states: infectious or inert. We furthermore assume an absolute threshold, a minimum integer number of active trimers necessary and sufficient for infection to occur. It follows that there is a minimum number of trimers that need to be inactivated for the virion to be neutralized, which we call L. The minimum number of active trimers required for infection is n-L+1, which is the equivalent of the minimum number of trimers required for infectivity, called T in (Yang et al., 2005a; Yang et al., 2005b). If L=1, T=9: all trimers are needed for infection. L=9 would mean that one active trimer is sufficient for infection (cf. (Yang et al., 2005a; Yang et al., 2005b)). Generally, relative infectivity,
| Eq. 1 |
Specifically for n=9 we have:
P(R=0)=(1 − q)9
P(R=1)=9q(1 − q)8
P(R=2)=36q2(1 − q)7
P(R=3)=84q3(1 − q)6
P(R=4)=126q4(1 − q)5
P(R=5)=126q5(1 − q)4
P(R=6)=84q6(1 − q)3
P(R=7)=36q7(1 − q)2
P(R=8)=9q8(1 − q)
P(R=9)=q9
and I=Σ9r=(9-L+1)9Crqr(1 − q)9 − r (Eq. 1 with n=9).
A spectrum between incremental and liminal models
In an incremental model, infectivity of a virion is directly propotional to its number of functional trimers. I=q. In order to adjudicate between the liminal and incremental possibilities, we explored the continuous spectrum between them. The protomer threshold at the trimer level, S, was assumed to be 1 for both liminal and incremental models, because of the existing support for that assumption (Herrera et al., 2006; Schonning et al., 1999; Yang et al., 2005a; Yang et al., 2005b). Thus for the incremental pole of the spectrum, I=p3. This simple incremental model was compared with liminal models of different total trimer numbers, n=[5,9,15,45], and all possible thresholds, L, thus:
| Eq. 3 |
The parameter a, constrained to 0≤a≤1, was fit by non-linear regression; a was plotted for values of L yielding R2>0.9. (In order to explore local minima, in some cases fits were also based on half-integer values of L.)
Blending of liminal and incremental models at two levels
In order to incorporate the possibility of real and apparent incremental effects into the liminal framework, coefficients were introduced such that the thresholds were made gradual. The blended liminal-incremental models for virions with 9 trimers are given by the equation
| Eq. 4 |
where IL=Σ9r=(9-L+1)9Crqr(1 − q)9− r (Eq. 1 with n=9) and the coefficients, c1-9, give weights to thresholds of approximate critical numbers of functional trimers per virion.
Analogously, the putative, absolute protomeric threshold at the trimer level was softened. This was achieved by allowing trimer function to take a value between proportionally incremental protomeric effects, at the one extreme, and the assumption of S=1, at the other. The rationale for this spectrum is that q=p represents both a protomeric incremental effect and the average of S=[1,2,3], while S=1 is deemed the most realistic one of the three absolute protomeric thresholds. Thus
| Eq. 8 |
was incorporated into Eq. 4; the parameter h, constrained to 0≤h≤1, was fit by non-linear regression.
Equations allotting different combinations of weights to the thresholds were created by letting cL = bz where the exponent z of b takes arbitrarily chosen values ≥0 so as to give peaks at low, middle and high thresholds. Thereby the breadth of the threshold peak could also be varied. Three sliding peaks were explored: consecutive z values within the peak were set to 1,2,2,1; 1,2,1 or 1,2,3,2,1 and all z values outside the peak equal to 0 (giving c=1). Thereby a library of 20 equations allotting differential weights to different L values in a smooth continuous manner was created. Finally, the functions were fit by nonlinear regression and the best fits recorded. This always involved the simultaneous fitting of two parameters: h at the trimer level and b at the virion level. When all possible coefficients c1-9 approach 1, the liminal model coalesces with the proportionally incremental model at the virion level.
Non-linear regression and model comparison
Non-linear regressions, based on minimization of the sum of squares of the distances of the data points from the curve, with one or two parameters were performed in Prism (Graphpad). Even in the few exceptional cases where linear regression would be possible, the non-linear option in Prism was used to fit a first-order polynomial. There were too few data points to test for the normality of residuals. Runs tests were performed on all fit curves and showed no significant deviation from data. Initial values of fit parameters included b=2, h=0.5 and a=0.5; similar results were obtained with varied initial values. The more complex equations (n>9) were first evaluated in Mathematica (Wolfram Research) and then transferred to Prism. Since the rival models have only partly overlapping building blocks and therefore are not nested in a simple fashion, Akaike’s Information Criterion (Table 3, (Burnham and Anderson, 1998; Herrera et al., 2006)), rather than an F test, was chosen for comparing their fits.
Supplementary Material
Acknowledgments
I am grateful to Dennis Burton, Ferose Charifi, Michael Franti, Sebastien Maloveste, and Pascal Poignard for discussing empirical studies relevant to but not included in this work and to John Moore and John Murray for critical comments on the manuscript. Support by the NIH (R37 AI 36082) and the IAVI Neutralizing Antibody Consortium is gratefully acknowledged.
LIST OF ABBREVIATIONS
- HIV
Human immunodeficiency virus
- SIV
simian immunodeficiency virus
- Ab
antibody
- Nab
neutralizing antibody
- Env
envelope glycoprotein
- PI
primary isolate
- TCLA
T-cell-line-adapted strain
Footnotes
Publisher's Disclaimer: This is a PDF file of an unedited manuscript that has been accepted for publication. As a service to our customers we are providing this early version of the manuscript. The manuscript will undergo copyediting, typesetting, and review of the resulting proof before it is published in its final citable form. Please note that during the production process errors may be discovered which could affect the content, and all legal disclaimers that apply to the journal pertain.
References
- Boulay F, Doms RW, Webster RG, Helenius A. Posttranslational oligomerization and cooperative acid activation of mixed influenza hemagglutinin trimers. J Cell Biol. 1988;106(3):629–39. doi: 10.1083/jcb.106.3.629. [DOI] [PMC free article] [PubMed] [Google Scholar]
- Bourinbaiar AS. The ratio of defective HIV-1 particles to replication-competent infectious virions. Acta Virol. 1994;38(1):59–61. [PubMed] [Google Scholar]
- Briggs JA, Simon MN, Gross I, Krausslich HG, Fuller SD, Vogt VM, Johnson MC. The stoichiometry of Gag protein in HIV-1. Nat Struct Mol Biol. 2004;11(7):672–5. doi: 10.1038/nsmb785. [DOI] [PubMed] [Google Scholar]
- Burnham KP, Anderson DR. Model selection and multimodel inference. Springer; New York: 1998. [Google Scholar]
- Burton DR, Saphire EO, Parren PWHI. A model for neutralization of viruses based on antibody coating of the virion surface. Curr Top Microbiol Immunol. 2001;260:109–143. doi: 10.1007/978-3-662-05783-4_7. [DOI] [PubMed] [Google Scholar]
- Chan DC, Fass D, Berger JM, Kim PS. Core structure of gp41 from the HIV envelope glycoprotein. Cell. 1997;89(2):263–73. doi: 10.1016/s0092-8674(00)80205-6. [DOI] [PubMed] [Google Scholar]
- Chertova E, Bess JW, Jr, Crise BJ, Sowder IR, Schaden TM, Hilburn JM, Hoxie JA, Benveniste RE, Lifson JD, Henderson LE, Arthur LO. Envelope glycoprotein incorporation, not shedding of surface envelope glycoprotein (gp120/SU), Is the primary determinant of SU content of purified human immunodeficiency virus type 1 and simian immunodeficiency virus. J Virol. 2002;76(11):5315–25. doi: 10.1128/JVI.76.11.5315-5325.2002. [DOI] [PMC free article] [PubMed] [Google Scholar]
- Choudhry V, Zhang MY, Harris I, Sidorov IA, Vu B, Dimitrov AS, Fouts T, Dimitrov DS. Increased efficacy of HIV-1 neutralization by antibodies at low CCR5 surface concentration. Biochem Biophys Res Commun. 2006;348(3):1107–15. doi: 10.1016/j.bbrc.2006.07.163. [DOI] [PMC free article] [PubMed] [Google Scholar]
- Dimitrov DS, Willey RL, Sato H, Chang LJ, Blumenthal R, Martin MA. Quantitation of human immunodeficiency virus type 1 infection kinetics. J Virol. 1993;67(4):2182–90. doi: 10.1128/jvi.67.4.2182-2190.1993. [DOI] [PMC free article] [PubMed] [Google Scholar]
- Gallo SA, Finnegan CM, Viard M, Raviv Y, Dimitrov A, Rawat SS, Puri A, Durell S, Blumenthal R. The HIV Env-mediated fusion reaction. Biochim Biophys Acta. 2003;1614(1):36–50. doi: 10.1016/s0005-2736(03)00161-5. [DOI] [PubMed] [Google Scholar]
- Grewe C, Beck A, Gelderblom HR. HIV: early virus-cell interactions. J Acquir Immune Defic Syndr. 1990;3(10):965–74. [PubMed] [Google Scholar]
- Haim H, Steiner I, Panet A. Time frames for neutralization during the human immunodeficiency virus type 1 entry phase, as monitored in synchronously infected cell cultures. J Virol. 2007;81(7):3525–34. doi: 10.1128/JVI.02293-06. [DOI] [PMC free article] [PubMed] [Google Scholar]
- Herrera C, Klasse PJ, Kibler CW, Michael E, Moore JP, Beddows S. Dominant-negative effect of hetero-oligomerization on the function of the human immunodeficiency virus type 1 envelope glycoprotein complex. Virology. 2006 doi: 10.1016/j.virol.2006.03.003. [DOI] [PubMed] [Google Scholar]
- Iwatani Y, Kawano K, Ueno T, Tanaka M, Ishimoto A, Ito M, Sakai H. Analysis of dominant-negative effects of mutant Env proteins of human immunodeficiency virus type 1. Virology. 2001;286(1):45–53. doi: 10.1006/viro.2001.0944. [DOI] [PubMed] [Google Scholar]
- Kabat D, Kozak SL, Wehrly K, Chesebro B. Differences in CD4 dependence for infectivity of laboratory-adapted and primary patient isolates of human immunodeficiency virus type 1. J Virol. 1994;68(4):2570–7. doi: 10.1128/jvi.68.4.2570-2577.1994. [DOI] [PMC free article] [PubMed] [Google Scholar]
- Kim M, Chen B, Hussey RE, Chishti Y, Montefiori D, Hoxie JA, Byron O, Campbell G, Harrison SC, Reinherz EL. The stoichiometry of trimeric SIV glycoprotein interaction with CD4 differs from that of anti-envelope antibody Fab fragments. J Biol Chem. 2001;276(46):42667–76. doi: 10.1074/jbc.M104166200. [DOI] [PubMed] [Google Scholar]
- Klasse PJ. Physico-chemical analysis of the humoral immune response to HIV-1: quantification of antibodies, their binding to viral antigens and neutralization of viral infectivity. In: Korber CBB, Walker B, Koup R, Moore J, Haynes B, Myers G, editors. HIV molecular immunology database. Vol. 2. Los Alamos National Laboratory, Theoretical Biology and Biophysics; Los Alamos, New Mexico: 1996. pp. IV: 22–52. [Google Scholar]
- Klasse PJ, Burton D. Antibodies to West Nile Virus: A Double-Edged Sword. Cell Host & Microbe. 2007;1(2):87–89. doi: 10.1016/j.chom.2007.04.001. [DOI] [PubMed] [Google Scholar]
- Klasse PJ, McKeating JA. Soluble CD4 and CD4 immunoglobulin-selected HIV-1 variants: a phenotypic characterization. AIDS Res Hum Retroviruses. 1993;9(7):595–604. doi: 10.1089/aid.1993.9.595. [DOI] [PubMed] [Google Scholar]
- Klasse PJ, Moore JP. Quantitative model of antibody- and soluble CD4-mediated neutralization of primary isolates and T-cell line-adapted strains of human immunodeficiency virus type 1. J Virol. 1996;70(6):3668–77. doi: 10.1128/jvi.70.6.3668-3677.1996. [DOI] [PMC free article] [PubMed] [Google Scholar]
- Klasse PJ, Rosenkilde MM, Signoret N, Pelchen-Matthews A, Schwartz TW, Marsh M. CD4-Chemokine receptor hybrids in human immunodeficiency virus type 1 infection. J Virol. 1999;73(9):7453–66. doi: 10.1128/jvi.73.9.7453-7466.1999. [DOI] [PMC free article] [PubMed] [Google Scholar]
- Klasse PJ, Sattentau QJ. Occupancy and mechanism in antibody-mediated neutralization of animal viruses. J Gen Virol. 2002;83(Pt 9):2091–108. doi: 10.1099/0022-1317-83-9-2091. [DOI] [PubMed] [Google Scholar]
- Kuhmann SE, Platt EJ, Kozak SL, Kabat D. Cooperation of multiple CCR5 coreceptors is required for infections by human immunodeficiency virus type 1. J Virol. 2000;74(15):7005–15. doi: 10.1128/jvi.74.15.7005-7015.2000. [DOI] [PMC free article] [PubMed] [Google Scholar]
- Layne SP, Merges MJ, Dembo M, Spouge JL, Conley SR, Moore JP, Raina JL, Renz H, Gelderblom HR, Nara PL. Factors underlying spontaneous inactivation and susceptibility to neutralization of human immunodeficiency virus. Virology. 1992;189(2):695–714. doi: 10.1016/0042-6822(92)90593-e. [DOI] [PubMed] [Google Scholar]
- Layne SP, Merges MJ, Dembo M, Spouge JL, Nara PL. HIV requires multiple gp120 molecules for CD4-mediated infection. Nature. 1990;346(6281):277–9. doi: 10.1038/346277a0. [DOI] [PubMed] [Google Scholar]
- Layne SP, Merges MJ, Spouge JL, Dembo M, Nara PL. Blocking of human immunodeficiency virus infection depends on cell density and viral stock age. J Virol. 1991;65(6):3293–300. doi: 10.1128/jvi.65.6.3293-3300.1991. [DOI] [PMC free article] [PubMed] [Google Scholar]
- Leikina E, Mittal A, Cho MS, Melikov K, Kozlov MM, Chernomordik LV. Influenza hemagglutinins outside of the contact zone are necessary for fusion pore expansion. J Biol Chem. 2004;279(25):26526–32. doi: 10.1074/jbc.M401883200. [DOI] [PubMed] [Google Scholar]
- Lopez-Verges S, Camus G, Blot G, Beauvoir R, Benarous R, Berlioz-Torrent C. Tail-interacting protein TIP47 is a connector between Gag and Env and is required for Env incorporation into HIV-1 virions. Proc Natl Acad Sci U S A. 2006;103(40):14947–14952. doi: 10.1073/pnas.0602941103. [DOI] [PMC free article] [PubMed] [Google Scholar]
- Lu S, Putney SD, Robinson HL. Human immunodeficiency virus type 1 entry into T cells: more-rapid escape from an anti-V3 loop than from an antireceptor antibody. J Virol. 1992;66(4):2547–50. doi: 10.1128/jvi.66.4.2547-2550.1992. [DOI] [PMC free article] [PubMed] [Google Scholar]
- Marechal V, Clavel F, Heard JM, Schwartz O. Cytosolic Gag p24 as an index of productive entry of human immunodeficiency virus type 1. J Virol. 1998;72(3):2208–12. doi: 10.1128/jvi.72.3.2208-2212.1998. [DOI] [PMC free article] [PubMed] [Google Scholar]
- Matthews T, Salgo M, Greenberg M, Chung J, DeMasi R, Bolognesi D. Enfuvirtide: the first therapy to inhibit the entry of HIV-1 into host CD4 lymphocytes. Nat Rev Drug Discov. 2004;3(3):215–25. doi: 10.1038/nrd1331. [DOI] [PubMed] [Google Scholar]
- McInerney TL, McLain L, Armstrong SJ, Dimmock NJ. A human IgG1 (b12) specific for the CD4 binding site of HIV-1 neutralizes by inhibiting the virus fusion entry process, but b12 Fab neutralizes by inhibiting a postfusion event. Virology. 1997;233(2):313–26. doi: 10.1006/viro.1997.8547. [DOI] [PubMed] [Google Scholar]
- Moore JP, Doms RW. The entry of entry inhibitors: a fusion of science and medicine. Proc Natl Acad Sci U S A. 2003;100(19):10598–602. doi: 10.1073/pnas.1932511100. [DOI] [PMC free article] [PubMed] [Google Scholar]
- Moore JP, McKeating JA, Huang YX, Ashkenazi A, Ho DD. Virions of primary human immunodeficiency virus type 1 isolates resistant to soluble CD4 (sCD4) neutralization differ in sCD4 binding and glycoprotein gp120 retention from sCD4-sensitive isolates. J Virol. 1992;66(1):235–43. doi: 10.1128/jvi.66.1.235-243.1992. [DOI] [PMC free article] [PubMed] [Google Scholar]
- Moore JP, McKeating JA, Weiss RA, Sattentau QJ. Dissociation of gp120 from HIV-1 virions induced by soluble CD4. Science. 1990;250(4984):1139–42. doi: 10.1126/science.2251501. [DOI] [PubMed] [Google Scholar]
- Moore PL, Crooks ET, Porter L, Zhu P, Cayanan CS, Grise H, Corcoran P, Zwick MB, Franti M, Morris L, Roux KH, Burton DR, Binley JM. Nature of nonfunctional envelope proteins on the surface of human immunodeficiency virus type 1. J Virol. 2006;80(5):2515–28. doi: 10.1128/JVI.80.5.2515-2528.2006. [DOI] [PMC free article] [PubMed] [Google Scholar]
- Morens DM, Halstead SB, Marchette NJ. Profiles of antibody-dependent enhancement of dengue virus type 2 infection. Microb Pathog. 1987;3(4):231–7. doi: 10.1016/0882-4010(87)90056-8. [DOI] [PubMed] [Google Scholar]
- Munoz-Barroso I, Durell S, Sakaguchi K, Appella E, Blumenthal R. Dilation of the human immunodeficiency virus-1 envelope glycoprotein fusion pore revealed by the inhibitory action of a synthetic peptide from gp41. J Cell Biol. 1998;140(2):315–23. doi: 10.1083/jcb.140.2.315. [DOI] [PMC free article] [PubMed] [Google Scholar]
- O’Doherty U, Swiggard WJ, Malim MH. Human immunodeficiency virus type 1 spinoculation enhances infection through virus binding. J Virol. 2000;74(21):10074–80. doi: 10.1128/jvi.74.21.10074-10080.2000. [DOI] [PMC free article] [PubMed] [Google Scholar]
- Parren PW, Burton DR. The antiviral activity of antibodies in vitro and in vivo. Adv Immunol. 2001;77:195–262. doi: 10.1016/S0065-2776(01)77018-6. [DOI] [PMC free article] [PubMed] [Google Scholar]
- Parren PW, Mondor I, Naniche D, Ditzel HJ, Klasse PJ, Burton DR, Sattentau QJ. Neutralization of human immunodeficiency virus type 1 by antibody to gp120 is determined primarily by occupancy of sites on the virion irrespective of epitope specificity. J Virol. 1998;72(5):3512–9. doi: 10.1128/jvi.72.5.3512-3519.1998. [DOI] [PMC free article] [PubMed] [Google Scholar]
- Piatak M, Jr, Saag MS, Yang LC, Clark SJ, Kappes JC, Luk KC, Hahn BH, Shaw GM, Lifson JD. High levels of HIV-1 in plasma during all stages of infection determined by competitive PCR. Science. 1993;259(5102):1749–54. doi: 10.1126/science.8096089. [DOI] [PubMed] [Google Scholar]
- Pierson TC, Xu Q, Nelson S, Oliphant T, Nybakken GE, Fremont DH, Diamond MS. The stoichiometry of antibody-mediated neutralization and enhancement of West Nile virus infection. Cell Microbe and Pathogen. 2007 doi: 10.1016/j.chom.2007.03.002. [DOI] [PMC free article] [PubMed] [Google Scholar]
- Platt EJ, Durnin JP, Kabat D. Kinetic factors control efficiencies of cell entry, efficacies of entry inhibitors, and mechanisms of adaptation of human immunodeficiency virus. J Virol. 2005;79(7):4347–56. doi: 10.1128/JVI.79.7.4347-4356.2005. [DOI] [PMC free article] [PubMed] [Google Scholar]
- Poignard P, Moulard M, Golez E, Vivona V, Franti M, Venturini S, Wang M, Parren PW, Burton DR. Heterogeneity of envelope molecules expressed on primary human immunodeficiency virus type 1 particles as probed by the binding of neutralizing and nonneutralizing antibodies. J Virol. 2003;77(1):353–65. doi: 10.1128/JVI.77.1.353-365.2003. [DOI] [PMC free article] [PubMed] [Google Scholar]
- Poignard P, Saphire EO, Parren PW, Burton DR. gp120: Biologic aspects of structural features. Annu Rev Immunol. 2001;19:253–74. doi: 10.1146/annurev.immunol.19.1.253. [DOI] [PubMed] [Google Scholar]
- Salzwedel K, Berger EA. Cooperative subunit interactions within the oligomeric envelope glycoprotein of HIV-1: functional complementation of specific defects in gp120 and gp41. Proc Natl Acad Sci U S A. 2000;97(23):12794–9. doi: 10.1073/pnas.230438497. [DOI] [PMC free article] [PubMed] [Google Scholar]
- Sattentau QJ, Moore JP. Human immunodeficiency virus type 1 neutralization is determined by epitope exposure on the gp120 oligomer. J Exp Med. 1995;182(1):185–96. doi: 10.1084/jem.182.1.185. [DOI] [PMC free article] [PubMed] [Google Scholar]
- Schonning K, Lund O, Lund OS, Hansen JE. Stoichiometry of monoclonal antibody neutralization of T-cell line- adapted human immunodeficiency virus type 1. J Virol. 1999;73(10):8364–70. doi: 10.1128/jvi.73.10.8364-8370.1999. [DOI] [PMC free article] [PubMed] [Google Scholar]
- Schutten M, Andeweg AC, Bosch ML, Osterhaus AD. Enhancement of infectivity of a non-syncytium inducing HIV-1 by sCD4 and by human antibodies that neutralize syncytium inducing HIV-1. Scand J Immunol. 1995;41(1):18–22. doi: 10.1111/j.1365-3083.1995.tb03528.x. [DOI] [PubMed] [Google Scholar]
- Schwartz O, Marechal V, Friguet B, Arenzana-Seisdedos F, Heard JM. Antiviral activity of the proteasome on incoming human immunodeficiency virus type 1. J Virol. 1998;72(5):3845–50. doi: 10.1128/jvi.72.5.3845-3850.1998. [DOI] [PMC free article] [PubMed] [Google Scholar]
- Sharma VA, Kan E, Sun Y, Lian Y, Cisto J, Frasca V, Hilt S, Stamatatos L, Donnelly JJ, Ulmer JB, Barnett SW, Srivastava IK. Structural characteristics correlate with immune responses induced by HIV envelope glycoprotein vaccines. Virology. 2006 doi: 10.1016/j.virol.2006.04.030. [DOI] [PubMed] [Google Scholar]
- Sougrat R, Bartesaghi A, Lifson JD, Bennett AE, Bess JW, Zabransky DJ, Subramaniam S. Electron tomography of the contact between T cells and SIV/HIV-1: implications for viral entry. PLoS Pathog. 2007;3(5):e63. doi: 10.1371/journal.ppat.0030063. [DOI] [PMC free article] [PubMed] [Google Scholar]
- Sullivan N, Sun Y, Li J, Hofmann W, Sodroski J. Replicative function and neutralization sensitivity of envelope glycoproteins from primary and T-cell line-passaged human immunodeficiency virus type 1 isolates. J Virol. 1995;69(7):4413–22. doi: 10.1128/jvi.69.7.4413-4422.1995. [DOI] [PMC free article] [PubMed] [Google Scholar]
- Thomas JA, Ott DE, Gorelick RJ. Efficiency of human immunodeficiency virus type 1 postentry infection processes: evidence against disproportionate numbers of defective virions. J Virol. 2007;81(8):4367–70. doi: 10.1128/JVI.02357-06. [DOI] [PMC free article] [PubMed] [Google Scholar]
- Weissenhorn W, Dessen A, Harrison SC, Skehel JJ, Wiley DC. Atomic structure of the ectodomain from HIV-1 gp41. Nature. 1997;387(6631):426–30. doi: 10.1038/387426a0. [DOI] [PubMed] [Google Scholar]
- Wyatt R, Sodroski J. The HIV-1 envelope glycoproteins: fusogens, antigens, and immunogens. Science. 1998;280(5371):1884–8. doi: 10.1126/science.280.5371.1884. [DOI] [PubMed] [Google Scholar]
- Yang X, Kurteva S, Lee S, Sodroski J. Stoichiometry of antibody neutralization of human immunodeficiency virus type 1. J Virol. 2005a;79(6):3500–8. doi: 10.1128/JVI.79.6.3500-3508.2005. [DOI] [PMC free article] [PubMed] [Google Scholar]
- Yang X, Kurteva S, Ren X, Lee S, Sodroski J. Stoichiometry of envelope glycoprotein trimers in the entry of human immunodeficiency virus type 1. J Virol. 2005b;79(19):12132–47. doi: 10.1128/JVI.79.19.12132-12147.2005. [DOI] [PMC free article] [PubMed] [Google Scholar]
- Yang X, Kurteva S, Ren X, Lee S, Sodroski J. Subunit stoichiometry of human immunodeficiency virus type 1 envelope glycoprotein trimers during virus entry into host cells. J Virol. 2006a;80(9):4388–95. doi: 10.1128/JVI.80.9.4388-4395.2006. [DOI] [PMC free article] [PubMed] [Google Scholar]
- Yang X, Lipchina I, Cocklin S, Chaiken I, Sodroski J. Antibody binding is a dominant determinant of the efficiency of human immunodeficiency virus type 1 neutralization. J Virol. 2006b;80(22):11404–8. doi: 10.1128/JVI.01102-06. [DOI] [PMC free article] [PubMed] [Google Scholar]
- Yu H, Soong N, Anderson WF. Binding kinetics of ecotropic (Moloney) murine leukemia retrovirus with NIH 3T3 cells. J Virol. 1995;69(10):6557–62. doi: 10.1128/jvi.69.10.6557-6562.1995. [DOI] [PMC free article] [PubMed] [Google Scholar]
- Yuste E, Johnson W, Pavlakis GN, Desrosiers RC. Virion envelope content, infectivity, and neutralization sensitivity of simian immunodeficiency virus. J Virol. 2005;79(19):12455–63. doi: 10.1128/JVI.79.19.12455-12463.2005. [DOI] [PMC free article] [PubMed] [Google Scholar]
- Yuste E, Reeves JD, Doms RW, Desrosiers RC. Modulation of Env content in virions of simian immunodeficiency virus: correlation with cell surface expression and virion infectivity. J Virol. 2004;78(13):6775–85. doi: 10.1128/JVI.78.13.6775-6785.2004. [DOI] [PMC free article] [PubMed] [Google Scholar]
- Zhu P, Chertova E, Bess J, Jr, Lifson JD, Arthur LO, Liu J, Taylor KA, Roux KH. Electron tomography analysis of envelope glycoprotein trimers on HIV and simian immunodeficiency virus virions. Proc Natl Acad Sci U S A. 2003;100(26):15812–7. doi: 10.1073/pnas.2634931100. [DOI] [PMC free article] [PubMed] [Google Scholar]
- Zhu P, Liu J, Bess J, Jr, Chertova E, Lifson JD, Grise H, Ofek GA, Taylor KA, Roux KH. Distribution and three-dimensional structure of AIDS virus envelope spikes. Nature. 2006;441(7095):847–52. doi: 10.1038/nature04817. [DOI] [PubMed] [Google Scholar]
Associated Data
This section collects any data citations, data availability statements, or supplementary materials included in this article.