

Abstract
Large conductance, calcium-activated potassium channels (BKCa channels) are regulated by several distinct mechanisms, including phosphorylation/dephosphorylation events and protein-protein interactions. In this study, we have examined the interaction between BKCa channels and syntaxin 1A, a soluble N-ethylmaleimide-sensitive factor attachment protein receptor (SNARE) that is reported to modulate the activity and/or localization of different classes of ion channels. Using a reciprocal co-immunoprecipitation strategy, we observed that native BKCa channels in rat hippocampus co-associate with syntaxin 1A, but not the closely related homologue syntaxin 3. This BKCa channel-syntaxin 1A interaction could be further demonstrated in a non-neuronal cell line (human embryonic kidney (HEK) 293 cells) following co-expression of rat syntaxin 1A and BKCa channels cloned from either mouse brain or bovine aorta. However, co-expression of these same channels with syntaxin 3 did not lead to a detectable protein-protein interaction. Immunofluorescent co-staining of HEK 293 cells expressing BKCa channels and syntaxin 1A demonstrated overlapping distribution of these two proteins in situ. Functionally, co-expression of BKCa channels with syntaxin 1A, but not syntaxin 3, was observed to enhance channel gating and kinetics at low concentrations (1–4 μm) of free cytosolic calcium, but not at higher concentrations (≤ 10 μm), as judged by macroscopic current recordings in excised membrane patches. Interactions between BKCa channels and neighbouring membrane proteins may thus play important roles in regulating the activity and/or distribution of these channels within specialized cellular compartments.
It is well recognized that membrane ion channels play critical roles in normal cellular activity, by generating the ionic fluxes that underlie various cellular events in both excitable and non-excitable cells. More recently, it has become increasingly apparent that membrane ion channels do not operate in isolation, but rather, can exist as ‘partners’ in larger protein complexes that carry out specialized cellular tasks. Such is the case in excitation- contraction coupling, where voltage-gated calcium channels in the surface membrane communicate with calcium release channels (ryanodine receptors) in the sarcoplasmic reticulum, either directly by physical interaction or indirectly via limited calcium influx (Stern & Lakatta, 1992; Lamb, 2000), to elicit elevation of cytoplasmic free calcium and muscle contraction. Another example is the presynaptic compartment, where N-type calcium channels act in concert with an intricate array of protein machines that regulate the vesicular release of neurotransmitter (Catterall, 2000; Lin & Scheller, 2000). In both cases, it is essential that the individual protein partners are delivered to the correct membrane domain and remain spatially co-localized, in order for such macromolecular complexes to properly function.
Large conductance, calcium-sensitive potassium channels (BKCa or maxi-K) are unique members of the large family of potassium-selective ion channels, in that they can be gated independently by membrane voltage and direct binding of intracellular free calcium (Cui et al. 1997; Toro et al. 1998; Rothberg & Magleby, 2000; Horrigan & Aldrich, 2002). BKCa channels demonstrate widespread expression and are present in nerve, muscle (smooth and skeletal), endocrine/exocrine cells and epithelium/ endothelium. In nerves, BKCa channels are co-localized with voltage-gated calcium channels at neurotransmitter release sites (Roberts et al. 1990; Issa & Hudspeth, 1994; Sun et al. 1999), where they regulate the release of neurotransmitter by controlling calcium influx (Roberts et al. 1990; Robitaille & Charlton, 1992; Blundon et al. 1995). In smooth muscle, BKCa channels are spatially co-localized with intracellular calcium-release channels (i.e. ryanodine receptors), and produce transient outward currents in response to ‘calcium sparks’, leading to membrane hyperpolarization and decreased contractility (Jaggar et al. 2000). BKCa channels thus appear to be positioned at sites of local calcium elevation, and as a result of their voltage and calcium sensitivity, are optimally suited to act as ‘feedback regulators’ of excitatory stimuli. In the present study, we have examined the interaction between BKCa channels and the membrane-associated soluble N-ethylmaleimide-sensitive factor attachment protein receptor (SNARE) protein, syntaxin 1A, which is a critical regulator of neurotransmitter release. Using a co-immunoprecipitation strategy, we observed that native BKCa channels in the rat hippocampus form a stable association with syntaxin 1A, but not the closely related family member syntaxin 3 (Jahn & Südhof, 1999; Lin & Scheller, 2000), and that this stable interaction can be reproduced following transient co-expression in human embryonic kidney (HEK) 293 cells of rat syntaxin 1A and BKCa channels cloned from either mouse brain or bovine aorta. Functionally, syntaxin 1A was found to enhance the steady-state voltage dependence and kinetics of BKCa channel activity, as judged from macroscopic current recordings in excised, inside-out membrane patches. Our observations demonstrate that BKCa channels may form stable interactions with syntaxin 1A, leading to enhancement of channel activity at low levels of free cytosolic calcium.
METHODS
Affinity-purified, rabbit polyclonal antibodies recognizing mammalian syntaxin 3 and BKCa channel α subunits were purchased from Chemicon International (Temecula, CA, USA). Preparation of the polyclonal anti-cysteine string protein (CSP) antibody has been described previously (Braun & Scheller, 1995). The anti-Gβ subunit antibody was obtained from Calbiochem (San Diego, CA, USA). A mouse monoclonal anti-syntaxin 1A antibody (HPC-1) and an HRP-linked, mouse monoclonal anti-rabbit IgG secondary antibody (clone RG-96) were purchased from Sigma (St Louis, MO, USA). Anti-mouse and anti-rabbit secondary antibodies conjugated to the fluorescent dyes Alexa 488 or Cy3 were obtained from Molecular Probes (Eugene, OR, USA) and Jackson Immunoresearch (West Grove, PA, USA), respectively. A Lowry-style protein assay kit (detergent compatible), nitrocellulose membrane (0.2 µm pore diameter), and SDS-PAGE reagents were purchased from Bio-Rad Laboratories (Hercules, CA, USA).
Construction and transfection of cDNA plasmids
The cDNAs encoding the murine brain BKCa channel (mSlo) α subunit (Pallanck & Ganetzky, 1994) and the wild-type green fluorescent protein (GFP) (Chalfie et al. 1994) were subcloned into the polylinker region of the SV-40 promoter-based mammalian expression plasmid SRα using standard techniques. The bovine aortic BKCa channel α subunit (bSlo), inserted into the pcDNA3.1 expression plasmid, was obtained from Dr E. Moczydlowski (Yale University) and was not further modified. The full-length rat brain syntaxin 1A cDNA, in the expression plasmid pMT2XS, was provided by Dr G. Zamponi (University of Calgary). Full-length syntaxin 3A cDNA was cloned from whole rat brain mRNA by RT-PCR using the following oligonucleotide primers that were designed according to the published sequence of rat syntaxin 3a (GenBank accession no. NM 031124; EcoRI and Kpn I restriction sites are underlined; forward primer, 5′-CGGAATTCGACGCGCTTACCTGAGACAAG-3′; reverse primer, 5′-GGGGTACCTCTGGAGACAAGAGTGGTTCAG-3′. Following subcloning into the expression vector pcDNA3.1, the insert cDNA was sequenced along both strands to rule out synthesis errors during PCR amplification.
Transient transfection of HEK 293 cells (50-80 % confluency) was carried out in 35 mm tissue culture dishes using the lipofection technique. Briefly, 6-8 µl of Lipofectamine (Gibco/BRL) was mixed together with ≈1.5 µg plasmid cDNA in 1 ml of serum-free culture medium (Dulbecco's modified Eagle's medium supplemented with l-glutamine and 4.5 g l−1d-glucose) and placed on cells for 4-6 h in a humidified incubator containing 5 % CO2 at 37 °C. DNA-containing medium was then aspirated and replaced with serum-containing medium. The following day, cells were detached from the dish by treatment with 0.05 % (w/v) trypsin/0.5 mm EDTA and replated onto sterile glass coverslips. Electrophysiological recordings were performed on days 3-4 following transfection (day 1). For biochemical studies, cells were detached from 35 mm dishes on day 2 and then replated onto 100 mm dishes to prevent over-growth. These cells were then harvested on days 3-4 following transfection.
Electrophysiology
Macroscopic currents were recorded at 35-36 °C from excised, inside-out membrane patches of transfected HEK 293 cells using an Axopatch 200B patch-clamp amplifier and pClamp 7 software. BKCa channel currents were activated by voltage-clamp pulses to potentials ranging from -180 to +240 mV; tail currents were recorded at +50, -80 or -120 mV. The holding potential for voltage-clamp steps varied with the concentration of cytoplasmic free calcium; in the presence of 2 mm EGTA, the holding potential was -30 mV; for 1 and 4 µm, the holding potential was -80 mV; for 10 and 100 µm, the holding potential was -120 mV. A -P/5 digital leak subtraction protocol was used during current recording. Current traces were filtered at 5 kHz (four-pole Bessel filter) and acquired on a Dell Pentium II-based computer at a sampling frequency of 20 kHz using a Digidata 1200 analog/digital interface. Recording micropipettes were pulled from thin-walled borosilicate glass capillaries (1.2 mm i.d., 1.5 mm o.d., WPI, Sarasota, FL, USA) using a Sutter P-89 horizontal electrode puller. Micropipettes were filled with a solution containing (mm): 5 KCl, 125 KOH, 1 MgCl2, 1 CaCl2, 10 Hepes, pH adjusted to 7.3 with methanesulphonic acid and had tip resistances of 2-3.5 MΩ. The bath solution contained (mm): 5 KCl, 125 KOH, 1 MgCl2, 2 EGTA or H-EDTA, and 10 Hepes, pH adjusted to 7.3 with methanesulphonic acid. Based on calculations using the WinMaxC program (Bers et al. 1994), variable amounts of a 0.1 m CaCl2 solution were added to give the desired free calcium concentrations. The level of free calcium in each solution was then adjusted independently and confirmed using a calcium-sensitive electrode (Orion model 93-20), with calibration standards (WPI) ranging from pCa 8 to 2. The recording chamber (≈0.3 ml volume) was perfused by gravity flow at a constant rate of 1-1.5 ml min−1, using a set of manually controlled solenoid valves to switch between solutions.
Transfected HEK 293 cells seeded on coverslips were placed in a temperature-controlled recording chamber on the stage of a Nikon Eclipse TE300 inverted microscope. Individual cells expressing BKCa channels were then identified visually by co-expression of the marker protein GFP under epifluorescence illumination using 480 nm excitation and 510 nm emission filters.
Western blotting
Preparation of rat brain hippocampal homogenate was carried out as described recently (Magga et al. 2000). Briefly, young adult male rats (200-300 g) were anaesthetized using halothane and then decapitated. Intact hippocampi were dissected out and hand homogenized with a Teflon-coated pestle in a buffer (2 ml per hippocampus) containing (mm): 320 sucrose, 1 EGTA, 0.1 EDTA, 0.5 phenylmethylsulphonyl fluoride (PMSF), a protease inhibitor cocktail (Boehringer Mannheim), 10 Hepes, pH adjusted to 7.0 with 1 N KOH. The crude homogenate was centrifuged for 10 min at ≈500 × g and the supernatant was subsequently centrifuged for 20 min at ≈20 000 × g at 4 °C. The pellet was suspended in a buffer containing: 150 mm KCl, 1 % (v/v) Triton X-100, 4.5 mm Mg(CH3COO)2, 0.5 mm PMSF, a protease inhibitor cocktail and 20 mm Mops, pH 7.0. Following incubation at 37 °C for 30 min, the suspension was centrifuged at ≈1000 × g and the soluble material collected for further use.
Transfected HEK 293 cells were detached on day 3 by brief incubation with sterile phosphate-buffered saline (PBS) containing 0.05 % trypsin/0.5 mm EDTA, then centrifuged in 15 ml culture tubes at ≈100 × g for 5 min, and stored at -80 °C as intact cell pellets. These pellets were resuspended in 0.5-1 ml of ice-cold lysis buffer containing 20 mm Tris HCl, pH 7.4, 140 mm NaCl, 5 mm KCl, 1 % (v/v) Triton X-100, 1 mm EGTA, 2 mm EDTA, 1 mm DTT, 1 mm PMSF, 1 mm benzamidine and 5 µg ml−1 each of leupeptin, pepstatin A and aprotinin, then sonicated on ice for 5-10 s to shear the genomic DNA. Measurements of protein concentration in both hippocampal extracts and HEK 293 cell lysates were carried out using a modified Lowry procedure (Lowry et al. 1951).
Prior to resolution by SDS-PAGE (Laemmli, 1970), cellular proteins or immunoprecipitated materials were mixed with Laemmli sample buffer containing 1 % (v/v) β-mercaptoethanol, and then incubated for 20-30 min at 70 °C. The resolved proteins were electrotransferred to nitrocellulose membrane at 4 °C in a buffer containing 25 mm Tris, 192 mm glycine, 0.1 % (w/v) SDS and 20 % (v/v) methanol either for ≈2 h at 80-90 V or overnight at 35 V. Membranes were first dried in a fume hood to fix the proteins, then briefly rinsed in a buffer containing 20 mm Tris HCl, pH 7.4, 150 mm NaCl and 0.1 % (v/v) Tween-20 (TTBS). Membranes were incubated at room temperature for 20-30 min in TTBS containing 5-10 % (w/v) skimmed milk powder to block non-specific binding of antibodies, then rinsed 3 × 5 min in TTBS. Incubation of membranes with primary antibodies was carried out in TTBS containing 1 % (w/v) skimmed milk powder for 1-2 h at room temperature, followed by 3-5 × 10 min washes with TTBS alone. Membranes were then incubated for ≈1 h at room temperature with an appropriate secondary antibody conjugated to HRP, also diluted in TTBS/1 % (w/v) skimmed milk powder, followed by 3-5 × 5 min washes with TTBS. After the final wash, blots were immediately developed by applying the SuperSignal chemiluminescence reagent (Pierce Chemical Co., Rockford, IL, USA) for ≈2 min, then exposing to X-ray film (Hyperfilm, Amersham Pharmacia, Piscataway, NJ, USA)).
Immunoprecipitation of BKCa channels or syntaxins
Expressed BKCa channels, syntaxin 1A or syntaxin 3, were immunoprecipitated from transiently transfected HEK 293 cells as follows: 48-72 h following transfection, cells growing on a 100 mm dish were harvested in 1 ml of lysis buffer (see above), sonicated briefly, then centrifuged at ≈16 000 × g for 10 min at 4 °C in a microcentrifuge. The supernatant was diluted to 0.4-0.6 mg protein ml−1, and a 1.4 ml aliquot of the diluted lysate was transferred to a clean microcentrifuge tube. For immunoprecipitation of native BKCa α subunit or syntaxin 1A or syntaxin 3, the soluble hippocampal extract (see above) was diluted to 0.5-0.7 mg protein ml−1 and a 1.4 ml aliquot was transferred to a clean microcentrifuge tube. In both cases, bovine serum albumin (BSA) was added to a final concentration of 1 mg ml−1, and the samples were then pre-cleared by addition of 40 µl of a 50 % slurry (v/v) of rehydrated protein A-Sepharose beads (Amersham Pharmacia), followed by rotation at 4 °C for 2 h. Samples were centrifuged for 5 min at ≈8000 × g to pellet the beads, and the soluble material was transferred to a clean microcentrifuge tube. Pre-cleared supernatants were then incubated for 4-16 h at 4 °C with ≈1.5 µg of anti-BKCa channel antibody, 3-5 µg of anti-syntaxin 1A antibody (HPC-1), or 5 µg of anti-syntaxin 3 antibody, followed by further incubation for 2 h with 30 µl of protein A-Sepharose beads (50 % slurry). The beads were pelleted by centrifugation at ≈2000 × g for 5 min at 4 °C, then washed twice by resuspension in 1 ml of wash buffer containing 20 mm Tris HCl, pH 7.4, 140 mm NaCl, 5 mm KCl, 1 mm DTT, 1 mm EDTA, 0.2 mm EGTA, 1 mm benzamidine, 1 mm PMSF, 0.1 % (v/v) Triton X-100 and 5 µg ml−1 each of aprotinin, leupeptin and pepstatin A, followed by a final wash in the same buffer minus Triton X-100. The beads were then resuspended in 30-40 µl of Laemmli sample buffer, heated to 70 °C for 20-30 min, followed by centrifugation at ≈2000 × g for 5 min. The soluble proteins were then resolved by SDS-PAGE and analysed by Western blotting.
Immunocytochemistry
Transfected HEK 293 cells were first replated onto sterile glass coverslips (no. 1 thickness) that had been pre-coated with poly-lysine (50 µg ml−1 for 30 min at room temperature). The next day, cells were washed 3 × with PBS to remove medium and serum, then fixed by incubation for 20 min at room temperature in PBS containing 1 % (w/v) formalin. Following fixation, cells were washed 3 × with PBS, then permeabilized by incubation for 5 min in PBS containing 0.1 % Trition X-100. Permeabilized cells were washed 2 × with PBS, then incubated for 5 min in blocking solution (3 % (w/v) BSA and 0.05 % (v/v) Tween-20 in PBS) to reduce non-specific antibody binding. Incubations of cells with anti-BK channel (1:400 dilution in blocking solution) and anti-syntaxin 1A (1:1000 dilution in blocking solution) primary antibodies were carried out sequentially for 1 h at room temperature; following each incubation, cells were washed 3-4 × with blocking solution. Once exposure to the second primary antibody was completed, cells were incubated (1 h at room temperature or overnight at 4 °C) with a mixture of mouse anti-rabbit secondary antibody conjugated to Cy3 (1:7000 dilution) and a goat anti-mouse secondary antibody (1:1500 dilution) conjugated to Alexa 488. Following secondary antibody incubation, cells were rinsed once with blocking solution, then 2 × with PBS only. Coverslips containing stained cells were mounted onto glass slides and photographed directly using a conventional upright Nikon microscope equipped with epifluorescence illumination. Alternatively, stained cells were examined using a Leica model DMRXA confocal fluorescence microscope and a × 63 oil-immersion objective (NA = 1.32). Images were collected using a model ST133 camera (Princeton Instruments) equipped with a KAF1600 detector. Deconvolusion software was used to resolve images obtained using optical sections in the Z plane of ≈0.5 µm. Each frame contained 512 × 512 pixels, which corresponds to dimensions of approximately 30 µm × 30 µm. The fluorophores Alexa 488 and Cy3, conjugated to secondary antibodies, were excited using a mercury lamp at wavelengths of 470 nm and 535 nm, respectively. Emission light was collected at a wavelength of either 525 nm (Alexa 488) or 610 nm (Cy3) and stored on the hard disk of a personal computer. Optical filters (HQ series, Chroma Technology, Brattleboro, VT, USA) for GFP and Cy3 were used to control excitation and emission light for the green and red fluorescence signals, respectively.
RESULTS
Co-immunoprecipitation of BKCa channels and syntaxin 1A from rat hippocampus
A number of recent reports have indicated that SNARE proteins, such as syntaxin, can interact with and regulate the activity and/or cellular distribution of various membrane ion channels (Atlas, 2001; Fili et al. 2001; Jarvis & Zamponi, 2001; Peters et al. 2001; Ji et al. 2002; Leung et al. 2003). BKCa channels are known to exist in the presynaptic membrane of neurons (Roberts et al. 1990; Robitaille & Charlton, 1992; Bielefeldt & Jackson, 1993; Issa & Hudspeth, 1994; Sun et al. 1999) along with voltage-dependent calcium channels and the t-SNARE, syntaxin 1A. In view of these findings, we have examined whether syntaxin 1A may also interact with, and modulate the activity of neuronal BKCa channels. In a detergent-solubilized extract from freshly dissected rat brain hippocampus, the native BKCa channel α subunit was detected as an ≈125 kDa immunoreactive band, which was enriched following immunoprecipitation (Fig. 1A). We also noted the presence of non-specific, lower-molecular-weight bands in both samples.
Figure 1. Syntaxin 1A, but not syntaxin 3, co-immunoprecipitates with native rat brain BKCa channels.

A, Western blot (WB) of proteins isolated from a soluble rat hippocampal extract by parallel immunoprecipitations using a selection of antibodies recognizing the BKCa channel α subunit (α-mSlo), syntaxin 1A (α-Stx1A), syntaxin 3 (α-Stx3), an unrelated epitope tag (α-GluGlu), or protein A- Sepharose beads in the absence of primary antibody (indicated at the top of the panel). Following SDS-PAGE and electrotransfer, the blot was probed with an antibody recognizing the BKCa channel α subunit, and the position of the BKCa α subunit (BK) detected in both the immunoprecipitates and the initial hippocampal extract is indicated on the right-hand side. Also marked are the immunoreactive bands corresponding to the antibody heavy chains carried over from the immunoprecipitation procedure. Following immunodetection of the BKCa channel, the nitrocellulose membrane was stripped and then re-probed using the anti-syntaxin 1A monoclonal antibody HPC-1 (B). The position of syntaxin 1A (Stx1A) detected in both the immunoprecipitates and the hippocampal extract is indicated on the right-hand side of the blot. C, the immunoprecipitates and hippocampal extract were later probed using an anti-syntaxin 3 antibody. Note that immunoreactive bands corresponding to syntaxin 3 (Stx3) were only detected in the anti-syntaxin 3 immunoprecipitate and hippocampal extract. The electrophoretic positions of the molecular mass standards (size in kDa) are shown on the left-hand side of each blot in A-C. The results shown in this figure are representative of data observed in two additional experiments.
In another aliquot from the same extract, a monoclonal antibody (HPC-1) was used to immunoprecipitate native syntaxin 1A. Probing this immunoprecipitate for the presence of BKCa channels revealed an immunoreactive band with the same apparent molecular mass as the native BKCa channel α subunit. In contrast, BKCa channel immunoreactivity was not detected in anti-syntaxin 3 immunoprecipitates, demonstrating the selective nature of this observed co-association. To control for potential non-specific protein-protein interactions that may occur during immunoprecipitation (Fletcher et al. 2003), we carried out the immunoprecipitation procedure in the same hippocampal extract with a monoclonal antibody recognizing an unrelated epitope tag, ‘Glu-Glu’ (Gussenmeyer et al. 1985; Rubinfeld et al. 1991), as well as in the absence of a primary antibody, with just the protein A-Sepharose beads alone. In both cases, no BKCa channel immunoreactivity was detected; however, non-specific immunoreactive bands were observed in the cases of the anti-syntaxin 3 and anti-Glu-Glu immunoprecipitates (Fig. 1A). Based on this selective co-immunoprecipitation, it thus appears that syntaxin 1A, but not syntaxin 3, interacts with a protein complex containing neuronal BKCa channels. Figure 1B shows a Western blot of the same samples described in Fig. 1A that was probed with a monoclonal antibody (HPC-1) recognizing syntaxin 1A. In the soluble hippocampal extract, as well as in the syntaxin 1A immunoprecipitate, a major immunoreactive band of apparent molecular mass 35-36 kDa was observed, corresponding to the monomeric form of syntaxin 1A. Consistent with the results shown in Fig. 1A, syntaxin 1A immunoreactivity was also clearly detected in the BKCa channel immunoprecipitate, but not in the precipitates generated by anti-syntaxin 3 antibody, the anti-‘Glu-Glu’ monoclonal antibody or the protein A-Sepharose beads (Fig. 1B). This latter result contrasts with a recent report (Fletcher et al. 2003) showing that under similar conditions, native rat brain syntaxin 1A can ‘stick’ non-specifically to protein A-Sepharose beads. Importantly, syntaxin 3 protein was detected in both the hippocampal extract and immunoprecipitate obtained with anti-syntaxin 3 antibody, but not in any of the other precipitated samples (Fig. 1C). However, in the cases of the anti-syntaxin 1A and anti-Glu-Glu immunoprecipitates, diffuse, non-specific bands of higher molecular weight were noted. Taken together, these data indicate that native BKCa channels and syntaxin 1A can be selectively isolated in a protein complex from rat hippocampus using a strategy of reciprocal co-immunoprecipitation. These observations are thus similar to those reported recently by Fili et al. (2001), which demonstrate that syntaxin 1A can also co-associate with the α and β subunits of the voltage-gated potassium channel Kv1.1 in rat brain.
In addition to its critical role in the regulation of neurotransmitter release (Jahn & Südhof, 1999; Lin & Scheller, 2000), several studies have reported that N-type calcium-channel activity may be regulated by syntaxin 1A, along with CSP and βγ subunits of heterotrimeric G-proteins (Sheng et al. 1994; Catterall, 1999; Jarvis et al. 2000; Magga et al. 2000; Jarvis & Zamponi, 2001; Chen et al. 2002). To examine whether these same proteins also interact with BKCa channels, we further probed the BKCa channel and syntaxin 1A immunoprecipitates for the presence of CSP and Gβ protein. In hippocampal extracts, CSP and Gβ were readily detected by Western blot as ≈34 kDa and ≈36 kDa bands, respectively; however, no CSP or Gβ immunoreactivity was observed in either the BKCa channel or the syntaxin 1A immunoprecipitates (data not shown).
Co-immunoprecipitation of BKCa channels and syntaxin 1A from transfected HEK 293 cells
Given the variety of complex interactions observed for syntaxin 1A in rat hippocampus, we decided to further characterize the co-association of BKCa channels and syntaxin using a co-expression strategy in a non-neuronal cell line. cDNAs encoding the mouse brain BKCa channel α subunit (mSlo) and rat brain syntaxin 1A were transiently expressed in HEK 293 cells either separately or together. To examine whether syntaxin binding was specific to a neuronal form of the BKCa channel, we also co-expressed syntaxin 1A with a smooth muscle isoform of the BKCa channel α subunit (bSlo), cloned from bovine aorta (Moss et al. 1996). Following transient transfection of HEK 293 cells under each of these four conditions (i.e. mSlo alone, mSlo + syntaxin 1A, bSlo + syntaxin 1A, syntaxin 1A alone), we prepared whole-cell lysates and carried out the same immunoprecipitation protocol as described above, using either the anti-BKCa channel antibody or the anti-syntaxin 1A antibody. Figure 2A shows a Western blot of the anti-BKCa channel immunoprecipitates probed with the anti-syntaxin 1A monoclonal antibody.
Figure 2. Co-immunoprecipitation of cloned rat brain syntaxin 1A with either mSlo or bSlo BKCa channels following transient co-expression in HEK 293 cells.
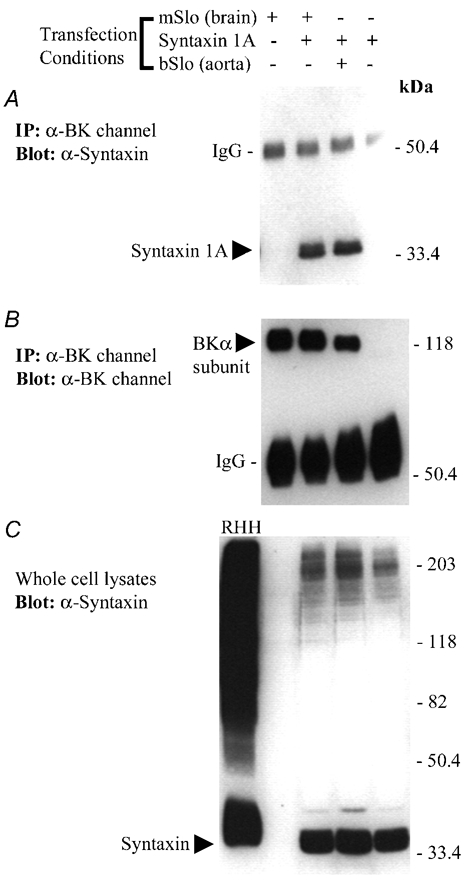
A, Western blot of solubilized protein material immunoprecipitated from four separate groups of transfected HEK 293 cells using an anti-BKCa channel polyclonal antibody (Chemicon International, Temecula, CA, USA). The absence (−) or presence (+) of BKCa channel or syntaxin 1A cDNA in the transfection medium for each group of cells is indicated above the panel. The blot was probed with a monoclonal antibody recognizing syntaxin 1A (HPC-1). The positions of monomeric syntaxin 1A and the IgG heavy chain are indicated on the left-hand side of the blot. Following immunodetection of syntaxin 1A, the same nitrocellulose membrane shown in A was stripped and then re-probed using an anti-BKCa channel antibody (B). The positions of the BKCa channel α subunit and the IgG heavy chain are indicated on the left-hand side of the blot. C, the soluble rat hippocampal homogenate (RHH), along with the solubilized cell lysate from each group of transfected HEK 293 cells (≈60 µg protein loaded per well), were resolved by SDS-PAGE and analysed by Western blot, using the anti-syntaxin 1A antibody. The position of syntaxin 1A detected in either the hippocampal extract or the soluble HEK 293 cell lysates is indicated on the left-hand side. In A-C, the electrophoretic positions of molecular mass standards (size in kDa) are shown on along the right-hand side of each blot. The results shown in this figure are representative of data observed in two additional experiments. IP, immunoprecipitate.
In the cells co-transfected with syntaxin 1A and either mSlo from brain or bSlo from aorta, we observed that syntaxin 1A was also present in each of the BKCa channel immunoprecipitates. This finding thus demonstrates that syntaxin 1A is able to co-associate with functional BKCa channels in the absence of other neuronal presynaptic proteins. Furthermore, this association does not appear to be specific to neuronal BKCa channels, as the smooth muscle form of the channel appears to be an equally effective partner. However, it is important to note that the mSlo and bSlo cDNAs used in our study are predicted to share > 95 % identity at the amino acid level, therefore, it is very likely that a putative site for syntaxin 1A binding is conserved between these two BKCa channel isoforms. As a control, we detected no syntaxin 1A immunoreactivity in BKCa channel immunoprecipitates from cells expressing syntaxin 1A alone. This result demonstrates that the syntaxin 1A co-immunoprecipitation observed above is strictly dependent upon BKCa channel co-expression.
To confirm that this observed pattern of syntaxin 1A immunoreactivity correlated with the level of BKCa channel protein isolated by direct immunoprecipitation, we probed these anti-channel immunoprecipitates for the presence of the BKCa α subunit (Fig. 2B). In cells transfected with either the mSlo or bSlo cDNAs, we observed immunoreactive bands of apparent molecular mass ≈120 kDa; however, no such band was detected in cells transfected with syntaxin 1A alone. The slight difference observed in the apparent molecular masses for the mSlo and bSlo immunoreactive bands is accounted for by the smaller predicted size of the full-length bSlo α subunit (1113 amino acids) versus the mSlo α subunit (1144 amino acids) encoded by the cDNA clones used in this study.
As a final confirmation of these data, we probed the starting whole-cell lysates used for the immunoprecipitation protocol above, for the presence of syntaxin 1A immunoreactivity. Expressed syntaxin 1A protein was readily detected as a 35-36 kDa band in HEK 293 cells transfected with syntaxin 1A cDNA (Fig. 2C); however, we did not detect syntaxin immunoreactivity in HEK 293 cells transfected with just the mSlo or bSlo cDNA alone. Furthermore, whereas a ‘streak’ of syntaxin 1A immunoreactivity was observed in rat hippocampal homogenate following SDS-PAGE, similar, high molecular mass syntaxin 1A complexes were noticeably absent in transfected HEK 293 cells. This result suggests that HEK 293 cells lack the majority of neuronal syntaxin-1A-binding proteins that give rise to the formation of stable, SDS-resistant syntaxin-1A-containing protein complexes (Hayashi et al. 1994; Pellegrini et al. 1995; Braun & Madison, 2000).
These results clearly demonstrate that both native and recombinant syntaxin 1A can be detected by Western blot in protein samples immunoprecipitated using an anti-BKCa channel antibody. If syntaxin 1A is truly able to co-associate with BKCa channels in situ, then it should also be possible to demonstrate the presence of BKCa channel protein in samples immunoprecipitated using an anti-syntaxin 1A antibody. To directly test this prediction, we carried out a reciprocal immunoprecipitation protocol, using the same transfected HEK 293 cell lysates described in Fig. 2. Figure 3A shows a Western blot of anti-syntaxin 1A immunoprecipitates that has been probed with an antibody recognizing the BKCa channel α subunit.
Figure 3. Co-immunoprecipitation of mSlo or bSlo BKCa channels with syntaxin 1A following transient co-expression in HEK 293 cells.
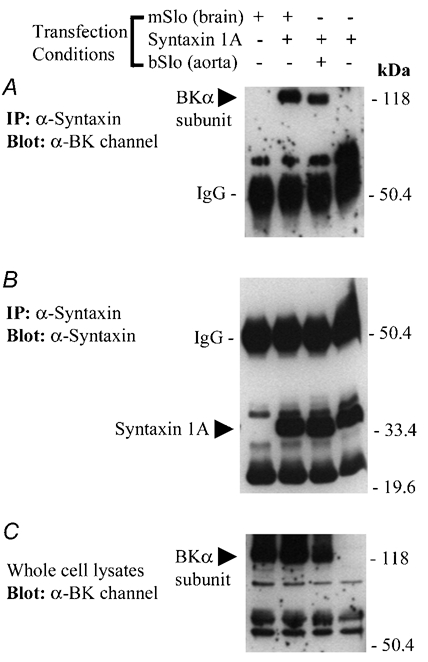
A, Western blot of solubilized protein material immunoprecipitated from four groups of transfected HEK 293 cells using the anti-syntaxin 1A monoclonal antibody, HPC-1. The absence (−) or presence (+) of BKCa channel or syntaxin 1A cDNA in the transfection medium for each group of cells is indicated above the panel. The blot has been probed with a polyclonal antibody (Chemicon) recognizing the BKCa channel α subunit. The positions of the mouse brain and bovine aortic BKCa channel α subunits and the IgG heavy chain are indicated on the left-hand side of the blot. Following immunodetection of the BKCa channel, the same nitrocellulose membrane shown in A was stripped and then re-probed for the presence of syntaxin 1A, using the monoclonal antibody HPC-1 (B). The positions of the syntaxin 1A monomer and the IgG heavy chain are indicated on the left-hand side of the blot. C, the solubilized cell lysate from each group of transfected HEK 293 cells (≈60 µg protein loaded per well) were resolved by SDS-PAGE and analysed by Western blot, using the anti-BKCa channel antibody. The band corresponding to the expressed BKCa channel α subunit detected in the solubilized HEK 293 cell lysates is indicated on the left-hand side. In A-C, the electrophoretic mobilities of molecular mass standards (size in kDa) are shown on along the right-hand side of each blot. The results shown in this figure are representative of data observed in two additional experiments.
In cells co-transfected with syntaxin 1A and either mSlo or bSlo, we observed the presence of a BKCa channel α subunit in the immunoprecipitated samples. However, no BKCa channel immunoreactivity was detected in anti-syntaxin 1A immunoprecipitates from cells transfected solely with either mSlo or syntaxin 1A. These results are thus consistent with those presented in Fig. 2, in which we observed that the co-immunoprecipitation of syntaxin 1A with an anti-channel antibody depended entirely upon the co-expression of a BKCa channel α subunit. The effectiveness of anti-syntaxin 1A immunoprecipitation was further demonstrated by probing these same immunoprecipitates for the presence of syntaxin 1A protein. As shown in Fig. 3B, we observed similar amounts of syntaxin 1A protein in immunoprecipitates from cells transfected with the syntaxin 1A cDNA; however, no such immunoreactivity was detected in the immunoprecipitate from HEK 293 cells transfected with just the BKCa channel alone. This result is thus consistent with the finding presented in Fig. 2C, demonstrating the presence of syntaxin 1A immunoreactivity in HEK 293 cells transfected with syntaxin 1A cDNA, and the absence of syntaxin 1A in cells transfected with only the mSlo cDNA. To confirm that the presence or absence of immunoreactive BKCa channel protein in the anti-syntaxin 1A immunoprecipitates correlated with initial cellular expression, we performed a Western blot analysis and probed the starting whole-cell lysates for BKCa channel protein. Figure 3C demonstrates similar levels of BKCa channel α subunit expression in cells transfected with either the mSlo or bSlo cDNAs, whereas no BKCa channel protein was detected in HEK 293 cells transfected with syntaxin 1A alone.
Lack of interaction between BKCa channels and syntaxin 3
To address whether the observed interaction between co-transfected BKCa channels and syntaxin 1A (Fig. 2 and Fig. 3) may be due in part to the transient expression strategy itself, we first cloned a cDNA encoding syntaxin 3 from rat brain and then transfected it into HEK 293 cells in either the absence or presence of mSlo or bSlo α subunits. Under the same experimental conditions used to detect syntaxin 1A co-immunoprecipitation, we did not observe any co-expressed syntaxin 3 protein in anti-BKCa channel immunoprecipitates (Fig. 4A and B); this finding thus contrasts with that described for syntaxin 1A in Fig. 2 and Fig. 3. The presence of co-expressed syntaxin 3 protein in each of the respective cell lysates was further confirmed by Western blotting (Fig. 4C). These data derived from transient expression are thus consistent with the lack of interaction noted between syntaxin 3 and native BKCa channels in brain hippocampal extract (see Fig. 1A) and serve as a critical control for the BKCa channel-syntaxin 1A co-association detected following transient protein expression in HEK 293 cells.
Figure 4. Syntaxin 3 does not co-immunoprecipitate with BKCa channels following co-expression in HEK 293 cells.
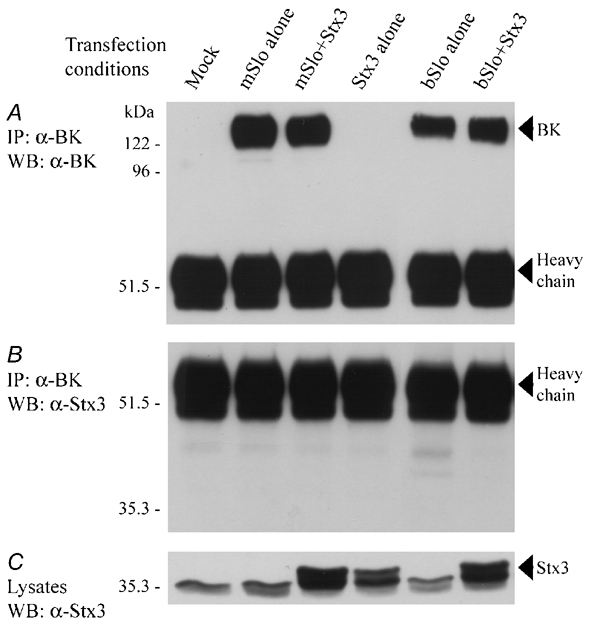
HEK 293 cells were transfected with cDNAs encoding the BKCa channel α subunit from mouse brain (mSlo), from bovine aorta (bSlo) or syntaxin 3 (Stx3) from rat brain, either alone or in combination, as indicated. A, Western blot of anti-BKCa channel immunoprecipitates probed with an antibody recognizing the BKCa α subunit; the control immunoprecipitate was derived from mock-transfected HEK 293 cells. Immunoreactive bands representing the BKCa channel α subunit (BK) and the antibody heavy chain are indicated on the right-hand side of the blot. Following detection of the BKCa channel α subunit, immunoprecipitates were re-probed with an antibody recognizing syntaxin 3 (B). However, no immunoreactive bands were detected on the blot at the expected electrophoretic position for syntaxin 3. C, Western blot of the solubilized HEK 293 whole-cell lysates used for immunoprecipitation, probed with an anti-syntaxin 3 antibody. Syntaxin 3 protein (arrowhead) was only detected in HEK 293 cells transfected with syntaxin 3 cDNA, whereas another closely migrating, non-specific band was noted in all transfected cells. In A-C, the positions of molecular mass standards (size in kDa) are shown along the left-hand side of each blot. The results shown in this figure are representative of data observed in two additional experiments.
Co-staining of BKCa channels and syntaxin 1A in intact cells
Our finding that BKCa channels and syntaxin 1A can be isolated in a stable complex by reciprocal co-immunoprecipitation suggests strongly that these two proteins co-associate in situ. To examine the in situ distribution of both proteins, HEK 293 cells were transfected with both syntaxin 1A and the BKCa channel α subunit cDNAs, or with each cDNA separately. All transfected cells were then co-immunostained for both syntaxin 1A and BKCa channel protein expression. The staining patterns observed using both primary antibodies are shown for cells transfected with either BKCa channel alone (Fig. 5A and B) or syntaxin 1A alone (Fig. 5C and D); the absence of detectable immunostaining in cells not expressing the cognate protein demonstrates the specificity of both the primary and secondary antibodies under the conditions of our experiment.
Figure 5. Immunostaining of HEK 293 cells transfected with mSlo BKCa channel cDNAs and syntaxin 1A either alone (A-D) or in combination (E and F).

Transiently transfected HEK 293 cells growing on glass coverslips were fixed and incubated with primary and secondary antibodies, as described in Methods. A and B, HEK 293 cells transfected with only the mSlo cDNA, co-immunostained for both the BKCa channel α subunit (A) and syntaxin 1A (B). Similarly, C and D show the co-staining patterns of HEK 293 cells transfected with cDNA for only syntaxin 1A. The co-staining patterns of HEK 293 cells co-transfected with both BKCa channel α subunit and syntaxin 1A cDNAs are shown in E and F. G, the two fluorescent images shown in E and F digitally superimposed; the regions of the cells displaying yellow colour indicate a direct overlap of the syntaxin 1A (green) and BKCa channel (red) staining patterns following superimposition. The horizontal scale bar below G represents 15 µm, and is applicable to all panels. Similar staining results were observed in three additional sets of transfected cells.
Under all three transfection conditions, immunostaining was readily apparent both in intracellular compartments (e.g. endoplasmic reticulum), at the cell surface and in distal processes. Importantly, in cells co-transfected with both syntaxin 1A and BKCa channel α subunit cDNAs (Fig. 5E and F), co-immunostaining for both proteins could be readily detected in the same cells. Importantly, digital superimposition of the syntaxin 1A and BKCa channel staining patterns shown in Fig. 5E and F demonstrated a significant degree of overlap of both proteins, as indicated by the resultant yellow colour in Fig. 5G.
To achieve greater spatial resolution of these overlapping patterns of immunostaining, co-transfected HEK 293 cells were examined further by confocal microscopy. Co-immunostaining of the BKCa channel (Fig. 6A) and syntaxin 1A (Fig. 6B) proteins demonstrated significant amounts of both proteins at the surface membrane, in addition to intracellular compartments.
Figure 6. Confocal imaging of HEK 293 cells co-transfected with BKCa channel α subunit and syntaxin 1A cDNAs.
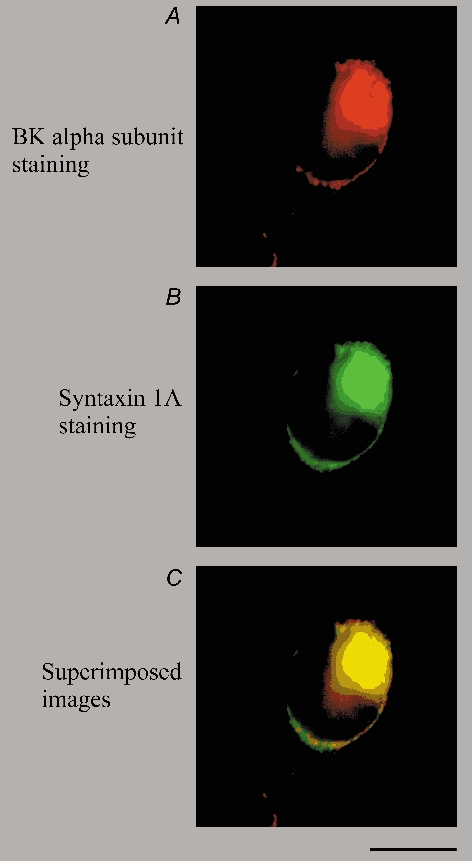
Co-immunostaining and confocal microscope analyses of transfected cells were performed as described in Methods. A and B, the staining patterns of the anti-BKCa channel and anti-syntaxin 1A primary antibodies, respectively. These images were obtained from the same focal plane of the cell. C, superimposition of the images shown in A and B, demonstrating the co-localization of the two fluorescent signals within the vertical depth of the focal plane (≈0.5 µm). The scale bar beneath C represents 10 µm and applies to all three panels. Similar staining results were observed in three additional sets of transfected cells.
Along the plasma membrane, punctate staining of both the BKCa channel α subunit and syntaxin 1A was visible, and superimposition of the two images revealed clear co-localization of the two fluorescent signals (Fig. 6C). Although these data do not directly demonstrate a physical interaction between these two proteins, the observed co-distribution of syntaxin 1A and BKCa channels is consistent with our prediction that these two proteins should demonstrate overlapping distribution in situ, based on our earlier results (Figs 1-3) describing the co-immunoprecipitation of both syntaxin 1A and BKCa channels.
Effect of syntaxin 1A co-expression on BKCa channel currents
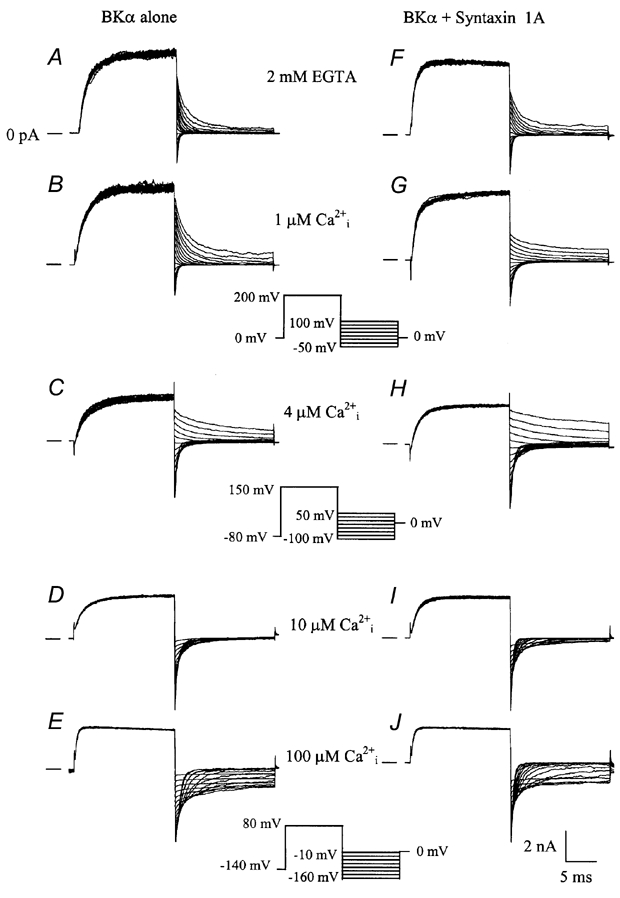
To examine how the observed co-association of syntaxin 1A influenced the activity of BKCa channels, macroscopic BKCa channel currents were recorded from excised, inside-out membrane patches, using patch-clamp techniques (Braun & Sy, 2001). Figure 7A-E shows macroscopic current traces recorded from an inside-out patch taken from a HEK 293 cell transfected with mSlo cDNA encoding the mouse brain BKCa channel α subunit.
Figure 7. Macroscopic currents recorded from mSlo BKCa channels expressed in the presence or absence of syntaxin 1A.

A-E, macroscopic currents recorded using an inside-out membrane patch configuration from a HEK 293 cells transfected with the mSlo BKCa channel cDNA alone. F-J, macroscopic current traces recorded under the same experimental conditions from a HEK 293 cell transfected with the mSlo BKCa channel cDNA and syntaxin 1A. Each set of records represents the average of two families of current traces obtained sequentially under the same conditions. The concentrations of cytoplasmic free calcium are denoted above each set of traces, and the voltage-clamp protocol used at each free calcium concentration is shown in the middle between each pair of current traces. The scale bars displayed below J are applicable to all current tracings shown.
In the presence of nominally free cytoplasmic calcium (e.g. 2 mm EGTA, Fig. 7A), BKCa channels undergo primarily voltage-dependent gating and very positive membrane potentials are required (typically > 100 mV) in order to produce significant channel opening. As cytoplasmic free calcium was raised from low nanomolar to 1, 4, 10 and 100 µm concentrations (Fig. 7B-E), BKCa channel activation shifted to increasingly negative membrane potentials. This effect of calcium on BKCa channel activity is thus consistent with earlier reports characterizing the voltage and calcium-dependent gating of cloned BKCa channels (DiChiara & Reinhart, 1995; Cui et al. 1997; Stefani et al. 1997; Rothberg & Magleby, 2000). Normalized conductance-voltage (G-V) relationships calculated from macroscopic tail currents, as shown in Fig. 7A-E, are plotted in Fig. 8, and demonstrate clearly the leftward shift of BKCa channel gating along the voltage axis with increasing concentrations of free cytoplasmic calcium.
Figure 8. Effect of the presence of syntaxin 1A on normalized G-V relationships (G/Gmaxversus Vm) of mSlo BKCa channels and on half-maximal voltages of activation versus free calcium concentrations for BKCa channel activity.
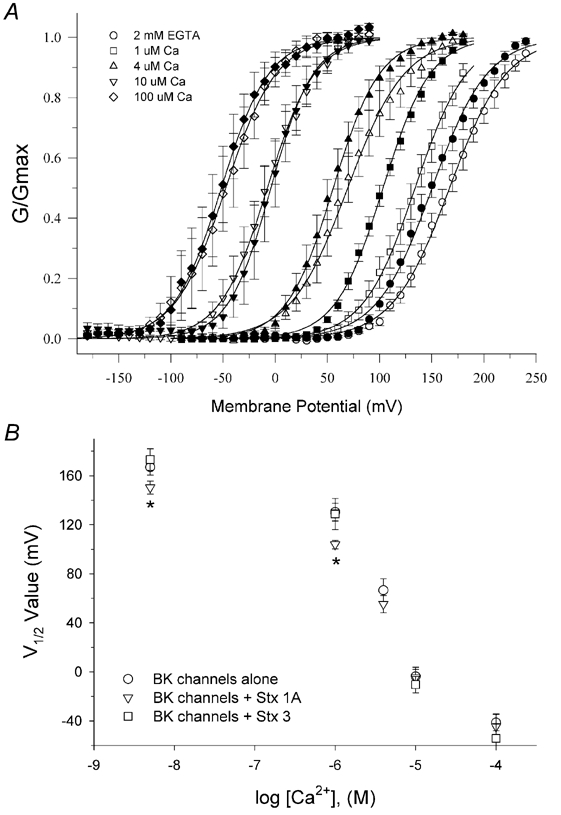
The effects of internal free calcium on the activity of BKCa channels co-expressed with syntaxin 1A are shown in Fig. 8F-J. Under the same recording conditions, syntaxin 1A does not appear to grossly alter the appearance of BKCa channel macroscopic currents. However, calculated G-V relationships for BKCa channels co-expressed with syntaxin 1A reveal that the steady-state activation of BKCa channels is left-shifted by 15-25 mV at low calcium concentrations (4 µm) compared to the same conditions for BKCa channels expressed alone. At a free calcium concentration of 4 µm, syntaxin 1A co-expression did not significantly alter channel gating.
To examine whether the observed changes in the steady-state activation of BKCa currents by co-expression with syntaxin 1A could be accounted for by changes in the kinetic behaviour of the expressed channels, we analysed the time course of current activation and deactivation over a wide range of membrane voltages and free calcium concentrations. Single exponential functions were fitted to the rising phase of currents shown in Fig. 7 and to the decaying phase of tail currents, shown in Fig. 9.
Figure 9. Macroscopic tail current recordings from BKCa channels expressed alone or together with syntaxin 1A.
BKCa channel currents were first activated using a voltage-clamp step to a fixed positive potential, then tail current behaviour was examined over a range of membrane potentials following repolarization. A-E, tail currents recorded from BKCa channel expressed alone at free calcium concentrations ranging from ≈5 nm (2 mm EGTA alone) to 100 µm; tail current recordings from BKCa channels co-expressed with syntaxin 1A at the same free calcium concentrations are shown in F-J. The displayed currents represent the average of two families of traces recorded consecutively at each indicated concentration of free calcium. The scale bars displayed in A are applicable to all current tracings shown.
The derived time constants, or tau values, of current activation and deactivation for BKCa channels expressed alone, or together with syntaxin 1A, are shown in Fig. 10. The data indicate that at low calcium concentrations (0-4 µm), current activation and deactivation were significantly faster and slower, respectively, for BKCa channels co-expressed with syntaxin 1A, compared to BKCa channels expressed alone. However, syntaxin 1A co-expression had no significant effect on the time constants of current activation or deactivation in the presence of either 10 or 100 µm free calcium. These observed kinetic changes thus explain the observed leftward shifts in the steady-state G-V relationships of BKCa channel gating at the same free calcium concentrations, as shown in Fig. 8.
Figure 10. Syntaxin 1A co-expression modifies the time constants of BKCa channel macroscopic current activation and deactivation.

The time courses of macroscopic current activation and deactivation at various free calcium concentrations were derived from single exponential fits of the rising and decaying phases, respectively, of the current traces shown in Figs 6 and 8. A and B are semi-logarithmic plots of the activation and deactivation time constants, respectively, versus membrane potential for macroscopic currents recorded in the presence of increasing free calcium concentrations for BKCa channels expressed alone or together with syntaxin 1A. In each plot, the concentrations of free cytosolic calcium are indicated by symbols as follows: circles, 2 mm EGTA alone; squares, 1 µm calcium; upright triangles, 4 µm calcium; inverted triangles, 10 µm calcium; diamonds, 100 µm calcium. Values represent the means ± s.e.m. calculated from 4-7 individual membrane patches. Continuous lines through the data represent non-linear regression fits, according to the equations: Activation time constant = A*e(−qFVm/RT) Deactivation time constant = A*e(qFVm/RT), where A is the tau value at 0 mV, q = slope of the function, F, Vm, R and T have the same values as defined earlier. In both A and B, the range of tau values for BKCa channel activity in the presence of syntaxin 1A recorded at free calcium concentrations of 0, 1 and 4 µm were found to be significantly different (P < 0.05) than those for BKCa channels expressed alone, as judged by the lack of overlap between the 95 % confidence intervals calculated for each pair of data sets. Using the same criterion, tau values for activation and deactivation were not found to be significantly different at free calcium concentrations of 10 and 100 µm. Finally, there were no clear differences noted for q values derived from non-linear fits of either the activation or deactivation time constants at each concentration of free calcium between BKCa channels expressed alone or together with syntaxin 1A. For fits of the activation and deactivation time constants, the derived values of q ranged from 0.15 to 0.40 and from 0.24 to 0.40, respectively.
DISCUSSION
Given their importance in cellular function and intercellular communication, it is not surprising that the activities of membrane ion channels are regulated by both internal and external signalling mechanisms. Such regulation may involve changes in the patterns of channel openings and closings, or the distribution of channel protein within the cell. In the present study, we report that native rat brain BKCa channels and recombinant BKCa channels cloned from mouse brain or bovine aorta can selectively co-associate with syntaxin 1A, and that this interaction enhances BKCa channel activity at sub-micromolar levels of free cytosolic calcium.
Syntaxin- BKCa channel interactions in rat brain hippocampus
Using a reciprocal co-immunoprecipitation strategy, we detected BKCa channel protein in syntaxin 1A immunoprecipitates and the presence of syntaxin 1A in BKCa channel immunoprecipitates (Fig. 1). This finding indicates that a fraction of both native proteins co-exists within a stable, possibly larger complex that remains intact following detergent solubilization. Interestingly, a similar protein-protein interaction was not detected between native BKCa channels and syntaxin 3, regardless of whether antibodies to either protein were used to carry out immunoprecipitation. As syntaxins 1A and 3 are closely related proteins, such a finding thus demonstrates the selectivity of the observed BKCa channel-syntaxin 1A co-association detected under the same experimental conditions. Also shown in Fig. 1 are important control experiments that demonstrate the validity of the observed BKCa channel-syntaxin 1A interaction. In contrast to a recent report (Fletcher et al. 2003) describing ‘false positive’ interactions for syntaxin 1A, we did not detect either syntaxin 1A or BKCa channel protein in immunoprecipitates from rat hippocampus under conditions in which a monoclonal antibody recognizing an unrelated epitope tag was used (Gussenmeyer et al. 1985; Rubinfeld et al. 1991). Similarly, no specific immunoreactivity was detected when protein isolation was performed using just protein A-Sepharose beads alone, in the absence of a primary antibody (Fig. 1).
Interaction of recombinant proteins in HEK 293 cells
To examine the BKCa channel-syntaxin 1A co-association detected in rat hippocampus under more defined conditions, we carried out similar reciprocal co-immunoprecipitation experiments following transient co-expression of both proteins in HEK 293 cells, a non-neural cell line. As shown in Fig. 2 and Fig. 3, syntaxin 1A was also found to stably interact with BKCa channels originally cloned from either mouse brain or bovine aorta, indicating that syntaxin 1A probably interacted with a conserved domain within the BKCa channel α subunit. The fact that this stable association could be reproduced in a non-neuronal cell suggests further that it does not require additional, neural-specific protein components. Importantly, recombinant syntaxin 1A was not observed in anti-BKCa channel immunoprecipitates from transfected HEK 293 cells in the absence of co-expressed BKCa channels, but was readily detected in anti-syntaxin 1A immunoprecipitates from the same cells (Fig. 2 and Fig. 3). Similarly, BKCa channel immunoreactivity was not detected in anti-syntaxin 1A immunoprecipitates from HEK 293 cells lacking co-expressed syntaxin 1A. These control data, along with those described in Fig. 1, thus demonstrate the fidelity of BKCa channel-syntaxin 1A interaction detected by reciprocal co-immunoprecipitation.
To address whether the level of protein expression influences this observed co-association, we found that co-expression of cloned BKCa channels from either mouse brain or bovine aorta with recombinant syntaxin 3, a closely related syntaxin isoform, did not lead to the formation of stable complexes detectable under the same immunoprecipitation procedure (Fig. 4). This observation thus mirrors our finding in rat hippocampus, and collectively, these control data argue for a selective co-association between BKCa channels and syntaxin 1A in both preparations.
Co-distribution of BKCa channels and syntaxin 1A in intact cells
As co-immunoprecipitation strategies tend to capture stable, as opposed to transient, forms of protein-protein interactions, we anticipated that the association between BKCa channels and syntaxin 1A detected in cellular extracts would also be evident in intact cells by co-immunostaining. As shown in Fig. 5, the staining patterns of BKCa channel and syntaxin 1A proteins display significant overlap in the area of the nucleus/endoplasmic reticulum, as well as cellular domains extending beyond this central region. Using confocal microscopy to achieve higher spatial resolution of these co-staining patterns (Fig. 6), it can be seen that a fraction of expressed BKCa channels and syntaxin 1A co-localizes in situ at distinct sites along the surface membrane. Importantly, this observed overlap of BKCa channel and syntaxin 1A co-immunostaining in situ argues against the likelihood that the stable BKCa channel-syntaxin 1A co-association detected by immunoprecipitation is a consequence of tissue disruption, solubilization and/or manipulation.
While the simplest interpretation of our data is that BKCa channels and syntaxin 1A are capable of direct association in situ, our results do not rule out the possibility that these two proteins may be both bound in a larger, oligomeric complex involving additional protein partners. In this context, we did not detect the presence of other protein components (e.g. Gβ subunit, CSP) in BKCa channel immunoprecipitates from rat hippocampus that have been implicated in modulating the interactions of syntaxin 1A with other membrane ion channels (e.g. N-type calcium channel, Kv1.1; Atlas, 2001; Jarvis & Zamponi, 2001; Michaelevski et al. 2002). It is possible that these regulatory-type proteins do not form the type of stable interactions required for co-immunoprecipitation. In addition to the documented interactions between syntaxin 1A and cystic fibrosis transmembrane conductance regulator (CFTR) or epithelial sodium channels (Saxena et al. 2000; Peters et al. 2001), two groups have recently reported that syntaxin 1A also co-associates with Kv1.1 (Fili et al. 2001) and Kv2.1 (Leung et al. 2003) voltage-gated potassium channels from rat brain and pancreatic islets, respectively. Taken together with our data, these observations suggest that the interaction with syntaxin 1A represents a more general mechanism by which to regulate the activity and/or distribution of multiple membrane ion channels at the cell surface.
Syntaxin 1A modulates the activity of expressed BKCa channels
Using patch-clamp recordings of BKCa channels in excised, inside-out membrane patches from HEK 293 cells, we observed that syntaxin 1A co-expression significantly enhanced channel activity, as judged from normalized G-V relationships (Fig. 7 and Fig. 8). This enhancement occurred primarily at low to modest free cytosolic calcium concentrations (4 µm), but was not observed at higher calcium concentrations (10-100 µm). Co-expression of syntaxin 1A was found to produce leftward shifts of 15-25 mV in the half-maximal voltages of BKCa channel activation (Fig. 8B). Based on the calculated slope values of the fitted Boltzmann functions, such shifts would be expected to increase channel open probability 40-65 % at free cytosolic calcium concentrations less than 4 µm. Interestingly, a similar leftward shift of 20-30 mV in steady-state BKCa channel gating, due to alternative splicing of BKCa channel α subunits, appears to account for differences in the resonant frequency tuning of cochlear hair cells (Ramanathan et al. 1999). Thus, modest shifts in BKCa channel activation, such as those observed here, can give rise to physiological phenomena in excitable cells.
To discern the biophysical process by which syntaxin 1A co-expression mechanistically enhances BKCa channel gating, we performed detailed examination of BKCa channel kinetic behaviour over a wide range of membrane voltages. This revealed that the observed enhancement of gating by syntaxin 1A co-expression could be readily accounted for by increased rates of current activation and slowed rates of deactivation at a given free calcium concentration (Figs 7, 9 and 10). Importantly, these observations demonstrate a functional interaction between syntaxin 1A and BKCa channels in situ that is consistent with the co-association of these two proteins detected by co-immunoprecipitation and co-immunocytochemistry.
Potential role for BKCa channel-syntaxin 1A co-association at neurotransmitter release sites
What might be the functional relevance of this observed effect of syntaxin 1A on BKCa channel activity? Given the reported roles of presynaptic BKCa channels in regulating firing frequency (Roberts et al. 1990; Bielefeldt & Jackson, 1993) and neurotransmitter release (Blundon et al. 1995; Yazejian et al. 1997) at the nerve terminal, one can envision that such an interaction may modulate the excitability of the presynaptic membrane and the efficacy of neurotransmission. Based on functional studies (Llinás et al. 1992; Sabatini & Regehr, 1996; Schneggenburger & Neher, 2000), it has been estimated that the exocytotic release of neurotransmitter from the presynaptic compartment requires elevations in free calcium to levels between 10 and 100 µm. Such estimates are consistent with the modest calcium affinity (Kd ≈10 µm) of the synaptic vesicle protein synaptotagmin in the presence of phospholipids (Lin & Scheller, 2000), which has been implicated as the primary calcium sensor/trigger for the release of neurotransmitter from docked vesicles (Fernandez-Chacon et al. 2001). It is thus possible that the syntaxin 1A-dependent enhancement of BKCa channel activity observed at free calcium concentrations below 4 µm may function as a negative feedback mechanism, or brake, to dampen voltage-dependent calcium channels and prevent small elevations of presynaptic free calcium from triggering unwanted release of neurotransmitter. Sun et al. (1999) have reported that BKCa channels in the presynaptic membrane demonstrate significant activity over physiological voltages at sub-micromolar levels of free calcium. Thus, under basal free calcium conditions, co-associated syntaxin 1A would be predicted to enhance BKCa channel activity, thereby producing a more robust hyperpolarization of the presynaptic membrane. A likely consequence of such enhancement would be a decrease in the activity of presynaptic, voltage-gated calcium channels, non-evoked calcium influx and spurious neurotransmitter release. However, in response to an action potential, producing normal calcium channel opening and a higher elevation of free calcium (e.g. >10 µm), BKCa channel activity would be minimally affected by syntaxin 1A, and neurotransmitter release in response to an action potential would proceed as usual. Along similar lines, Bielefeldt & Jackson (1993) have reported that enhancement of presynaptic BKCa channel activity increases the failure rate of action potential firing in the nerve terminals of the rat posterior pituitary. Such findings illustrate how the observed enhancement of BKCa channel activity by syntaxin 1A may be coupled physiologically to nerve terminal function.
Another possibility that we have not examined in this study is that syntaxin 1A may also play a role in regulating the spatial distribution or membrane targeting of BKCa channels within the plasma membrane or specialized cellular domains, such as the presynaptic compartment. A number of studies have documented that syntaxin 1A can associate with and influence the cell surface distribution of Kv2.1 potassium channels (Leung et al. 2003), CFTR chloride channels (Naren et al. 1998; Peters et al. 1999) and epithelial sodium channels (Qi et al. 1999; Saxena et al. 1999; Peters et al. 2001). The use of GFP-tagged BKCa α subunits and the syntaxin 1A-specific protease botulinum toxin C1 could be used to examine whether the cellular distribution of BKCa channels is similarly affected by syntaxin 1A.
Acknowledgments
The authors would like to thank Mr Jason Kay for his technical support in the preparation of rat hippocampal homogenates and isolation of a cDNA clone encoding rat brain syntaxin 3. The cDNAs encoding the bovine aortic BKCa channel α subunit and rat brain syntaxin 1A were generously provided by Dr Ed Moczydlowski (Yale University) and Dr Gerald Zamponi (University of Calgary), respectively. This study was supported research operating grants from the Heart and Stroke Foundation of Canada (A.P.B.) and Canadian Institutes of Health Research (A.P.B. and J.E.A.B.) and by AHFMR Establishment Awards to A.P.B. and J.E.A.B. Research Scholarships to A.P.B. and J.E.A.B. from the Heart and Stroke Foundation of Canada and the Canadian Institutes of Health Research, respectively, are gratefully acknowledged.
REFERENCES
- Atlas D. Functional and physical coupling of voltage-sensitive calcium channels with exocytotic proteins: ramifications for the secretion mechanism. J Neurochem. 2001;77:972–985. doi: 10.1046/j.1471-4159.2001.00347.x. [DOI] [PubMed] [Google Scholar]
- Bers DM, Patton CW, Nuccitelli R. A practical guide to the preparation of Ca2+ buffers. Methods Cell Biol. 1994;40:3–29. doi: 10.1016/s0091-679x(08)61108-5. [DOI] [PubMed] [Google Scholar]
- Bielefeldt K, Jackson MB. A calcium-activated potassium channel causes frequency-dependent action potential failures in a mammalian nerve terminal. J Neurophysiol. 1993;70:284–298. doi: 10.1152/jn.1993.70.1.284. [DOI] [PubMed] [Google Scholar]
- Blundon JA, Wright SN, Brodwick MS, Bittner GD. Presynaptic calcium-activated potassium channels and calcium channels at a crayfish neuromuscular junction. J Neurophysiol. 1995;73:178–189. doi: 10.1152/jn.1995.73.1.178. [DOI] [PubMed] [Google Scholar]
- Braun AP, Sy L. Contribution of potential EF hand motifs to the calcium-dependent gating of a mouse brain large conductance, calcium-sensitive K+ channel. J Physiol. 2001;533:681–695. doi: 10.1111/j.1469-7793.2001.00681.x. [DOI] [PMC free article] [PubMed] [Google Scholar]
- Braun JEA, Madison DV. A novel SNAP-25-caveolin complex correlates with the onset of persistent synaptic potentiation. J Neurosci. 2000;20:5997–6006. doi: 10.1523/JNEUROSCI.20-16-05997.2000. [DOI] [PMC free article] [PubMed] [Google Scholar]
- Braun JEA, Scheller RH. Cysteine string protein, a DnaJ family member, is present on diverse secretory vesicles. Neuropharmacology. 1995;34:1361–1369. doi: 10.1016/0028-3908(95)00114-l. [DOI] [PubMed] [Google Scholar]
- Catterall WA. Interactions of presynaptic Ca2+ channels and SNARE proteins in neurotransmitter release. Ann NY Acad Sci. 1999;868:144–159. doi: 10.1111/j.1749-6632.1999.tb11284.x. [DOI] [PubMed] [Google Scholar]
- Catterall WA. Structure and regulation of voltage-gated Ca2+ channels. Annu Rev Cell Dev Biol. 2000;16:521–555. doi: 10.1146/annurev.cellbio.16.1.521. [DOI] [PubMed] [Google Scholar]
- Chalfie M, Tu Y, Euskirchen G, Ward WW, Prasher DC. Green fluorescent protein as a marker for gene expression. Science. 1994;263:802–805. doi: 10.1126/science.8303295. [DOI] [PubMed] [Google Scholar]
- Chen S, Zheng X, Schulze KL, Morris T, Bellen H, Stanley EF. Enhancement of presynaptic calcium current by cysteine string protein. J Physiol. 2002;538:383–389. doi: 10.1113/jphysiol.2001.013397. [DOI] [PMC free article] [PubMed] [Google Scholar]
- Cui J, Cox DH, Aldrich RW. Intrinsic voltage dependence and Ca2+ regulation of mSlo large conductance Ca-activated K+ channels. J Gen Physiol. 1997;109:647–673. doi: 10.1085/jgp.109.5.647. [DOI] [PMC free article] [PubMed] [Google Scholar]
- DiChiara TJ, Reinhart PH. Distinct effects of Ca2+ and voltage on the activation and deactivation of cloned Ca2+-activated K+ channels. J Physiol. 1995;489:403–418. doi: 10.1113/jphysiol.1995.sp021061. [DOI] [PMC free article] [PubMed] [Google Scholar]
- Fernandez-Chacon R, Konigstorfer A, Gerber SH, Garcia J, Matos MF, Stevens CF, Brose N, Rizo J, Rosenmund C, Südhof TC. Synaptotagmin I functions as a calcium regulator of release probability. Nature. 2001;410:41–49. doi: 10.1038/35065004. [DOI] [PubMed] [Google Scholar]
- Fili O, Michaelevski I, Bledi Y, Chikvashvili D, Singer-Lahat D, Boshwitz H, Linial M, Lotan I. Direct interaction of a brain voltage-gated K+ channel with syntaxin 1A: Functional impact on channel gating. J Neurosci. 2001;21:1964–1974. doi: 10.1523/JNEUROSCI.21-06-01964.2001. [DOI] [PMC free article] [PubMed] [Google Scholar]
- Fletcher S, Bowden SE, Marrion NV. False interaction of syntaxin 1A with a Ca2+-activated K+ channel revealed by co-immunoprecipitation and pull-down assays: implications for identification of protein-protein interactions. Neuropharmacology. 2003;44:817–827. doi: 10.1016/s0028-3908(03)00049-2. [DOI] [PubMed] [Google Scholar]
- Gussenmeyer T, Scheidtmann KH, Hutchinson MA, Eckhart W, Walter G. Complexes of polyoma virus medium T antigen and cellular proteins. Proc Natl Acad Sci U S A. 1985;82:7952–7954. doi: 10.1073/pnas.82.23.7952. [DOI] [PMC free article] [PubMed] [Google Scholar]
- Hayashi T, McMahon H, Yamasaki S, Binz T, Hata Y, Südhof TC, Niemann H. Synaptic vesicle membrane fusion complex: Action of clostridial neurotoxins on assembly. EMBO J. 1994;13:5051–5061. doi: 10.1002/j.1460-2075.1994.tb06834.x. [DOI] [PMC free article] [PubMed] [Google Scholar]
- Horrigan FT, Aldrich RW. Coupling between voltage sensor activation, Ca2+ binding and channel opening in large conductance (BK) potassium channels. J Gen Physiol. 2002;120:267–305. doi: 10.1085/jgp.20028605. [DOI] [PMC free article] [PubMed] [Google Scholar]
- Issa NP, Hudspeth AJ. Clustering of Ca2+ channels and Ca2+-activated K+ channels at fluorescently labeled presynaptic active zones of hair cells. Proc Natl Acad Sci U S A. 1994;91:7578–7582. doi: 10.1073/pnas.91.16.7578. [DOI] [PMC free article] [PubMed] [Google Scholar]
- Jaggar JH, Porter VA, Lederer WJ, Nelson MT. Calcium sparks in smooth muscle. Am J Physiol. 2000;278:C235–256. doi: 10.1152/ajpcell.2000.278.2.C235. [DOI] [PubMed] [Google Scholar]
- Jahn R, Südhof TC. Membrane fusion and exocytosis. Annu Rev Biochem. 1999;68:863–911. doi: 10.1146/annurev.biochem.68.1.863. [DOI] [PubMed] [Google Scholar]
- Jarvis SE, Magga JM, Beedle AM, Braun JEA, Zamponi GW. G protein modulation of N-type calcium channels is facilitated by physical interactions between syntaxin 1A and Gβγ. J Biol Chem. 2000;275:6388–6394. doi: 10.1074/jbc.275.9.6388. [DOI] [PubMed] [Google Scholar]
- Jarvis SE, Zamponi GW. Interactions between presynaptic Ca2+ channels, cytoplasmic messengers and proteins of the synaptic vesicle release complex. Trends Pharmacol Sci. 2001;22:519–525. doi: 10.1016/s0165-6147(00)01800-9. [DOI] [PubMed] [Google Scholar]
- Ji J, Tsuk S, Salapatek AM, Huang X, Chikvashvili D, Pasyk EA, Kang Y, Sheu L, Tsushima R, Diamant N, Trimble WS, Lotan I, Gaisano HY. The 25-kDa synaptosome-associated protein (SNAP-25) binds and inhibits delayed rectifier potassium channels in secretory cells. J Biol Chem. 2002;277:20195–20204. doi: 10.1074/jbc.M201034200. [DOI] [PubMed] [Google Scholar]
- Laemmli UK. Cleavage of structural proteins during the assembly of the head of bacteriophage T4. Nature. 1970;227:680–685. doi: 10.1038/227680a0. [DOI] [PubMed] [Google Scholar]
- Lamb GD. Excitation-contraction coupling in skeletal muscle: comparisons with cardiac muscle. Clin Exp Pharmacol Physiol. 2000;27:216–224. doi: 10.1046/j.1440-1681.2000.03224.x. [DOI] [PubMed] [Google Scholar]
- Leung YM, Kang Y, Gao X, Xia F, Xie H, Sheu L, Tsuk S, Lotan I, Tsushima R, Gaisano HY. Syntaxin 1A binds to the cytoplasmic C terminus of Kv2. 1 to regulate channel gating and trafficking. J Biol Chem. 2003;278:17532–17538. doi: 10.1074/jbc.M213088200. [DOI] [PubMed] [Google Scholar]
- Lin RC, Scheller RH. Mechanisms of synaptic vesicle exocytosis. Annu Rev Cell Dev Biol. 2000;16:19–49. doi: 10.1146/annurev.cellbio.16.1.19. [DOI] [PubMed] [Google Scholar]
- Llinás RR, Sugimori M, Silver RB. Microdomains of high calcium concentration in a presynaptic terminal. Science. 1992;256:677–679. doi: 10.1126/science.1350109. [DOI] [PubMed] [Google Scholar]
- Lowry OH, Rosebrough NJ, Farr AL, Randall RJ. Protein measurement with the folin phenol reagent. J Biol Chem. 1951;193:265–275. [PubMed] [Google Scholar]
- Magga JM, Jarvis SE, Arnot MI, Zamponi GW, Braun JEA. Cysteine string protein regulates G protein modulation of N-type calcium channels. Neuron. 2000;28:195–204. doi: 10.1016/s0896-6273(00)00096-9. [DOI] [PubMed] [Google Scholar]
- Michaelevski I, Chikvashvili D, Tsuk S, Fili O, Lohse M, Singer-Lahat D, Lotan I. Modulation of a brain voltage-gated K+ channel by syntaxin 1A requires the physical interaction of Gβγ with the channel. J Biol Chem. 2002;277:34909–34917. doi: 10.1074/jbc.M203943200. [DOI] [PubMed] [Google Scholar]
- Moss GWJ, Marshall J, Morabito M, Howe JR, Moczydlowski E. An evolutionarily conserved binding site for serine proteinase inhibitors in large conductance calcium-activated potassium channels. Biochem. 1996;35:16024–16035. doi: 10.1021/bi961452k. [DOI] [PubMed] [Google Scholar]
- Naren AP, Quick MW, Collawn JF, Nelson DJ, Kirk KL. Syntaxin 1A inhibits CFTR chloride channels by means of domain-specific protein-protein interactions. Proc Natl Acad Sci U S A. 1998;95:10972–10977. doi: 10.1073/pnas.95.18.10972. [DOI] [PMC free article] [PubMed] [Google Scholar]
- Pallanck L, Ganetzky B. Cloning and characterization of human and mouse homologs of the Drosophila calcium-activated potassium channel gene, slowpoke. Hum Mol Genet. 1994;3:1239–1243. doi: 10.1093/hmg/3.8.1239. [DOI] [PubMed] [Google Scholar]
- Pellegrini L, O'Conner V, Lottspeich F, Betz H. Clostridial neurotoxins compromise the stability of a low energy SNARE complex mediating NSF activation of synaptic vesicle fusion. EMBO J. 1995;14:4705–4713. doi: 10.1002/j.1460-2075.1995.tb00152.x. [DOI] [PMC free article] [PubMed] [Google Scholar]
- Peters KW, Qi J, Johnson JP, Watkins SC, Frizzel RA. Role of snare proteins in CFTR and ENaC trafficking. Pflügers Arch. 2001;443:S65–69. doi: 10.1007/s004240100647. [DOI] [PubMed] [Google Scholar]
- Peters KW, Qi J, Watkins SC, Frizzel RA. Syntaxin 1A inhibits regulated CFTR trafficking in Xenopus oocytes. Am J Physiol. 1999;277:C174–180. doi: 10.1152/ajpcell.1999.277.1.C174. [DOI] [PubMed] [Google Scholar]
- Qi J, Peters KW, Liu C, Wang J-M, Edinger RS, Johnson JP, Watkins SC, Frizzell RA. Regulation of the amiloride-sensitive epithelial sodium channel by syntaxin 1A. J Biol Chem. 1999;274:30345–30348. doi: 10.1074/jbc.274.43.30345. [DOI] [PubMed] [Google Scholar]
- Ramanathan K, Michael TH, Jiang G-J, Hiel H, Fuchs PA. A molecular mechanism for electrical tuning of cochlear hair cells. Science. 1999;283:215–217. doi: 10.1126/science.283.5399.215. [DOI] [PubMed] [Google Scholar]
- Roberts WM, Jacobs RA, Hudspeth AJ. Co-localization of ion channels involved in frequency selectivity and synaptic transmission at presynaptic active zones of hair cells. J Neurosci. 1990;10:3664–3684. doi: 10.1523/JNEUROSCI.10-11-03664.1990. [DOI] [PMC free article] [PubMed] [Google Scholar]
- Robitaille R, Charlton MP. Presynaptic calcium signals and transmitter release are modulated by calcium-activated potassium channels. J Neurosci. 1992;12:297–305. doi: 10.1523/JNEUROSCI.12-01-00297.1992. [DOI] [PMC free article] [PubMed] [Google Scholar]
- Rothberg BS, Magleby KL. Voltage and Ca2+ activation of single large-conductance Ca2+-activated K+ channels described by a two-tiered allosteric gating mechanism. J Gen Physiol. 2000;116:75–99. doi: 10.1085/jgp.116.1.75. [DOI] [PMC free article] [PubMed] [Google Scholar]
- Rubinfeld B, Munemitsu S, Clark R, Conroy L, Watt K, Crosier WJ, McCormick F, Polakis P. Molecular cloning of a GTPase activating protein specific for the Krev-1 protein p21rap1. Cell. 1991;65:1033–1042. doi: 10.1016/0092-8674(91)90555-d. [DOI] [PubMed] [Google Scholar]
- Sabatini BL, Regehr WG. Timing of neurotransmission at fast synapses in the mammalian brain. Nature. 1996;384:170–172. doi: 10.1038/384170a0. [DOI] [PubMed] [Google Scholar]
- Saxena S, Quick MW, Tousson A, Oh Y, Warnock DG. Interaction of syntaxins with the amiloride-sensitive epithelial sodium channel. J Biol Chem. 1999;274:20812–20817. doi: 10.1074/jbc.274.30.20812. [DOI] [PubMed] [Google Scholar]
- Saxena S, Quick MW, Warnock DG. Interaction of syntaxins with epithelial ion channels. Curr Opin Nephrol Hypertens. 2000;9:523–527. doi: 10.1097/00041552-200009000-00011. [DOI] [PubMed] [Google Scholar]
- Schneggenburger R, Neher E. Intracellular calcium dependence of a transmitter release rates at a fast central synapse. Nature. 2000;406:889–893. doi: 10.1038/35022702. [DOI] [PubMed] [Google Scholar]
- Sheng Z-H, Rettig J, Takahashi M, Catterall WA. Identification of a syntaxin-binding site on N-type calcium channels. Neuron. 1994;13:1303–1313. doi: 10.1016/0896-6273(94)90417-0. [DOI] [PubMed] [Google Scholar]
- Stefani E, Ottolia M, Noceti F, Olcese R, Wallner M, Latorre R, Toro L. Voltage-controlled gating in a large conductance Ca2+-sensitive K+ channel (hslo) Proc Natl Acad Sci U S A. 1997;94:5427–5431. doi: 10.1073/pnas.94.10.5427. [DOI] [PMC free article] [PubMed] [Google Scholar]
- Stern MD, Lakatta EG. Excitation-contraction coupling in the heart: the state of the question. FASEB J. 1992;6:3092–3100. doi: 10.1096/fasebj.6.12.1325933. [DOI] [PubMed] [Google Scholar]
- Sun X-P, Schlichter LC, Stanley EF. Single-channel properties of BK-type calcium-activated potassium channels at a cholinergic presynaptic nerve terminal. J Physiol. 1999;518:639–651. doi: 10.1111/j.1469-7793.1999.0639p.x. [DOI] [PMC free article] [PubMed] [Google Scholar]
- Toro L, Wallner M, Meera P, Tanaka Y. Maxi-KCa, a unique member of the voltage-gated K channel superfamily. News Physiol Sci. 1998;13:112–117. doi: 10.1152/physiologyonline.1998.13.3.112. [DOI] [PubMed] [Google Scholar]
- Yazejian B, DiGregorio DA, Vergara J, Poage RE, Meriney SD, Grinnell AD. Direct measurements of presynaptic calcium and calcium-activated potassium currents regulating neurotransmitter release at cultured Xenopus nerve-muscle synapses. J Neurosci. 1997;17:2990–3001. doi: 10.1523/JNEUROSCI.17-09-02990.1997. [DOI] [PMC free article] [PubMed] [Google Scholar]