


Abstract
Molecular beacons represent a new family of fluorescent probes for nucleic acids, and have found broad applications in recent years due to their unique advantages over traditional probes. Detection of nucleic acids using molecular beacons has been based on hybridization between target molecules and molecular beacons in a 1:1 stoichiometric ratio. The stoichiometric hybridization, however, puts an intrinsic limitation on detection sensitivity, because one target molecule converts only one beacon molecule to its fluorescent form. To increase the detection sensitivity, a conventional strategy has been target amplification through polymerase chain reaction. Instead of target amplification, here we introduce a scheme of signal amplification, nicking enzyme signal amplification, to increase the detection sensitivity of molecular beacons. The mechanism of the signal amplification lies in target-dependent cleavage of molecular beacons by a DNA nicking enzyme, through which one target DNA can open many beacon molecules, giving rise to amplification of fluorescent signal. Our results indicate that one target DNA leads to cleavage of hundreds of beacon molecules, increasing detection sensitivity by nearly three orders of magnitude. We designed two versions of signal amplification. The basic version, though simple, requires that nicking enzyme recognition sequence be present in the target DNA. The extended version allows detection of target of any sequence by incorporating rolling circle amplification. Moreover, the extended version provides one additional level of signal amplification, bringing the detection limit down to tens of femtomolar, nearly five orders of magnitude lower than that of conventional hybridization assay.
INTRODUCTION
Molecular beacons are a novel class of probes that fluoresce upon hybridization with target nucleic acids (1). A molecular beacon is a hairpin-shaped single-stranded oligonucleotide that is labeled with a fluorophore at one end and a quencher at the other end. By itself in solution, the oligonucleotide adopts a stem-and-loop structure. The loop portion is a probe sequence that is complementary to a target sequence. Flanking the loop are two short, target-unrelated, complementary arm sequences that form the stem by intramolecular base pairing. The stem holds the fluorophore and quencher close to each other, quenching the fluorescence of the fluorophore. In the presence of target nucleic acids, the loop portion hybridizes to the target, and forms a probe-target hybrid that is longer and more stable than the short stem. During hybridization, the beacon molecule goes through a conformational change, from the hairpin shape to a more rigid, rod-like double helix, and the two arms are forced to move away from each other. As a result, the fluorophore and quencher are separated from each other, restoring the fluorescence. Thus, an increase in the fluorescence of molecular beacons reports directly the presence of a target nucleic acid, and there is no need to separate the unhybridized probes from the hybridized ones. This ‘switching-on’ working feature makes molecular beacons useful for the detection of nucleic acids in homogeneous solution and in living cells, where hybridized and unhybridized probes are not separable. The hairpin-shaped structure also confers molecular beacons another feature, the high specificity in recognizing the target sequence, which makes it possible to discriminate even a single base mismatch (1,2). These two features, especially the “switching on’ working mode, attributes to the fast growing number of applications of molecular beacons in recent years.
The miscellaneous applications of molecular beacons can be categorized into two basic types: indirect detection that relies on target amplification, and direct detection without target amplification. For indirect detection, the most commonly used target amplification technique is polymerase chain reaction (PCR). Combining PCR with molecular beacons leads to one type of real-time PCR (3). Using real-time PCR, various pathogens, such as HIV, and nucleic acids from different sources have been detected (4–12); gene mutation and single nucleotide polymorphism (SNP) have been characterized (13–16). By synthesizing beacons with different fluorophores, real-time PCR can be conducted in multiplex formats so that multiple genes can be quantified in the same tube (5,6,13,17). Besides PCR, other techniques, such as nucleic acids sequence-based amplification (NASBA), have also been used to amplify the targets (18–22). For direct detection, molecular beacons can directly identify DNA/RNA in solution, on surfaces, and in live cells. Solution-based detection is the most convenient one, and the results showed nice reproducibility as well as good linear relationship between target concentration and fluorescence intensity (23,24). Surface-based detection has been practiced in order to develop new types of sensors and microarrays, for which the traditional washing step is eliminated (25,26). Although living cell-based detection is challenging, recent results are starting to provide information on messenger RNA distribution and translocation inside individual living cells, and engineered messenger RNA can be followed at single molecule level in real time by inserting many beacon-binding sites along one RNA molecule (27–31). As a comparison between the two detection formats, indirect detection provides higher sensitivity through target amplification, while direct detection offers simplicity and convenience as well as the opportunity to detect the target in instances where target amplification seems impossible, as in living cells. Irrespective of the difference, both detection formats have shown that molecular beacons hold great potential as excellent probes for nucleic acids. It is interesting to notice that, although molecular beacons were originally developed to probe nucleic acids, recent years have observed the application of molecular beacons in protein detection (32,33). Especially, the integration between aptamers and molecular beacons has enabled the identification of specific proteins (34–36). Driven by these applications, the structure of molecular beacons has evolved in different ways. For example, quantum dots have been adopted as fluoropore to increase the brightness (37). Gold nano-particles and multiple quencher oligomers have been used to lower the background (38,39). PNA, locked DNA and 2-O-methyl oligoribonucleotides have been practiced to replace DNA for the synthesis of molecular beacons to enhance their resistance to DNA nucleases so as to facilitate RNA imaging in live cells (29–31,40–45).
Despite of the variety of applications and the evolvement of the structure of molecular beacons, one basic principle behind the detection of nucleic acids remains unchanged: the generation of a fluorescent signal is based on hybridization between target molecules and molecular beacons in a 1:1 stoichiometric ratio. Under this principle, one target causes only one beacon molecule to open to fluoresce. While the 1:1 stoichiometry in hybridization provides an excellent linearity for target quantitation, it also sets a limitation for the sensitivity of detection, because the number of beacon molecules one target molecule can open cannot exceed one. Normally, molecular beacons are sensitive enough for direct quantitation of nucleic acids down to nanomolar range (23,24); to detect lower concentration, however, a target amplification technique, usually PCR, is needed.
Recently, two novel approaches for signal amplification have been exploited in an attempt to improve the sensitivity of molecular beacons in the absence of target amplification (46,47). In both approaches, the structures of the molecular beacons were integrated with certain catalytic DNAzymes in such a way that the DNAzymes were not activated until the target DNA hybridized to the molecular beacon. The enzymes can convert substrate molecules into product molecules that have either fluorescence or unique UV absorption. One target DNA can activate one enzyme molecule, and the latter can catalyze many cycles of conversions, leading to an accumulation of optical signals. Therefore, enzymatic signal amplification is involved in both methods. This contrasts with traditional stoichiometric molecular beacons that give out only one signal (one opened beacon) in response to one hybridization event. In principle, signal amplification should mean that the two methods’ sensitivity is significantly higher than that of stoichiometric beacons. However, both approaches showed sensitivity similar to or even lower than that of stoichiometric beacons, with 2 nM of target detectible for the first method (46), and 200 nM for the second (47). The low sensitivity is mainly due to the low turnover number of the enzymes, high background fluorescence of the substrates and residue activity of the enzymes in the absence of target molecules (46,47).
Here we take advantage of the DNA nicking enzymes to create a new signal-amplifying mechanism, nicking enzyme signal amplification (NESA), to increase the sensitivity of molecular beacons. In NESA, fluorescent signal is amplified through target-dependent cleavage of molecular beacons, by which one target DNA leads to the opening of many beacons. Signal amplification brings about significant increase in the sensitivity of DNA detection. We introduced two versions of NESA, basic and extended. Basic NESA allows the detection of DNA in the picomolar range, increasing detection sensitivity by about three orders of magnitude, as compared to conventional hybridization assay. Extended NESA was developed by integrating basic NESA with rolling circle amplification (RCA). Extended NESA further boosts the sensitivity by nearly two orders of magnitude, lowering detection limit down to the femtomolar range.
MATERIALS AND METHODS
Reagents and instruments
All enzymes and buffers were purchased from New England Biolabs. Molecular beacons and DNA oligonucleotides for NESA, hybridization and RCA assays were synthesized by Integrated DNA Technologies; all other oligonucleotides were from MWG Biotech. Fluorescence detection was conducted on either a spectrofluorometer (SPEX Fluolog-3, Horiba Jobin Yvon) or a real-time PCR machine (MX3000, Stratagene).
Molecular beacon and oligonucleotides for basic NESA and hybridization assays
Molecular beacon 1: 5′-/FAM/GCACGC TAGATGAGTCCGTC↓CTGCTGCGTGC/DABCYL/-3′. The bold letters at the two ends represent the sequence of the beacon arms; the underlined bold letters are the recognition sequence of N.BstNB I, and the arrow indicates the nicking position. The beacon is labeled with a fluorophore, FAM, at the 5′ end, and a quencher, DABCYL, at the 3′ end. Both labeled moieties were conjugated to the beacon via a C6 linker. Target DNA: 5′-AGCAGGACGGACTCAT-3′. Arbitrary sequence of DNA as negative control: 5′-GGAGAGAAGAGGGAAA-3′. Target sequences with single base mismatches, as indicated by underlined letters, are shown below:
a: 5′-AGCAGGACGGACTGAT-3′
b: 5′-AGCAGGACGGAGTCAT-3′
c: 5′-AGCAGGAGGGACTCAT-3′
d: 5′-AGGAGGACGGACTCAT-3′
e: 5′-AGCAGGACGGACTCAA-3′
f: 5′-TGCAGGACGGACTCAT-3′
Molecular beacon and oligonucleotides for RCA and extended NESA assays
Molecular beacon 2: 5′-/Cy5/GCGA GTCCGTCCTGCT mUmCmGmC/BHQ_2/-3′. Bold letters represent the bases in the two arms of the beacon; ‘m’ stands for 2-O-methyl modification on the sugar ring. The beacon is labeled with Cy5 at the 5′ end and Black Hole Quencher 2 at the 3′ end, respectively, via a flexible C6 linker. Both the loop and 5′ arm are used for hybridization with the RCA product. Padlock probe for RCA: 5′-/5Phos/CCTCCCATCATATTAAAGGCTTTCTCATTGTTgcgagtccgtcctgctAAGTG ACCTTCTAGTTCCGTCCATACTAAGGCATTCTGGAAACAT -3′. The 40 bold letters at both ends represent the target-binding sequence; underlined letters stand for primer-binding sequence; sequence in lower case letters are identical to the sequence of the 5′ arm and the loop of molecular beacon 2. Primer: 5′- ATG TTT CCA GAA TGC CTT AGT ATG GAC GGA ACT AGA AGG T -3′. Target DNA: 5′- GCC TTT AAT ATG ATG GGA GGA TGT TTC CAG AAT GCC TTA G -3′. Two DNA of random sequences: R1, 5′-GTGAG CATAC TTAAT CCAGC CTACG TGACA CAGTG CAATG; R2, 5′-AGCAT ACTTA ATCCA AAAATT GTCAG ACAGT GTTAC TCAGC. Target sequences with single base mismatches, as indicated by underlined letters, are shown below:
-2: 5′-GCCTT TAATA TGATG GGACG ATGTT TCCAG AATGC CTTAG-3′
-1: 5′-GCCTT TAATA TGATG GGAGC ATGTT TCCAG AATGC CTTAG-3′
1: 5′-GCCTT TAATA TGATG GGAGG TTGTT TCCAG AATGC CTTAG-3′
2: 5′-GCCTT TAATA TGATG GGAGG AAGTT TCCAG AATGC CTTAG-3′
3: 5′-GCCTT TAATA TGATG GGAGG ATCTT TCCAG AATGC CTTAG-3′
4: 5′-GCCTT TAATA TGATG GGAGG ATGAT TCCAG AATGC CTTAG-3′
Basic NESA assay
Each reaction was followed by recording over time the fluorescence intensity of the reaction mixture. The excitation and emission wavelengths were 488 nm and 520 nm, respectively. In Figure 2a, fluorescence intensity was recorded in four stages. In the first stage, 162 µl of water and 20 µl of NEB buffer 3 (10×) was added to a fluorescence cuvette, and mixed by pipetting. The cuvette was placed into the sample holder of a spectrofluorometer (SPEX Fluolog-3, Horiba Jobin Yvon). The sample holder was preheated up to 55°C with a circulating water bath, and the cuvette was left in the sample holder for about 6 min until the temperature of the solution inside the cuvette reached 55°C. Fluorescence intensity was recorded for about 5 min as the background of buffer. In the second stage, 4 µl of molecular beacon 1 (10 µM) was added, and fluorescence intensity was recorded for about 5 min as the background of the beacon solution. In the third stage, 4 µl of target DNA (20 µM) was added, and fluorescence intensity was monitored to follow the hybridization process until the fluorescence intensity reached a plateau. In the final stage, 10 µl of N.BstNB I (10 U/µl) was added, and the fluorescence intensity was monitored to track the nicking reaction until the fluorescence intensity plateaued. The final reaction volume was 200 µl, and the final concentrations of the reaction components were 50 mM Tris–HCl (pH 7.9 at 25°C), 100 mM NaCl, 10 mM MgCl2, 1 mM DTT (dithiothreitol), 200 nM molecular beacon 1, 400 nM target DNA and 0.5 U/µl N.BstNB I, respectively. Each time a component was added, the cuvette was taken out of the sample holder, the component added, the solution mixed by pipetting three times and the cuvette put back into the sample holder. Adding a component took about 15 s, which corresponds to the gap between neighboring stages in the plotted time course. In Figure 2a, the fluorescence intensity in the first stage (background of buffer) was not shown, and the background of the buffer had already been accounted for and subtracted from the subsequent stages when the data was plotted. For Figure 2b, the experimental procedures were the same as those for Figure 2a except for one change: the concentration of the target DNA in the stock solution decreased from 20 µM to 100 nM. As a result, the final concentration of the target DNA decreased from 400 to 2 nM. In Figure 3a, a series of concentrations of target DNA were tested using procedures similar to those for Figure 2. The concentrations for the target DNA stock solution were 1 µM, 100 nM, 10 nM, 1 nM, 0 nM, and, correspondingly, the final concentrations of the target were 20 nM, 2 nM, 200 pM, 20 pM, 0 pM, respectively. It is noteworthy that, in Figure 3a, only the time courses for the nicking reactions were presented. For the construction of the standard curve in figure 6a, eight final concentrations of the target were examined: 20 nM, 10 nM, 2 nM, 1 nM, 200 pM, 100 pM, 20 pM, 0 pM. The experiments were repeated four times.
Figure 2.

Time courses for basic NESA at target concentrations of 400 nM (a) and 2 nM (b), respectively. Each time course consists of three stages: background of molecular beacon, hybridization and nicking reaction. The gap between the stages corresponds to about 15 s during which the sample was taken out of the spectrofluorometer and a new component added. The final concentration of the molecular beacon is 200 nM for both time courses.
Figure 3.

Test of the detection limit of basic NESA and traditional hybridization assay. Time courses were recorded for each assay at a series of dilutions of the target. (a) Time courses for basic NESA. (b) Time courses for hybridization.
Hybridization assay
The assay was conducted using the same procedures as those of the basic NESA in Figure 3a except for two changes. First, the volume of water added in the first stage was increased from 162 to 172 µl in order to keep the final concentration of each reaction component consistent with those in the basic NESA. The other change was the omission of the fourth stage, since nicking reaction was not involved. In the end, 172 µl of water and 20 µl of NEB buffer 3 was added in the first stage; 4 µl of molecular beacon 1 (10 µM) was added in the second stage; 4 µl of target DNA stock solution of a specific concentration was added in the third stage. Six stock solutions of target DNA were used, 20 µM, 1 µM, 100 nM, 10 nM, 1 nM, 0 nM, which corresponds to six final concentrations, 400 nM, 20 nM, 2 nM, 200 pM, 20 pM, 0 pM, respectively. In Figure 3b, only the third stage, the time course for hybridization, was presented.
RCA assay
Two steps were involved: ligation and polymerization. For ligation, nine samples of target and arbitrary DNA were prepared. First, a MaxMix solution was prepared which includes all components for the ligation reaction except for the target DNA and negative control oligonucleotides. The components added into the MaxMix were 202.5 µl of water, 45 µl of NEBuffer 3 (10×), 4.5 µl of BSA (100×), 45 µl of ATP (10 mM), 40.5 µl of DTT (100 mM), 4.5 µl of padlock probe (100 nM), 13.5 µl of T4 ligase (400 U/µl). The total volume of the MaxMix was 355.5 µl. Then, into each of nine microcentrifuge tubes (0.5 ml), 39.5 µl of the MaxMix was pipetted. Finally, 5 µl of each target DNA with a specific concentration (seven stock solutions were prepared: 10 nM, 1 nM, 100 pM, 10 pM, 5 pM, 1 pM, 0 pM) was added into each of seven of the nine tubes. Five micro liters of the two arbitrary DNA (the concentration is 1 nM for both) was added into each of the two remaining tubes. This brought the total volume of each sample to 44.5 µl. The samples were left at room temperature for 20 min to finish the ligation, and heated to 65°C for 15 min to inactivate the T4 ligase. For polymerization, unless specified, all of the following operations were done at 4°C to curb polymerization before data collection. To the ligation mixture, 1.5 µl of primer (100 nM), 1 µl of dNTP (25 mM for each deoxynucleoside triphosphate), 0.5 µl of molecular beacon 2 (15 µM) and 2.5 µl of phi29 DNA polymerase (10 U/µl) were added, bringing the total volume of each sample to 50 µl. The final concentrations of the common reaction components were: 1× NEB buffer 3, 1× BSA, 1 mM ATP, 9 mM DTT, 0.5 mM each dNTP, 1 nM padlock probe, 3 nM primer, 0.5 U/µl phi29 DNA polymerase and 150 nM molecular beacon 2. The final target concentration for each of the seven target DNA samples is 1000 pM, 100 pM, 10 pM, 1 pM, 0.5 pM, 0.1 pM, 0 pM, respectively, while the final concentrations for the two arbitrary DNA are both 1 nM. Nine microliters of each reaction mixture was then pipetted into each of five specified wells in a 96-well real-time PCR plate. After all nine samples were transferred into the 45 specified wells, the plate was centrifuged (1000 g) for 2 min at 4°C, and loaded onto a MX3000 real-time PCR machine (Stratagene). Here, the real-time PCR machine was used simply as a plate reader. The filter set for Cy5 was chosen for excitation and emission. The plate temperature was brought up to 37°C to start polymerization, and the fluorescence intensity of each sample well was monitored in real time for about 2 h. The time courses of several samples are shown in figure 5a.
Extended NESA assay
After recording the polymerization process, the sample plate was taken out and heated to 65°C for 15 min to inactivate phi29. The plate was then centrifuged at 1000 g for 2 min, and put on ice. To each well containing a sample, 1 µl of N.BstNB I (10 U/µl) was added. The plate was then vortexed, and centrifuged at 1000 g at 4°C for 2 min. The plate was put back into the real-time PCR machine to monitor the nicking process at 55°C. The nicking reaction was followed and recorded for about 3 h. Figure 5b shows the results of some samples.
Figure 5.

Time course of extended NESA at various target concentration. All time courses are divided into two stages: RCA (a) and nicking (b). RCA was conducted without the nicking enzyme, and nicking reaction started after the nicking enzyme was added into the finished RCA reaction mixture. Seven concentrations of target were examined: 1 nM, 100 pM, 10 pM, 1 pM, 0.5 pM, 0.1 pM, 0. In (a), target concentrations <10 pM are not shown since they were not detectable. In (b), target concentrations >10 pM are omitted because the majority of beacon molecules were already opened at RCA stage.
Determination of detection limit
Here the detection limit is defined as the concentration of target that yields a net signal (total signal minus background) equivalent to three times the standard deviation of a series of replicates of background. Total signal and background refer to fluorescent intensity or initial reaction speed of the reaction mixture with and without target DNA, respectively. To determine the detection limit, the target concentration was lowered step by step until a concentration, Cx, was reached to yield a total signal that was close to, yet still apparently higher than, background. At this concentration, the total signal, S, and the background, B, were both measured for n times. The detection limit, Cl, was calculated according to the following equation:
R is the ratio of the average net signal at Cx to the standard deviation of the background:
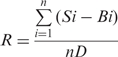 |
D is the standard deviation of n measurements of background. In this article, n = 4. For hybridization assay, the total signal and background of each measurement refer to the average fluorescence intensity for the last 100 time points in a time course with and without target, respectively. For NESA and RCA assays, the total signal and background refer to initial reaction speed in the presence and absence of target, respectively.
RESULTS
Design of basic NESA
Figure 1 shows the principle of basic NESA. In NESA, signal amplification is achieved through target-dependent cleavage of molecular beacons. A molecular beacon cleavage assay was reported previously (48). In that assay, molecular beacons were cleaved by various DNA nucleases, and the reaction could be followed in real time by monitoring the fluorescence intensity of molecular beacons. The assay provides a convenient way to characterize the activity of DNA nucleases and to study the kinetics of the cleavage reaction of single-stranded DNA. However, it cannot be used to detect DNA because the cleavage reaction occurs in the absence of target DNA. To link the cleavage of beacons to target DNA, we improve the assay in such a way that the cleavage of beacons is dependent on the hybridization between the beacon and target. For this purpose, a special family of restriction endonucleases, DNA nicking enzymes, is introduced for beacon cleavage (49–51). DNA nicking enzymes occur either naturally or via gene engineering. Like normal restriction endonucleases, nicking enzymes can recognize a specific sequence along a double-strand DNA; however, they hydrolyze only one specific strand instead of both strands, leaving a nick in the DNA. As shown in Figure 1, a nicking enzyme recognition sequence is embedded into the loop portion of a molecular beacon. Unlike DNA nucleases used in the previous assay, nicking enzymes do not cut single-stranded DNA. When the target strand, which is designed to be complementary to the loop portion of the beacon, hybridizes to the beacon, a full recognition site forms for the nicking enzyme. The enzyme can then bind to and nick the hybrid. While either strand can be selected for cleavage, we chose the beacon strand to cleave in order to achieve signal amplification. After nicking, the hybrid becomes less stable, and the cleaved beacon dissociates from the target. The released target strand can then hybridize to another beacon and initiate the second cycle of cleavage. Eventually, each target strand can go through many cycles, resulting in cleavage of many beacons. In each cycle, the beacon opens upon binding to the target, and the fluorophore and quencher move away from each other, restoring the fluorescence of the fluorophore. After cleavage, the two fragments of the cleaved beacon dissociate from the target and diffuse away from each other, resulting in the complete separation of the fluorophore from the quencher. Thus, one target molecule restores the fluorescence of many beacons after an equal number of cycles. In traditional hybridization assay, in contrast, one target causes only one beacon to open to fluoresce. Therefore, what was an undetectable amount of target to the traditional stoichiometric beacon may become detectable through NESA.
Figure 1.

Working principle of basic NESA. Single-stranded target DNA contains the recognition sequence of a nicking enzyme. A molecular beacon is designed with its loop sequence complementary to the target. When one target molecule hybridizes with one beacon molecule, a full recognition site forms for the nicking enzyme to cleave the beacon strand. The nicking enzyme binds to the hybrid, and makes a nick in the beacon strand. After nicking, the complex dissociates, finishing one reaction cycle. The net result of one reaction cycle is a cleaved molecular beacon. The target molecule and nicking enzyme can be re-used for next cycle of cleavage. This way, each target can go through many cycles, resulting in cleavage of many beacon molecules. In each cycle, one target causes one beacon molecule to open and fluoresce, contributing one beacon signal. After N (N is an integer) cycles, one target gives rise to N beacons signals, achieving a linear signal amplification.
Test basic NESA
To test the idea of NESA, first we needed to choose a nicking enzyme. There are only a limited number of commercially available nicking enzymes. One of them, N.BstNB I, has optimal activity at 55°C, while the others prefer 37°C. Higher temperature should facilitate faster hybridization and subsequent dissociation of DNA in a nicking reaction. We compared the activity of three nicking enzymes, N.Bbvc IA, N.Bbvc IB and N.BstNB I, at their optimal working temperature. As we expected, N.BstNB I has the highest nicking activity, making it the enzyme of choice. Based on the recognition sequence of N.BstNB I, we designed the target and beacon with artificial sequences. The beacon contains the N.BstNB I recognition sequence in the middle of its loop portion. The target is complementary to the loop sequence of the beacon. Therefore, when the beacon and target hybridize, a full recognition site for N.BstNB I forms.
We examined NESA reaction at different target concentrations by monitoring the fluorescence intensity of the beacon on a spectrofluorometer (Figure 2). To better analyze NESA, we separated the initial hybridization stage from the nicking stage by postponing the adding of N.BstNB I. That is, the nicking enzyme was not added until the hybridization finished. Figure 2a shows the time course for hybridization and nicking reaction at high target concentration. The final concentration of the beacon and the target are 200 nM and 400 nM, respectively. The time course started with the background of the beacon. When an excess of target DNA was added into the beacon solution, fluorescence intensity immediately jumped to the maximum, indicating fast hybridization. The gap in the time course curve corresponds to a period of time of about 15 s, during which the sample was taken out of the spectrofluorometer, and target added. It is noteworthy that the fluorescence intensity decreased slightly after the maximum point. The decrease is due to the sticky ends pairing effect reported previously (52). The two arms of a stem change into sticky ends when a beacon molecule hybridizes to its target using only its loop portion. One hybrid's sticky ends can hybridize to another's, bringing the fluorophore and quencher together again, thereby quenching fluorescence. Many factors influence the stability of the paired sticky ends, which include temperature, ion strength, concentration of the beacon, sequence and length of the sticky ends, etc. We estimated, using the previously reported method, that about 15% of beacons were involved in sticky end pairing under our experimental conditions (52). At the final stage in Figure 2a, N.BstNB I was added after hybridization finished. An additional 30% increase in fluorescence intensity was subsequently observed, suggesting that the nicking reaction occurred, which completely separated the fluorophore and quencher.
The quenching in fluorescence in Figure 2a occurs at three levels, which correspond to the three levels of separation between the fluorophore and quencher: closed state, hybrid state and cleaved state. At closed state, the two moieties are kept in such a close proximity by the stem that they two are actually in contact; at hybrid state, they are separated by a rigid double helix in between; at cleaved state, they are completely separated. Depending on the distance between the fluorophore and quencher, the fluorescence quenching mechanism has been interpreted by two theories: exciton coupling (or contact quenching) when the pair are in contact, and the Förster-type fluorescence resonance energy transfer (FRET) when they are separated by about 2–10 nm (53–56). Previous study on many fluorophore–quencher pairs indicates that the efficiency of quenching by exciton coupling is always greater than that by FRET (54). At the closed state of the beacon, exciton coupling is the predominating quenching mechanism; at the hybrid state, the separation between the two moieties is roughly 10.5 nm (presuming the two short sticky ends are also straightened in the same direction of the double helix in between, and that the length of the linkers is neglected), bringing about weak FRET. In the cleaved state, there is no significant interaction between the two moieties. Therefore, the quenching efficiency went through three levels, high, low and zero, when the beacon experienced closed, hybrid and cleaved state sequentially. This explains the three levels of fluorescence in Figure 2a. This observation is consistent with the previous report that cleaved beacons showed higher fluorescence intensity than hybridized beacons (48).
For the nicking reaction in Figure 2a, several more points are noteworthy. First, the nicking reaction was quick. The fluorescence intensity plateaued right after mixing, indicating that nearly all the beacons were cleaved within 15 s. Second, in the cleaved state, the fluorescence intensity increased by about 5-fold, and this value is significantly lower than that reported previously (48). This was mainly due to the high reaction temperature used, 55°C, which caused some of the closed beacons to open up even before the target molecules were added. Third, we noticed that the intensity continued to increase slowly after reaching a plateau. This might be caused by the contamination of the N.BstNB I with DNA nucleases that further cleaved the paired sticky ends. As mentioned before, paired sticky ends should remain paired after the beacons were nicked, because nicking did not destroy the arm sequence of the beacons. However, these paired sticky ends can be digested nonspecifically by DNA nucleases.
It can be seen from Figure 2a that, when the target concentration is high, a hybridization assay can produce enough signals for target detection. Thus, it is not necessary to introduce the nicking reaction even though nicking can further enhance the signal. We then lowered the concentration of the target by 200 times, with a final concentration of 2 nM, to see whether we could still detect the target. As shown in Figure 2b, no apparent increase in fluorescence intensity was observed when the target was added. This showed that the target concentration was already below the detection limit of the hybridization assay. We then added N.BstNB I to the reaction mixture, and a rise in fluorescence intensity was visible instantaneously, signifying a quick cleavage of the beacons. This indicates that 2 nM of the target became detectible immediately after the nicking enzyme was added. The intensity continued to increase until a plateau was reached in about half an hour when all beacons were cleaved. Upon completion of the nicking reaction, the fluorescence intensity was increased by nearly 5-fold, which is consistent with the fluorescence enhancement in Figure 2a. Since the molar ratio of the target to the beacon is 1:100, we estimate that, on average, one target molecule led to the cleavage of 100 beacon molecules. In conventional hybridization assay, in contrast, one target molecule can open only one beacon molecule. Considering as well that the beacon in the cleaved state is brighter than the beacon in the hybrid state, the signal amplification in Figure 2b is actually more than 100-fold compared to the hybridization assay. This shows how NESA enables the otherwise undetectable amount of target detectible. Moreover, the assay is target specific. DNA of random sequence failed to produce a significant signal change (Figure 2S, supplementary data).
We subsequently examined the detection limit of the basic NESA assay. In Figure 3a, we recorded more time courses for the cleavage reaction at a series of dilutions of the target. The fluorescent signal was not recorded until after the nicking enzyme was added. With the target concentration decreasing, the nicking reaction slowed down. The half reaction time (time required to cleave 50% of the beacons) increased from 0.7 to 7 min and 73 min when the target concentration decreased from 20 to 2 nM and 200 pM, respectively. When the target concentration decreases by 10-fold, the half reaction time increases by about 10-fold, suggesting that the cleavage speed is proportional to the concentration of the target. This is not surprising if we envision these targets as ‘mobile catalytic sites’ for the nicking reaction to occur: the less the catalytic sites, the slower the nicking speed. When the target concentration dropped to 20 pM, we did not see apparent changes in fluorescent signal, compared to 0 pM (negative control), until after 1 h. The slow signal increase in the 0 pM time course might reflect the contamination of the nicking enzyme by DNA nucleases, as we mentioned before. We repeated four times the time courses for 20 pM and 0 pM samples, and estimated the detection limit for basic NESA to be about 6.2 pM.
We are interested in N, the average number of beacon molecules cleaved by each target molecule for each time course experiment in Figure 3a. For target concentrations of 20 nM and 2 nM, all beacons were cleaved at the end of data collection. Given the beacon concentration of 200 nM for all time courses, N was calculated to be about 10 and 100, respectively. When the target concentration decreased to 200 pM, about 58% of beacons were cleaved after 2 h, and N reached ∼580. At a target concentration of 20 pM, only 5.4% of beacons were cleaved, and N was estimated to be 540 beacons. It is worth mentioning that the number of beacons degraded by nonspecific cleavage (as indicated by the 0 pM time course) was subtracted from the total number of cleaved beacons in the calculation. N does not further increase when target concentration decreases from 200 to 20 pM, suggesting that the target molecules were already saturated by substrates in both cases. Judging from the trend of the 200 pM and 20 pM time course curves, more beacons would be cleaved with increasing time. Therefore, the maximum of N should be larger than the numbers we obtained here.
To compare our results with the hybridization assay, we also recorded time courses for hybridization at different target dilutions (Figure 3b). The detection limit was calculated to be about 4.2 nM for the hybridization assay. Thus, the sensitivity of molecular beacon was improved by nearly 700-fold through NESA. This enhancement in sensitivity is consistent with the number of molecular beacons one target can cleave, considering the additional increase in fluorescence intensity when the beacons went from hybrid state to cleaved state.
Design of extended NESA
While basic NESA showed much higher sensitivity than hybridization assay, it is not applicable to all sequences. Basic NESA requires that the target should contain the recognition sequence of a nicking enzyme. To overcome this limitation, we improved basic NESA into extended NESA. In the extended version, an isothermal DNA replication technique, RCA, is adopted (57–60). RCA is used as a ‘bridge’ to connect basic NESA and the target of any sequence. This is because RCA can be designed to recognize any target sequence of interest. Moreover, its amplification capacity provides an additional level of amplification to further enhance the sensitivity.
Figure 4 shows the principle of the extended NESA. Compared to basic NESA in Figure 1, the extended assay includes four more elements: DNA padlock probe, DNA ligase, DNA polymerase and primer. Padlock probe is a single-stranded DNA oligonucleotide that hybridizes to the target. The target-binding region is equally split into two segments placed in opposite orientation at each end of the padlock probe so that a circle has to be formed for hybridization to occur. After hybridization, a nick forms, and is sealed by DNA ligase, resulting in a circular padlock probe with two ends connected covalently. The unbound single-stranded region facilitates probe circularization, and permits primer binding so that polymerase can replicate the circle. RCA is an isothermal process in which the polymerase progresses continuously around the loop until the same circle sequence has been duplicated many times, resulting in a long single-stranded DNA consisting of tandem repeats of the complementary sequence of the padlock probe. In extended NESA, the sequence of a molecular beacon is embedded into the padlock probe. Thus, RCA product contains many copies of the sequence that is complementary to the beacon, and each copy can hybridize with one beacon molecule. The beacon is designed to include a recognition sequence for a nicking enzyme. So when the nicking enzyme is added, beacons can be nicked simultaneously at many sites along the single-stranded DNA. In basic NESA, one target DNA acts as one nicking site; in extended NESA, one target DNA produces many nicking sites through RCA, adding one more level of signal amplification. The two ends of the padlock probe can be changed to any sequence, as long as the padlock probe does not form severe secondary structure, to recognize any target of interest. Thus, the sequence limitation in basic NESA is no longer a problem in extended NESA.
Figure 4.

Working principle of extended NESA. Basic NESA is integrated with rolling circle amplification (RCA), in order to recognize target DNA of any sequence of interest. The central element in RCA is the padlock probe, which contains, at its two ends, a target recognition sequence, and, in the middle, a sequence (green color) identical to that of the major portion (loop plus one arm) of a molecular beacon. The molecular beacon contains a nicking enzyme recognition sequence. Extended NESA includes three sequential steps: ligation, polymerization and nicking. At ligation step, a padlock probe hybridizes at two ends to target DNA and is circularized by DNA ligase. At polymerization step, a primer binds to the circularized padlock probe, and is extended by DNA polymerase, producing a long single-stranded DNA composed of tandem copies of the complementary sequence of the padlock probe, with each copy containing a complementary sequence (red color) for the molecular beacon. At nicking step, each red color sequence, like the target sequence in basic NESA, acts as a mobile catalytic site, and leads to the nicking of many molecular beacons in the presence of nicking enzymes. To be consistent with the terms used in the basic nicking assay, we designated the target DNA as the primary target, and the red color sequence in the RCA product the secondary target. In extended NESA, the primary target does not need to contain nicking enzyme recognition sequence. Extended NESA has two levels of signal amplification: each primary target induces many secondary targets through RCA, and each secondary target brings about cleavage of many beacon molecules.
Test extended NESA
As a proof of principle, we used extended NESA to detect a synthetic DNA target. The target is a 40-base DNA oligonucleotide of an artificial sequence. A padlock probe, a primer and a beacon were designed accordingly. The recognition sequence of N. BstNB I was included in the probe and the beacon. We conducted the extended assay in two major stages. In the first stage, we followed the RCA reaction in the absence of nicking enzymes, and the result was shown in Figure 5a. In the second stage, we added the nicking enzyme to the finished RCA reaction mixture to record the nicking process, with results shown in Figure 5b. Nine samples were examined. Seven of them contain target DNA at different dilutions: 1000 pM, 100 pM, 10 pM, 1 pM, 0.5 pM, 0.1 pM and 0 pM. The other two contain DNA of random sequences, both at 1 nM, to replace the target DNA. The samples went through ligation step first, in the presence of padlock probe, target DNA and T4 DNA ligase. Following that, phi29 DNA polymerase, primer and beacon were added to start RCA reaction. The observation of RCA was performed on a real-time PCR machine (here the machine was used simply as a plate reader) with all samples loaded into microwells of a plastic 96-well PCR plate. After RCA reaction, the nicking enzyme was added into each sample to observe the nicking reaction.
Figure 5a shows the time courses of RCA with different target concentrations. Taking the 1 nM time course as one example, the fluorescence intensity increased almost linearly with time until it reached a plateau in about 100 min. The increase in fluorescence intensity indicates that polymerization and hybridization were going on. The fluorescence intensity plateaued because the beacons were used up, as confirmed by a control experiment in which the intensity continued to increase linearly when more beacons were added into the finished RCA reaction mixture (data not shown). The fact that it took about 2 h for all the beacons to hybridize suggests that polymerization, instead of hybridization, is the speed-limiting step, since the hybridization step could be much quicker if there was enough polymerization product. Actually, hybridization took <1 min after the beacons were added into a RCA reaction mixture that had proceeded for 3 h without beacons (data not shown). The quick hybridization made it possible to follow RCA process in real time without significant delay. Thus, the increase in fluorescence intensity in Figure 4a is proportional to the speed of RCA process. Because RCA is a linear amplification technique, the fluorescence intensity increased linearly. It is noteworthy that, at the initial stage of RCA, the increase in fluorescence intensity is slower. This may reflect the time to form polymerase–template–primer complex plus the time to make the first copy of the RCA probe (the first copy was not available for hybridization until it dissociated from RCA probe after the first cycle).
As expected, the increase in fluorescence intensity slowed down when the target concentration was reduced. At 100 pM, there were enough beacon molecules to follow the polymerization during the entire time of recording, as evidenced by the linearity of the whole time course curve. From the 100 pM time course curve, the average length of the RCA product can be estimated. At the end of the polymerization, about 17% of beacon molecules were opened. Given 100 pM of the target and 150 nM of the beacon, one target led to the opening of about 255 beacons in average. This means that the signal has been amplified by 255-fold, compared to the traditional hybridization assay. If we presume that one target led to one RCA product (one single-stranded DNA molecule) and that the beacon hybridization efficiency was 100%, then, in order to open 255 beacon molecules, each RCA product molecule should contain 255 copies of the padlock probe sequence. Since each padlock probe has 93 nt, the RCA product is estimated to be ∼23 kb long in average. The length of the RCA product would increase linearly with time, as indicated by the trend in the 100 pM time course curve. Previous study indicates that several thousand copies of padlock probe could be made in overnight RCA reaction (60). When the target concentration dropped down to 10 pM, the signal became close to background (0 pM). When the concentration further decreased to 1 pM, 0.5 pM, 0.1 pM or when the target DNA was replaced by DNA of random sequences, the signal could not be distinguished from the background (data not shown). To determine the detection limit, we repeated four times the time courses for 10 pM and 0 pM samples. The detection limit for RCA was estimated to be about 6.5 pM.
After RCA step, we added N.BstNB I into each sample to start the nicking reaction. Through nicking, the fluorescent signal for the target of low concentrations was dramatically increased. Figure 5b shows the time courses of nicking reactions for the target at 10 pM and lower concentrations. The target of 10 pM, which was barely detectible by RCA (Figure 5a), induced quick increase in fluorescence intensity in the nicking step. The signal plateaued in about half an hour. Similar to the trend demonstrated for basic NESA in Figure 3a, the increase in fluorescence intensity slowed down with the dilution of the target. The signal became close to background (0 pM sample) when the target concentration dropped to 100 fM. After repeating the time courses for the 100 fM and control samples four times each, we calculated a detection limit of ∼85 fM. When target DNA was replaced by DNA of random sequences, the time courses were indistinguishable from those of the background (data not shown), indicating sequence specificity of the extended assay.
A steady-state kinetic model of NESA
As can be seen from the reaction mechanism proposed in Figure 1, basic NESA includes two catalysts: one is the nicking enzyme, and the other one is the target DNA that helps cleave the beacon but is not consumed by the overall reaction. Hence, this is a reaction system with two enzymes and one substrate. Moreover, multiple distinct reaction steps are involved. As a result, basic NESA is more complicated than traditional ‘Michaelis–Menten’ system. Therefore, it is necessary to build a new kinetic model in order to understand the kinetics of the NESA assay. Here, we propose Model 1 for the steady-state kinetics of basic NESA reaction.
Model 1.

In this model, beacon molecules (B) are converted into final products, the cleaved fragments, B1 and B2 (If B1 represents the fluorophore bearing piece, B2 stands for the quencher bearing piece, and vice versa), through six steps:
B and target molecule (T) form a hybrid (BT).
Nicking enzyme (E) binds BT, forming a complex (EBT).
E cleaves B into two pieces, B1 and B2, converting EBT into a new complex, EB1TB2.
E dissociates from EB1TB2, leading to free E and a 3-in-1 hybrid (B1TB2).
B1TB2 dissociates, with B1 and B2 dissociating from T independently, leaving a 2-in-1 hybrid (B1T or TB2).
Independently, B1T and TB2 dissociate and form the final products, B1 and B2, with free T released.
The terms, k1 to k6, are rate constants for the forward reaction of each step; k–1, k–2, k–4, k–5, k–6, are rate constants for the corresponding backward reaction. Since we presume that B1 and B2 dissociate from T independently, the rate constant for each dissociation is considered unchanged irrespective of whether the dissociation occurs in 2-in-1 or in 3-in-1 complex. It is noteworthy that we have considered the reverse reactions of all steps except the third step. Even though there is a theoretical possibility that the nicking enzyme can act as a ligase, we believe its ligation activity must be overwhelmed by its nicking activity, supported by our failure to detect any ligated product from the nicked fragments using N. BstNB I (data not shown).
Model 1 can be simplified by ignoring the reverse reactions for the last two steps, as shown in Model 2. These reverse reactions are negligible for two reasons. First, for an appropriately designed beacon, B1 and B2 are too short to hybridize back to T under the reaction temperature. Second, we are mainly interested in the initial stage of the steady state, at which the concentrations of B1 and B2 are very low.
Model 2.

If B is present at significantly higher concentration than T, which was the case in our experiments, then, after the reaction components are mixed, the reaction system will move quickly from pre-steady state to steady state. At steady state, the concentration of each intermediate species is a constant at short time scale. For each species, therefore, the rate of formation and the rate of breakdown are equal. Given the six intermediate species in the model, we have
| (1) |
| (2) |
| (3) |
| (4) |
| (5) |
| (6) |
Consider the following relationship among concentrations
| (7) |
| (8) |
Here [Et] and [Tt] are the total concentration of E and T, respectively. In NESA, we keep both [Bt] (the total concentration of B) and [Et] significantly higher than [Tt]. Therefore,
| (9) |
Substitute Equations (8) and (9) into the group of Equations (1) through (6), and rearrange, then
 |
(10) |
| (11) |
| (12) |
| (13) |
| (14) |
| (15) |
Solving this system of equations, we get the analytical solutions for all six intermediate species, among which,
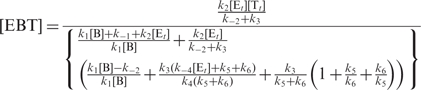 |
(16) |
Hence, we get reaction rate
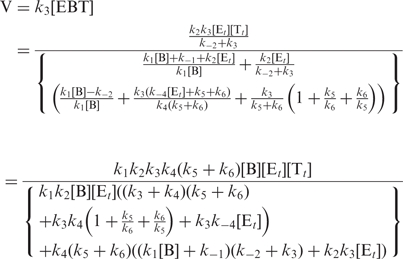 |
(17) |
This equation indicates that the steady-state reaction rate of NESA is a function of [B], [Et], [Tt] and all nine rate constants. Once E, B, T and experimental conditions are chosen, all rate constants become fixed. Then V changes with only [B], [Et] and [Tt]. To better understand the kinetics of NESA, we have discussed how V changes with [Tt], [B], [Et], independantly (supplementary data).
If we define
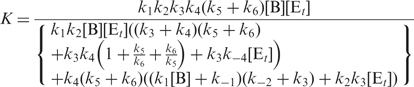 |
Equation (17) becomes
| (18) |
K is a pseudo first-order rate constant which is dependent on [B] and [Et].
Equation (18) indicates that the steady-state reaction rate of NESA is proportional to the total concentration of the target when [B] and [Et] are fixed. This is consistent with our previous observation and reasoning on the relationship between target concentration and the half reaction time (Figure 3). One application of this linear relationship is that target DNA can be quantified by measuring reaction rate.
Quantitation of target DNA using initial reaction rate
In previous figures, we have shown the time courses of basic and extended NESA on different concentrations of target DNA. To use NESA to quantify target of unknown concentration, one straightforward method is to record standard time courses of NESA for known concentrations of serially diluted target, and compare with them the time course of the unknown. However, this method is time consuming and less accurate.
A better method for target quantitation is to construct standard curves with the reaction rate of NESA. Equation (18) indicates that the steady-state reaction rate of NESA is proportional to the concentration of the target. Reaction rates can be measured for known concentrations of serially diluted target, and plotted against the concentrations. A standard curve can be obtained by fitting the data points with linear regression. Once the reaction rate is measured for an unknown, its concentration can be estimated graphically from the standard curve or calculated numerically from the equation of the standard curve. Compared with the first one, this method is more accurate since it takes the advantage of the linear relationship between the reaction rate and target concentration. Also, it is more convenient, since only a small part of each time course is needed to measure the reaction rate.
In principle, reaction rate at any stage of a time course can be used for the construction of standard curves. For several reasons, however, reaction rate at initial stage (V0) is much more preferred. First, measuring V0 requires only the beginning part of the time course, saving time. Second, in Equation (18), K is a function of [B], and, therefore, [B] should be fixed in order for K to be treated as a constant. For those time course fragments from which reaction rates are calculated, care should be taken that [B]s are the same. This is easy for V0 measurement since all [B]s at initial stages equals to [Bt]. For late stage measurement, however, additional measurement is necessary to make sure that the remaining [B] are the same throughout all time course fragments. Third, at late stage, Equation (18) may not hold well (at least not proven yet). At late stage, more product accumulate, weakening one of the two prerequisites for the simplification from Model 1 to Model 2.
For initial stage, Equation (18) changes to
 |
(19) |
To construct a standard curve, [Tt] may span several orders of magnitudes, which necessitates log transformation of the variables. The mathematical basis of a standard curve can be derived by taking the logarithm of Equation (19):
| (20) |
Let
| (21) |
| (22) |
| (23) |
Equation (20) becomes
| (24) |
Equation (24) indicates that,, for a series of [V0]s and [Tt]s that follow Equation (19), if we plot [V0] versus [Tt] in their logarithm, we should get a straight line with slope as 1 and intercept as Log(K0).
For basic NESA, we measured [V0] for a series of dilutions of target DNA. Figure 6a shows the plot of Log([V0]) versus Log([Tt]). The data points were fitted to a straight line, the standard curve, using least square linear regression. The coefficient of determination, R2, is 0.9813, indicating a good fitting.
Figure 6.

Construction of standard curves using initial reaction rate. The two charts are double log plots of initial reaction rate (V0) and target concentration (C) for basic NESA (a) and extended NESA (b), respectively. Each data point represents the average of four measurements, with the error bar standing for standard deviation. The data points were fitted with least square linear regression. Shown above each trend line are equation and coefficient of determination. In each equation, x and y stand for Log(C) and Log (V0), respectively. The slopes of the trend lines are close to 1 in both tests, verifying the linear relationship between the initial reaction rate and target concentration.
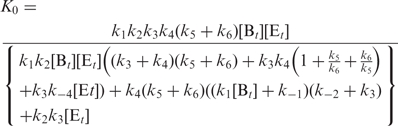
The equation of the standard curve is
| (25) |
According to equations (20–23), it follows
| (26) |
This indicates that, within the limits of experimental error, [V0] is proportional to [Tt]. Therefore, we have experimentally verified the linear relationship expressed in Equations (18) and (19), and, accordingly, determined K0 to be 0.2 s−1.
In extended NESA, the substrate of the nicking enzyme is the secondary target (T') instead of the primary target (T), as shown in Figure 4. Each T′ molecule is a long single-stranded DNA containing many beacon-binding sites. If beacon-binding site is represented by S, and m is the average number of beacon-binding sites induced by one T molecule, then the total concentration of S is
| (27) |
Apply Equation (19) to extended NESA,
| (28) |
K′0 is the pseudo first-order rate constant for the nicking reaction in extended NESA.
Substitute Equation (27) into Equation (28),
| (29) |
Let  , then
| (30) |
Equation (30) indicates that the linear relationship between V0 and [Tt] also holds for extended NESA.
Similar to what we did for basic NESA, we have measured V0 on a series of [Tt] for extended NESA. Figure 6b shows the double log plot and linear fitting. R-squared is 0.9935, induced by one T molecule. The slope of the standard curve is close to 1, verifying the linear relationship between V0 and [Tt].  was calculated to be 6 s−1. Since
  , and m was estimated to be about 255 previously (discussion on Figure 5), we have determined
  to be 0.024 s−1.
We have noticed that  is eight times smaller than K0. This means the nicking reaction on the RCA product is 8-fold slower than that on the oligonucleotide target. This discrepancy mainly arises from the difference in size between oligonucleotide targets and T′ molecules. Compared to an oligonucleotide, the much larger size of T′ molecules has three effects on the reaction kinetics: it slows down the diffusion and rotation of T′ molecules, reduces speed of their conformational change (intramolecular rotation and vibration), and exerts steric hindrance. All three effects decelerate the nicking reaction.
With the standard curves constructed, the concentration of an unknown can be determined as described previously. As a demonstration, we have determined the concentration of a blind sample using extended NESA. V0 was measured four times using the same procedure as that used for constructing the standard curve. Four measurements gave an average reaction rate of 2.35 Ms−1. Substituting this value into the equation in Figure 6b, we get the calculated concentration, 2.07 pM. The expected value of the blind sample turned out to be 2 pM. The relative error is about 4%.
Specificity of NESA
As mentioned earlier, NESA showed high specificity in distinguishing target from random sequence. Now we move one step further to check the specificity of NESA under more stringent condition: perfect target versus imperfect targets that bear a point mutation. Each imperfect target carries only one single base mutation. A series of imperfect targets were made by introducing single base mutations at different positions. Each mutation was made by replacing the original base with its complementary one. Then we tested the response of NESA to all these targets. V0 was calculated for each target. Both basic and extended NESA were examined, with the results presented in Figure 7.
Figure 7.

Detection of single base mutation. All mutations were made by substituting the original base by its complementary base. Initial reaction rates for perfect target (P) and various mutants were compared. (a) Basic NESA. Beacon 1 was used. The sequences of beacon 1 (gray) and the target (black) are shown at the top of the chart. N.BstNB I recognition sequence is underlined. The position of mutation is labeled alphabetically. (b) Extended NESA. At the top of the chart is part of the sequence of the hybrid between the target (black) and padlock probe (gray) near the nick. Mutation positions are numbered. The nick in the padlock probe was sealed by either T4 ligase or E. coli ligase. After rolling circle polymerization, cleavage reaction was carried out, and beacon 2 was used to monitor the cleavage reaction. Two groups of results (gray and black) are presented. T4 ligase was used to obtain the gray group results, and E. coli ligase used to obtain the black group. Each datum is the average of four measurements, and the error bar is the standard deviation.
In Figure 7a, the perfect target and six mutants are compared in term of V0 in basic NESA. The perfect target is the same as the one used in Figures 2 and 3. The mutation position for each mutant is indicated alphabetically. It can be seen that V0 is highly dependent on the position of mutation. Although mutation a, b, c and d are all from C to G, they have dramatically different effect on V0. Compared to the reaction rate for the perfect target, V0 dropped by 35, 76, 37 and 3-fold, respectively, for mutant a, b, c and d. V0 decreased due to one or both of the two effects of mutation: (i) directly disturbing the enzyme binding and/or nicking sites, and (ii) lowering the stability of the target–beacon hybrid. If we presume an all-or-none mechanism for the formation of target–beacon duplex, the position of a mutation has little effect on the stability of the duplex, as long as the mutation is not at the very end, which is the case for mutant a, b, c and d (2). As a result, the second effect of mutation is roughly the same for all four C-to-G mutations. Then the first effect of mutation should account for the difference in V0. Mutation b occurs at the center of the enzyme binding site, resulting in the largest drop in V0. Mutation a is at the edge of the binding site, leading to less drop in V0. Surprisingly, although mutation c is at neither binding site nor nicking site, its effect is as strong as that of mutation a, probably because it can influence both binding and nickings. Lacking the detailed structural information of the enzyme, we cannot predict the interaction between the nucleosides at position c and the surrounding amino acids. It was proposed previously that N.BstNBI has two structural domains: the N-terminal domain for DNA binding and the C-terminal domain for DNA cleavage. Position c is at the linker region between the binding site and nicking site, and the mismatch ‘bubble’ causes the linker region floppy. We guess the floppy nature of the mismatched linker region weakens the coupling between binding and cleavage, and, as a result, slows down the cleavage rate. Further work is necessary to confirm this guess. Mutation d is the furthest from the binding site, and is also out of the linker region. It has the least influence on V0 among the four C-to-G mutations. Yet it still causes significant drop, about 74%, in the speed of nicking, probably due to its influence on the stability of the duplex as well as its close proximity to the nicking site.
Mutation e and f are A-to-T and T-to-A mutation, respectively, at the ends of the target. Their influence on the stability is minor. Mutation f is far away from both binding site and nicking site, which explains why mutation f did not cause any decrease in nicking speed. Mutation e is only one base away from the binding site, giving rise to a 45% drop in speed.
In Figure 7b, the perfect target and six mutants are compared in term of V0 in extended NESA. Two DNA ligases, T4 ligase and Escherichia coli ligase, are used in the ligation step to circularize padlock probes. It can be seen that, in general, E. coli ligase is much more sensitive to mutation than T4 ligase. When E. coli ligase was used, all mutations around the nick site, from position –2 to 3, led to undetectable speed, indicating that ligation was almost completely blocked. When T4 ligase was used, in contrast, even mutations right next to the nick, at position +1 and –1, could not efficiently inhibit the ligation. This suggests that E. coli ligase is the enzyme of choice for single nucleotide polymorphism assay.
DISCUSSION
We have explored a new signal amplification mechanism to improve the sensitivity of molecular beacons. The unique advantage of molecular beacons over traditional nucleic acids probes lies in their ‘switching-on’ working mode: they do not fluoresce brightly until they hybridize to the target molecules (1). Such working feature enables real-time, direct detection of nucleic acids. Although the intrinsic simplicity and convenience makes direct detection attractive, the sensitivity of direct detection is limited, normally around nanomolar range (23,24). Detection of DNA/RNA of lower concentrations necessitates indirect detection, which involves target amplification. Actually, the majority of applications of molecular beacons have been based on real-time PCR, one popular version of indirect detection using PCR to amplify the target. Together with other real-time PCR probes, such as TaqMan, molecular beacons have contributed to many real-time PCR works aimed at various purposes, from pathogen quantitation to gene mutation detection (3). In contrast, direct detection has found limited applications due to its relatively low sensitivity. Recently, instead of target amplification, signal amplification has been introduced in an attempt to boost the sensitivity of direct detection (46,47). Two catalytic beacons have been designed to achieve signal amplification. However, for various reasons, these two catalytic beacons failed to produce sensitivity higher than conventional molecular beacons. In this article, we have described a different signal amplification mechanism, NESA, to significantly raise the sensitivity of molecular beacons.
It is worthwhile to compare NESA with the aforementioned two catalytic beacons (46,47). While all three methods exploited signal amplification for DNA detection, NESA is quite different from the other two in term of the mechanism to amplify the signal. Both catalytic beacons are DNA enzymes consisting of a beacon module and a catalytic module, and the hybridization of target to the beacon module restores the activity of the otherwise inactive catalytic module, converting the substrate, either labeled DNA oligonucleotide or small molecule, into a product that gives out fluorescent or UV absorption signal. In basic NESA, in contrast, beacons themselves are used as the substrate, a protein enzyme is recruited to cleave beacons, and each target molecule acts as a mobile catalytic site. In extended NESA, one more level of signal amplification is added by converting primary targets into secondary targets through RCA. Different signal amplification mechanism produced dramatically different sensitivity of detection. The two catalytic beacons offer detection limit of 2 nM and 200 nM, respectively (46,47); in contrast, NESA can detect DNA down to several picomolar or even <100 fM, which is lower by 3–6 orders of magnitude.
Though our focus was to develop basic and extended NESA in this report, hybridization assay and RCA assay were also examined. It is worthy to compare the detection limit of the four assays. The detection limit is 4.2 nM for hybridization, 6.3 pM for basic NESA, 6.5 pM for RCA and 85 fM for extended NESA. Basic NESA and RCA assays have comparable detection limits, which are nearly three orders of magnitude lower than that of the traditional hybridization assay. Extended NESA, which combines basic nicking and RCA assay, further lowers the detection limit by nearly 2 orders of magnitude. Therefore, the extended NESA not only makes it possible to detect any target sequence of interest, it also significantly improved the sensitivity of basic NESA.
Two factors are important to the success of observing the extended NESA. The first is the design of the beacon. Other authors have monitored RCA reaction using molecular beacons previously (61). They observed two phenomena. One is that molecular beacons went through severe sticky end pairing if only the loop portion was involved in the hybridization process. The other observation is that the 3′-5′ exonuclease activity of phi29 DNA polymerase caused nonspecific digestion of molecular beacons, leading to RCA-independent rise in fluorescence. The sticky end pairing they observed is more severe than our observation in Figure 2 and in our previous report (52). This is because, in RCA, sticky end pairing is facilitated by the interaction between neighboring beacons binding to the same single-stranded DNA (61). To avoid sticky end pairing, one solution is to make one arm of the beacon also complementary to the target (52,61,63); to avoid nonspecific digestion, 2′-O-Methyl-RNA bases can be used to replace DNA for the synthesis of molecular beacons (29–31,45,61,62). Here we adopted these two strategies in designing our beacon. It is noteworthy that only the 3′ arm of our beacon was made with 2′-O-Methyl-RNA bases, because previous study indicated that 3′ modification provided enough protection to the beacon (61). The second factor to the success of the extended assay is the primer design. In the extended NESA, the padlock probe was designed to be complementary to the whole target oligonucleotide, so the target itself can initiate polymerization even without a primer. However, a primer was still necessary at the polymerization step in order to prevent the hybridization of unused padlock probes to the single-stranded RCA product. When the target concentration is lower than the padlock probe concentration, only a part of the padlock probe will be circularized at the ligation step. At the polymerization step, the unused probes will hybridize to the RCA product and subsequently block the binding of molecular beacons. This will decrease the sensitivity of the assay, especially when the target concentration is much lower than the probe concentration, in which case almost all of the probes remain unused. In addition, the primer should extend all the way into the target-binding region until the 3′ end of the padlock probe in order to turn the whole padlock probe into double-stranded form. If the primer does not cover the 3′ end of the padlock probe, the 3′ end of the unused probes will remain single-stranded and hybridize to the RCA product. Even though the 3′ end of the probe does not share the same binding site with the beacon, probe binding can cause steric hindrance that will discourage the hybridization of the beacon to the RCA product.
The sensitivity of NESA can be further improved by optimizing the assay system. In principle, any change will help as long as it can enhance the difference between signal and background. The background can be suppressed by improving the design of molecular beacons and the purity of nicking enzyme preparation. More efficient quencher and more stable stem-and-loop structure will lower background fluorescence; less contamination of nicking enzyme by DNA nucleases will reduce nonspecific digestion of molecular beacon. The signal can be increased in several ways. Using brighter fluorophore to synthesize beacons is one choice. Another apparent yet less attractive approach is to prolong the reaction time, since both RCA and nicking reactions showed a linear increase in fluorescent signal when the target concentration was low (Figure 5). A more attractive approach is to increase the speed of RCA and nicking reaction, which is worth further discussion. As can be seen from Equation (17), the speed of nicking is a function all nine rate constants and the concentrations of target, beacon and enzyme. The rate constants are determined by the nature (including structure and sequence) of the three species and the experimental conditions (such as temperature, buffer composition, etc.). So eventually the speed of nicking is a function of the nature and concentrations of the three species as well as experimental conditions. Similarly, the speed of RCA should be a function of the nature and concentrations of DNA polymerase, padlock probe and dNTP as well as experimental conditions. A systematic optimization of all of these factors should result in a significant increase in the speed of both nicking and RCA reactions.
To accelerate nicking, for example, we have examined the effect of the length of probe sequences that flank the binding-and-nicking region. It can be seen from Figure 1 and Model 1 or 2 that the overall nicking reaction includes three major steps: hybridization, cleavage and dissociation. The flanking sequences have significant impact on the value(s) of the rate constant(s) of each step, because they influence the affinity between the two complementary strands as well as the affinity between the enzyme and the substrate. If the change in flanking bases leads to acceleration of the rate-limiting step, the overall reaction speed will increase. In our preliminary results, a 50-fold increase in the speed of nicking was achieved by simply tuning the length of flanking sequences (Supplementary Data).
Aside from high sensitivity, NESA, in its extended version, offers several other advantages. First, it has very high specificity, as demonstrated in Figure 7, which originated from the ligation step in RCA, and enables the detection of single-nucleotide differences in the target sequence (59,64–66). Second, only one molecular beacon is needed for many different targets, because padlock probes can be designed to contain the same beacon sequence in the middle and different target recognition sequences at both ends. Third, RNA can also be detected because padlock probes can be circularized using RNA as templates (66–68). Finally, compared to PCR, NESA is an isothermal assay, which eliminates the requirement of thermal cycling. These features should make the extended NESA useful for various applications involving the detection of nucleic acids, for example, parallel analysis of SNP of a large number of genes.
SUPPLEMENTARY DATA
Supplementary Data are available at NAR Online.
ACKNOWLEDGEMENTS
We thank Charles Glen Kulwin, Mark Joseph Stanisz, Jamie Metcalfe and Yuichi Taniguchi for their assistance on experiments. We thank Drs Sanjay Taygi, Weihong Tan, Ali Khademhosseini, Gary Holtom and Yuichi Taniguchi for reading and discussion on the manuscript. This work was supported by National Institute of Health Grant R21-GM-070360-01 and Applied Biosystems. Funding to pay the Open Access publication charges for this article was provided by National Institute of Health.
Conflict of interest statement. None declared.
Note added in proof: After submission of the revised manuscript, we became aware of a paper reporting a similar signal amplification technique, interestingly with the same acronym, NESA (69).
REFERENCES
- 1.Tyagi S, Kramer FR. Molecular beacons: probes that fluoresce upon hybridization. Nat. Biotechnol. 1996;14:303–308. doi: 10.1038/nbt0396-303. [DOI] [PubMed] [Google Scholar]
- 2.Bonnet G, Tyagi S, Libchaber A, Kramer FR. Thermodynamic basis of the enhanced specificity of structured DNA probes. Proc. Natl Acad. Sci. USA. 1999;96:6171–6176. doi: 10.1073/pnas.96.11.6171. [DOI] [PMC free article] [PubMed] [Google Scholar]
- 3.Marras SAE, Tyagi S, Kramer FR. Real-time assays with molecular beacons and other fluorescent nucleic acid hybridization probes. Clin. Chim. Acta. 2006;363:48–60. doi: 10.1016/j.cccn.2005.04.037. [DOI] [PubMed] [Google Scholar]
- 4.Vet JA, Majithia AR, Marras SAE, Tyagi S, Dube S, Poiesz BJ, Kramer FR. Multiplex detection of four pathogenic retroviruses using molecular beacons. Proc. Natl Acad. Sci. USA. 1999;96:6394–6399. doi: 10.1073/pnas.96.11.6394. [DOI] [PMC free article] [PubMed] [Google Scholar]
- 5.Varma-Basil M, El-Hajj H, Marras SAE, Hazbon MH, Mann JM, Connell ND, Kramer FR, Alland D. Molecular beacons for multiplex detection of four bacterial bioterrorism agents. Clin. Chem. 2004;50:1060–1062. doi: 10.1373/clinchem.2003.030767. [DOI] [PubMed] [Google Scholar]
- 6.Templeton KE, Scheltinga SA, Beersma MF, Kroes AC, Claas EC. Rapid and sensitive method using multiplex real-time PCR for diagnosis of infections by influenza A and influenza B viruses, respiratory syncytial virus, and parainfluenza viruses 1, 2, 3, and 4. J. Clin. Microbiol. 2004;42:1564–1569. doi: 10.1128/JCM.42.4.1564-1569.2004. [DOI] [PMC free article] [PubMed] [Google Scholar]
- 7.Sum SS, Wong DK, Yuen MF, Yuan HJ, Yu J, Lai CL, Ho D, Zhang L. Real-time PCR assay using molecular beacon for quantitation of hepatitis B virus DNA. J. Clin. Microbiol. 2004;42:3438–3440. doi: 10.1128/JCM.42.8.3438-3440.2004. [DOI] [PMC free article] [PubMed] [Google Scholar]
- 8.Elsayed S, Plewes K, Church D, Chow B, Zhang K. Use of molecular beacon probes for real-time PCR detection of Plasmodium falciparum and other plasmodium species in peripheral blood specimens. J. Clin. Microbiol. 2006;44:622–624. doi: 10.1128/JCM.44.2.622-624.2006. [DOI] [PMC free article] [PubMed] [Google Scholar]
- 9.Poddar SK. Symmetric vs asymmetric PCR and molecular beacon probe in the detection of a target gene of adenovirus. Mol. Cell Probes. 2000;14:25–32. doi: 10.1006/mcpr.1999.0278. [DOI] [PubMed] [Google Scholar]
- 10.Balashov SV, Gardiner R, Park S, Perlin DS. Rapid, high-throughput, multiplex, real-time PCR for identification of mutations in the cyp51A gene of Aspergillus fumigatus that confer resistance to itraconazole. J. Clin. Microbiol. 2005;43:214–222. doi: 10.1128/JCM.43.1.214-222.2005. [DOI] [PMC free article] [PubMed] [Google Scholar]
- 11.Pierce KE, Rice JE, Sanchez JA, Wangh LJ. Detection of cystic fibrosis alleles from single cells using molecular beacons and a novel method of asymmetric real-time PCR. Mol. Hum. Reprod. 2003;9:815–820. doi: 10.1093/molehr/gag100. [DOI] [PubMed] [Google Scholar]
- 12.Lai JP, Yang JH, Douglas SD, Wang X, Riedel E, Ho WZ. Quantification of CCR5 mRNA in human lymphocytes and macrophages by real-time reverse transcriptase PCR assay. Clin. Diagn. Lab. Immunol. 2003;10:1123–1128. doi: 10.1128/CDLI.10.6.1123-1128.2003. [DOI] [PMC free article] [PubMed] [Google Scholar]
- 13.Marras SAE, Kramer FR, Tyagi S. Multiplex detection of single-nucleotide variations using molecular beacons. Genet. Anal. 1999;14:151–156. doi: 10.1016/s1050-3862(98)00018-7. [DOI] [PubMed] [Google Scholar]
- 14.Marras SAE, Kramer FR, Tyagi S. Genotyping SNPs with molecular beacons. Methods Mol. Biol. 2003;212:111–128. doi: 10.1385/1-59259-327-5:111. [DOI] [PubMed] [Google Scholar]
- 15.Piatek AS, Tyagi S, Pol AC, Telenti A, Miller LP, Kramer FR, Alland D. Molecular beacon sequence analysis for detecting drug resistance in Mycobacterium tuberculosis. Nat. Biotechnol. 1998;16:359–363. doi: 10.1038/nbt0498-359. [DOI] [PubMed] [Google Scholar]
- 16.Täpp I, Malmberg L, Rennel E, Wik M, Syvanen AC. Homogeneous scoring of single-nucleotide polymorphisms: comparison of the 5′-nuclease TaqMan assay and molecular beacon probes. Biotechniques. 2000;28:732–738. doi: 10.2144/00284rr02. [DOI] [PubMed] [Google Scholar]
- 17.Tyagi S, Bratu DP, Kramer FR. Multicolor molecular beacons for allele discrimination. Nat. Biotechnol. 1998;16:49–53. doi: 10.1038/nbt0198-49. [DOI] [PubMed] [Google Scholar]
- 18.Leone G, van Schijndel H, van Gemen B, Kramer FR, Schoen CD. Molecular beacon probes combined with amplification by NASBA enable homogeneous, real-time detection of RNA. Nucleic Acids Res. 1998;26:2150–2155. doi: 10.1093/nar/26.9.2150. [DOI] [PMC free article] [PubMed] [Google Scholar]
- 19.Weusten JJ, Carpay WM, Oosterlaken TA, van Zuijlen MC, van de Wiel PA. Principles of quantitation of viral loads using nucleic acid sequence-based amplification in combination with homogeneous detection using molecular beacons. Nucleic Acids Res. 2002;30:e26. doi: 10.1093/nar/30.6.e26. [DOI] [PMC free article] [PubMed] [Google Scholar]
- 20.Ayele W, Pollakis G, Abebe A, Fisseha B, Tegbaru B, Tesfaye G, Mengistu Y, Wolday D, van Gemen B, Goudsmit J, et al. Development of a nucleic acid sequence-based amplification assay that uses gag-based molecular beacons to distinguish between Human Immunodeficiency Virus type 1 subtype C and C' infections in Ethiopia. J. Clin. Microbiol. 2004;42:1534–1541. doi: 10.1128/JCM.42.4.1534-1541.2004. [DOI] [PMC free article] [PubMed] [Google Scholar]
- 21.Loens K, Beck T, Goossens H, Ursi D, Overdijk M, Sillekens P, Ieven M. Development of conventional and real-time nucleic acid sequence-based amplification assays for detection of Chlamydophila pneumoniae in respiratory specimens. J. Clin. Microbiol. 2006;44:1241–1244. doi: 10.1128/JCM.44.4.1241-1244.2006. [DOI] [PMC free article] [PubMed] [Google Scholar]
- 22.Moore C, Hibbitts S, Owen N, Corden SA, Harrison G, Fox J, Gelder C, Westmoreland D. Development and evaluation of a real-time nucleic acid sequence based amplification assay for rapid detection of influenza A. J. Med. Virol. 2004;74:619–628. doi: 10.1002/jmv.20221. [DOI] [PMC free article] [PubMed] [Google Scholar]
- 23.Zhang P, Beck T, Tan W. Design of a molecular beacon DNA probe with two fluorophores. Angew. Chem. Int. Ed. Engl. 2001;40:402–405. doi: 10.1002/1521-3773(20010119)40:2<402::AID-ANIE402>3.0.CO;2-I. [DOI] [PubMed] [Google Scholar]
- 24.Xi C, Balberg M, Boppart SA, Raskin L. Use of DNA and peptide nucleic acid molecular beacons for detection and quantification of rRNA in solution and in whole cells. Appl. Environ. Microbiol. 2003;69:5673–5678. doi: 10.1128/AEM.69.9.5673-5678.2003. [DOI] [PMC free article] [PubMed] [Google Scholar]
- 25.Liu X, Tan W. A fiber-optic evanescent wave DNA biosensor based on novel molecular beacons. Anal. Chem. 1999;71:5054–5059. doi: 10.1021/ac990561c. [DOI] [PubMed] [Google Scholar]
- 26.Epstein JR, Leung AP, Lee KH, Walt DR. High-density, microsphere-based fiber optic DNA microarrays. Biosens. Bioelectron. 2003;18:541–546. doi: 10.1016/s0956-5663(03)00021-6. [DOI] [PubMed] [Google Scholar]
- 27.Sokol DL, Zhang X, Lu P, Gewirtz AM. Real time detection of DNA.RNA hybridization in living cells. Proc. Natl Acad. Sci. USA. 1998;95:11538–11543. doi: 10.1073/pnas.95.20.11538. [DOI] [PMC free article] [PubMed] [Google Scholar]
- 28.Nitin N, Santangelo PJ, Kim G, Nie S, Bao G. Peptide-linked molecular beacons for efficient delivery and rapid mRNA detection in living cells. Nucleic Acids Res. 2004;32:e58. doi: 10.1093/nar/gnh063. [DOI] [PMC free article] [PubMed] [Google Scholar]
- 29.Bratu DP, Cha BJ, Mhlanga MM, Kramer FR, Tyagi S. Visualizing the distribution and transport of mRNAs in living cells. Proc. Natl Acad. Sci. USA. 2003;100:13308–13313. doi: 10.1073/pnas.2233244100. [DOI] [PMC free article] [PubMed] [Google Scholar]
- 30.Tyagi S, Alsmadi O. Imaging native Beta-actin mRNA in motile fibroblasts. Biophys. J. 2004;78:4153–4163. doi: 10.1529/biophysj.104.045153. [DOI] [PMC free article] [PubMed] [Google Scholar]
- 31.Vargas DY, Raj A, Marras SA, Kramer FR, Tyagi S. Mechanism of mRNA transport in the nucleus. Proc. Natl Acad. Sci. USA. 2005:17008–17013. doi: 10.1073/pnas.0505580102. [DOI] [PMC free article] [PubMed] [Google Scholar]
- 32.Li JJ, Fang X, Schuster SM, Tan W. Molecular beacons: A novel approach to detect protein - DNA interactions. Angew. Chem. Int. Ed. Engl. 2000;39:1049–1052. doi: 10.1002/(sici)1521-3773(20000317)39:6<1049::aid-anie1049>3.0.co;2-2. [DOI] [PubMed] [Google Scholar]
- 33.Fang X, Li JJ, Tan W. Using molecular beacons to probe molecular interactions between lactate dehydrogenase and single-stranded DNA. Anal. Chem. 2000;72:3280–3285. doi: 10.1021/ac991434j. [DOI] [PubMed] [Google Scholar]
- 34.Yamamoto R, Baba T, Kumar PK. Molecular beacon aptamer fluoresces in the presence of Tat protein of HIV-1. Genes Cells. 2000;5:389–396. doi: 10.1046/j.1365-2443.2000.00331.x. [DOI] [PubMed] [Google Scholar]
- 35.Hamaguchi N, Ellington A, Stanton M. Aptamer beacons for the direct detection of proteins. Anal. Biochem. 2001;294:126–131. doi: 10.1006/abio.2001.5169. [DOI] [PubMed] [Google Scholar]
- 36.Li JJ, Fang X, Tan W. Molecular aptamer beacons for real-time protein recognition. Biochem. Biophys. Res. Commun. 2002;292:31–40. doi: 10.1006/bbrc.2002.6581. [DOI] [PubMed] [Google Scholar]
- 37.Levy M, Cater SF, Ellington AD. Quantum-dot aptamer beacons for the detection of proteins. Chembiochem. 2005;6:2163–2166. doi: 10.1002/cbic.200500218. [DOI] [PubMed] [Google Scholar]
- 38.Dubertret B, Calame M, Libchaber AJ. Single-mismatch detection using gold-quenched fluorescent oligonucleotides. Nat. Biotechnol. 2001;19:680–681. doi: 10.1038/86762. [DOI] [PubMed] [Google Scholar]
- 39.Yang CJ, Lin H, Tan W. Molecular assembly of superquenchers in signaling molecular interactions. J. Am. Chem. Soc. 2005;127:12772–12773. doi: 10.1021/ja053482t. [DOI] [PMC free article] [PubMed] [Google Scholar]
- 40.Ortiz E, Estrada G, Lizardi PM. PNA molecular beacons for rapid detection of PCR amplicons. Mol. Cell Probes. 1998;12:219–226. doi: 10.1006/mcpr.1998.0175. [DOI] [PubMed] [Google Scholar]
- 41.Seitz O. Solid-phase synthesis of doubly labeled peptide nucleic acids as probes for the real-time detection of hybridization. Angew. Chem. Int. Ed. Engl. 2000;39:3249–3252. doi: 10.1002/1521-3773(20000915)39:18<3249::aid-anie3249>3.0.co;2-m. [DOI] [PubMed] [Google Scholar]
- 42.Petersen K, Vogel U, Rockenbauer E, Nielsen KV, Kolvraa S, Bolund L, Nexo B. Short PNA molecular beacons for real-time PCR allelic discrimination of single nucleotide polymorphisms. Mol. Cell Probes. 2004;18:117–122. doi: 10.1016/j.mcp.2003.10.003. [DOI] [PubMed] [Google Scholar]
- 43.Kuhn H, Demidov VV, Coull JM, Fiandaca MJ, Gildea BD, Frank-Kamenetskii MD. Hybridization of DNA and PNA molecular beacons to single-stranded and double-stranded DNA targets. J. Am. Chem. Soc. 2002;124:1097–1103. doi: 10.1021/ja0041324. [DOI] [PubMed] [Google Scholar]
- 44.Wang L, Yang CJ, Medley CD, Benner SA, Tan W. Locked nucleic acid molecular beacons. J. Am. Chem. Soc. 2005;127:15664–15665. doi: 10.1021/ja052498g. [DOI] [PubMed] [Google Scholar]
- 45.Tsourkas A, Behlke MA, Bao G. Hybridization of 2′-O-methyl and 2'-deoxy molecular beacons to RNA and DNA targets. Nucleic Acids Res. 2003;30:5168–5174. [PMC free article] [PubMed] [Google Scholar]
- 46.Stojanovic MN, de Prada P, Landry DW. Catalytic molecular beacons. Chembiochem. 2001;2:411–415. doi: 10.1002/1439-7633(20010601)2:6<411::AID-CBIC411>3.0.CO;2-I. [DOI] [PubMed] [Google Scholar]
- 47.Xiao Y, Pavlov V, Niazov T, Dishon A, Kotler M, Willner I. Catalytic beacons for the detection of DNA and Telomerase Activity. J. Am. Chem. Soc. 2004;126:7430–7431. doi: 10.1021/ja031875r. [DOI] [PubMed] [Google Scholar]
- 48.Li JJ, Geyer R, Tan W. Using molecular beacons as a sensitive fluorescence assay for enzymatic cleavage of single-stranded DNA. Nucleic Acids Res. 2000;28:e52. doi: 10.1093/nar/28.11.e52. [DOI] [PMC free article] [PubMed] [Google Scholar]
- 49.Morgan RD, Calvet C, Demeter M, Agra R, Kong H. Charaterization of the specific DNA nicking activity of restriction endonuclease N. BstNBI. Biol Chem. 2000;381:1123–1125. doi: 10.1515/BC.2000.137. [DOI] [PubMed] [Google Scholar]
- 50.Higgins LS, Besnier C, Kong H. The nicking endonuclease N.BstNBI is closely related to type IIs restriction endonucleases MlyI and PleI. Nucleic Acids Res. 2001;29:2492–2501. doi: 10.1093/nar/29.12.2492. [DOI] [PMC free article] [PubMed] [Google Scholar]
- 51.Wang H, Hays JB. Preparation of DNA substrates for in vitro mismatch repair. Mol. Biotechnol. 2000;15:97–104. doi: 10.1385/MB:15:2:97. [DOI] [PubMed] [Google Scholar]
- 52.Li JJ, Tan W. A real-time assay for DNA sticky-end pairing using molecular beacons. Anal. Biochem. 2003;312:251–254. doi: 10.1016/s0003-2697(02)00375-5. [DOI] [PubMed] [Google Scholar]
- 53.Bernacchi S, Mely Y. Exciton interaction in molecular beacons: a sensitive sensor for short range modifications of the nucleic acid structure. Nucleic Acids Res. 2001;29:e62. doi: 10.1093/nar/29.13.e62. [DOI] [PMC free article] [PubMed] [Google Scholar]
- 54.Marras SAE, Kramer FR, Tyagi S. Efficiencies of fluorescence resonance energy transfer and contact-mediated quenching in oligonucleotide probes. Nucleic Acids Res. 2002;30:e122. doi: 10.1093/nar/gnf121. [DOI] [PMC free article] [PubMed] [Google Scholar]
- 55.Didenko VV. DNA probes using fluorescence resonance energy transfer (FRET): designs and applications. Biotechniques. 2001;31:1106–1116. doi: 10.2144/01315rv02. [DOI] [PMC free article] [PubMed] [Google Scholar]
- 56.Lewis FD. DNA molecular photonics. Photochem. Photobiol. 2005;81:65–72. doi: 10.1562/2004-09-01-ir-299.1. [DOI] [PubMed] [Google Scholar]
- 57.Khan SA. Plasmid rolling-circle replication: highlights of two decades of research. Plasmid. 2005;53:126–136. doi: 10.1016/j.plasmid.2004.12.008. [DOI] [PubMed] [Google Scholar]
- 58.Nilsson M, Malmgren H, Samiotaki M, Kwiatkowski M, Chowdhary BP, Landegren U. Padlock probes: circularizing oligonucleotides for localized DNA detection. Science. 1994;265:2085–2088. doi: 10.1126/science.7522346. [DOI] [PubMed] [Google Scholar]
- 59.Zhong X, Lizardi PM, Huang X, Bray-Ward PL, Ward DC. Visulization of oligonucleotide probes and point mutations in interphase nuclei and DNA fibers using rolling circle DNA amplification. Proc. Natl Acad. Sci, USA. 2001;98:3940–3945. doi: 10.1073/pnas.061026198. [DOI] [PMC free article] [PubMed] [Google Scholar]
- 60.Baner J, Nilsson M, Mendel-Hartvig M, Landegren U. Signal amplification of padlock probes by rolling circle replication. Nucleic Acids Res. 1998;26:5073–5078. doi: 10.1093/nar/26.22.5073. [DOI] [PMC free article] [PubMed] [Google Scholar]
- 61.Nilsson M, Gullberg M, Dahl F, Szuhai K, Raap AK. Real-time monitoring of rolling-circle amplification using a modified molecular beacon design. Nucleic Acids Res. 2002;30:e66. doi: 10.1093/nar/gnf065. [DOI] [PMC free article] [PubMed] [Google Scholar]
- 62.Sproat BS, Lamond AI, Beijer B, Neuner P, Ryder U. Highly efficient chemical synthesis of 2'-O-methyloligoribonucleotides and tetrabiotinylated derivatives; novel probes that are resistant to degradation by RNA or DNA specific nucleases. Nucleic Acids Res. 1989;17:3373–3386. doi: 10.1093/nar/17.9.3373. [DOI] [PMC free article] [PubMed] [Google Scholar]
- 63.Tsourkas A, Behlke MA, Bao G. Structure-function relationships of shared-stem and conventional molecular beacons. Nucleic Acids Res. 2002;30:4208–4215. doi: 10.1093/nar/gkf536. [DOI] [PMC free article] [PubMed] [Google Scholar]
- 64.Nilsson M, Krejci K, Koch J, Kwiatkowski M, Gustavsson P, Landegren U. Padlock probes reveal single-nucleotide differences, parent of origin and in situ distribution of centromeric sequences in human chromosomes 13 and 21. Nat. Genet. 1997;16:252–255. doi: 10.1038/ng0797-252. [DOI] [PubMed] [Google Scholar]
- 65.Qi X, Bakht S, Devos KM, Gale MD, Osbourn A. L-RCA (ligation-rolling circle amplification): a general method for genotyping of single nucleotide polymorphisms (SNPs) Nucleic Acids Res. 2001;29:e116. doi: 10.1093/nar/29.22.e116. [DOI] [PMC free article] [PubMed] [Google Scholar]
- 66.Christian AT, Pattee MS, Attix CM, Reed BE, Sorensen KJ, Tucker JD. Detection of DNA point mutations and mRNA expression levels by rolling circle amplification in individual cells. Proc. Natl Acad. Sci. USA. 2001;98:14238–14243. doi: 10.1073/pnas.251383598. [DOI] [PMC free article] [PubMed] [Google Scholar]
- 67.Nilsson M, Barbany G, Antson DO, Gertow K, Landegren U. Enhanced detection and distinction of RNA by enzymatic probe ligation. Nat. Biotechnol. 2000;18:791–793. doi: 10.1038/77367. [DOI] [PubMed] [Google Scholar]
- 68.Nilsson M, Antson DO, Barbany G, Landegren U. RNA-templated DNA ligation for transcript analysis. Nucleic Acids Res. 2001;29:578–581. doi: 10.1093/nar/29.2.578. [DOI] [PMC free article] [PubMed] [Google Scholar]
- 69.Kiesling T, Cox K, Davidson EA, Dretchen K, Grater G, Hibbard S, Lasken RS, Leshin J, Skowronski E, Danielsen M. Sequence specific detection of DNA using nicking endonuclease signal amplification (NESA) Nucleic Acids Res. 2007;35:e117. doi: 10.1093/nar/gkm654. [DOI] [PMC free article] [PubMed] [Google Scholar]